
tcpreplay sends the packets in a pcap back out an interface. The basic command is sudo tcpreplay -i eth1 capture.pcap, which keeps the capture's original timing. --pps, --mbps and -x set the rate, --topspeed sends as fast as the box can, --loop repeats the file, and -K loads it into memory first. Use tcprewrite to change MACs, IPs or ports before you replay. The usual job is feeding a known capture into an IDS, a NetFlow collector or a firewall, and checking what comes out the other side.
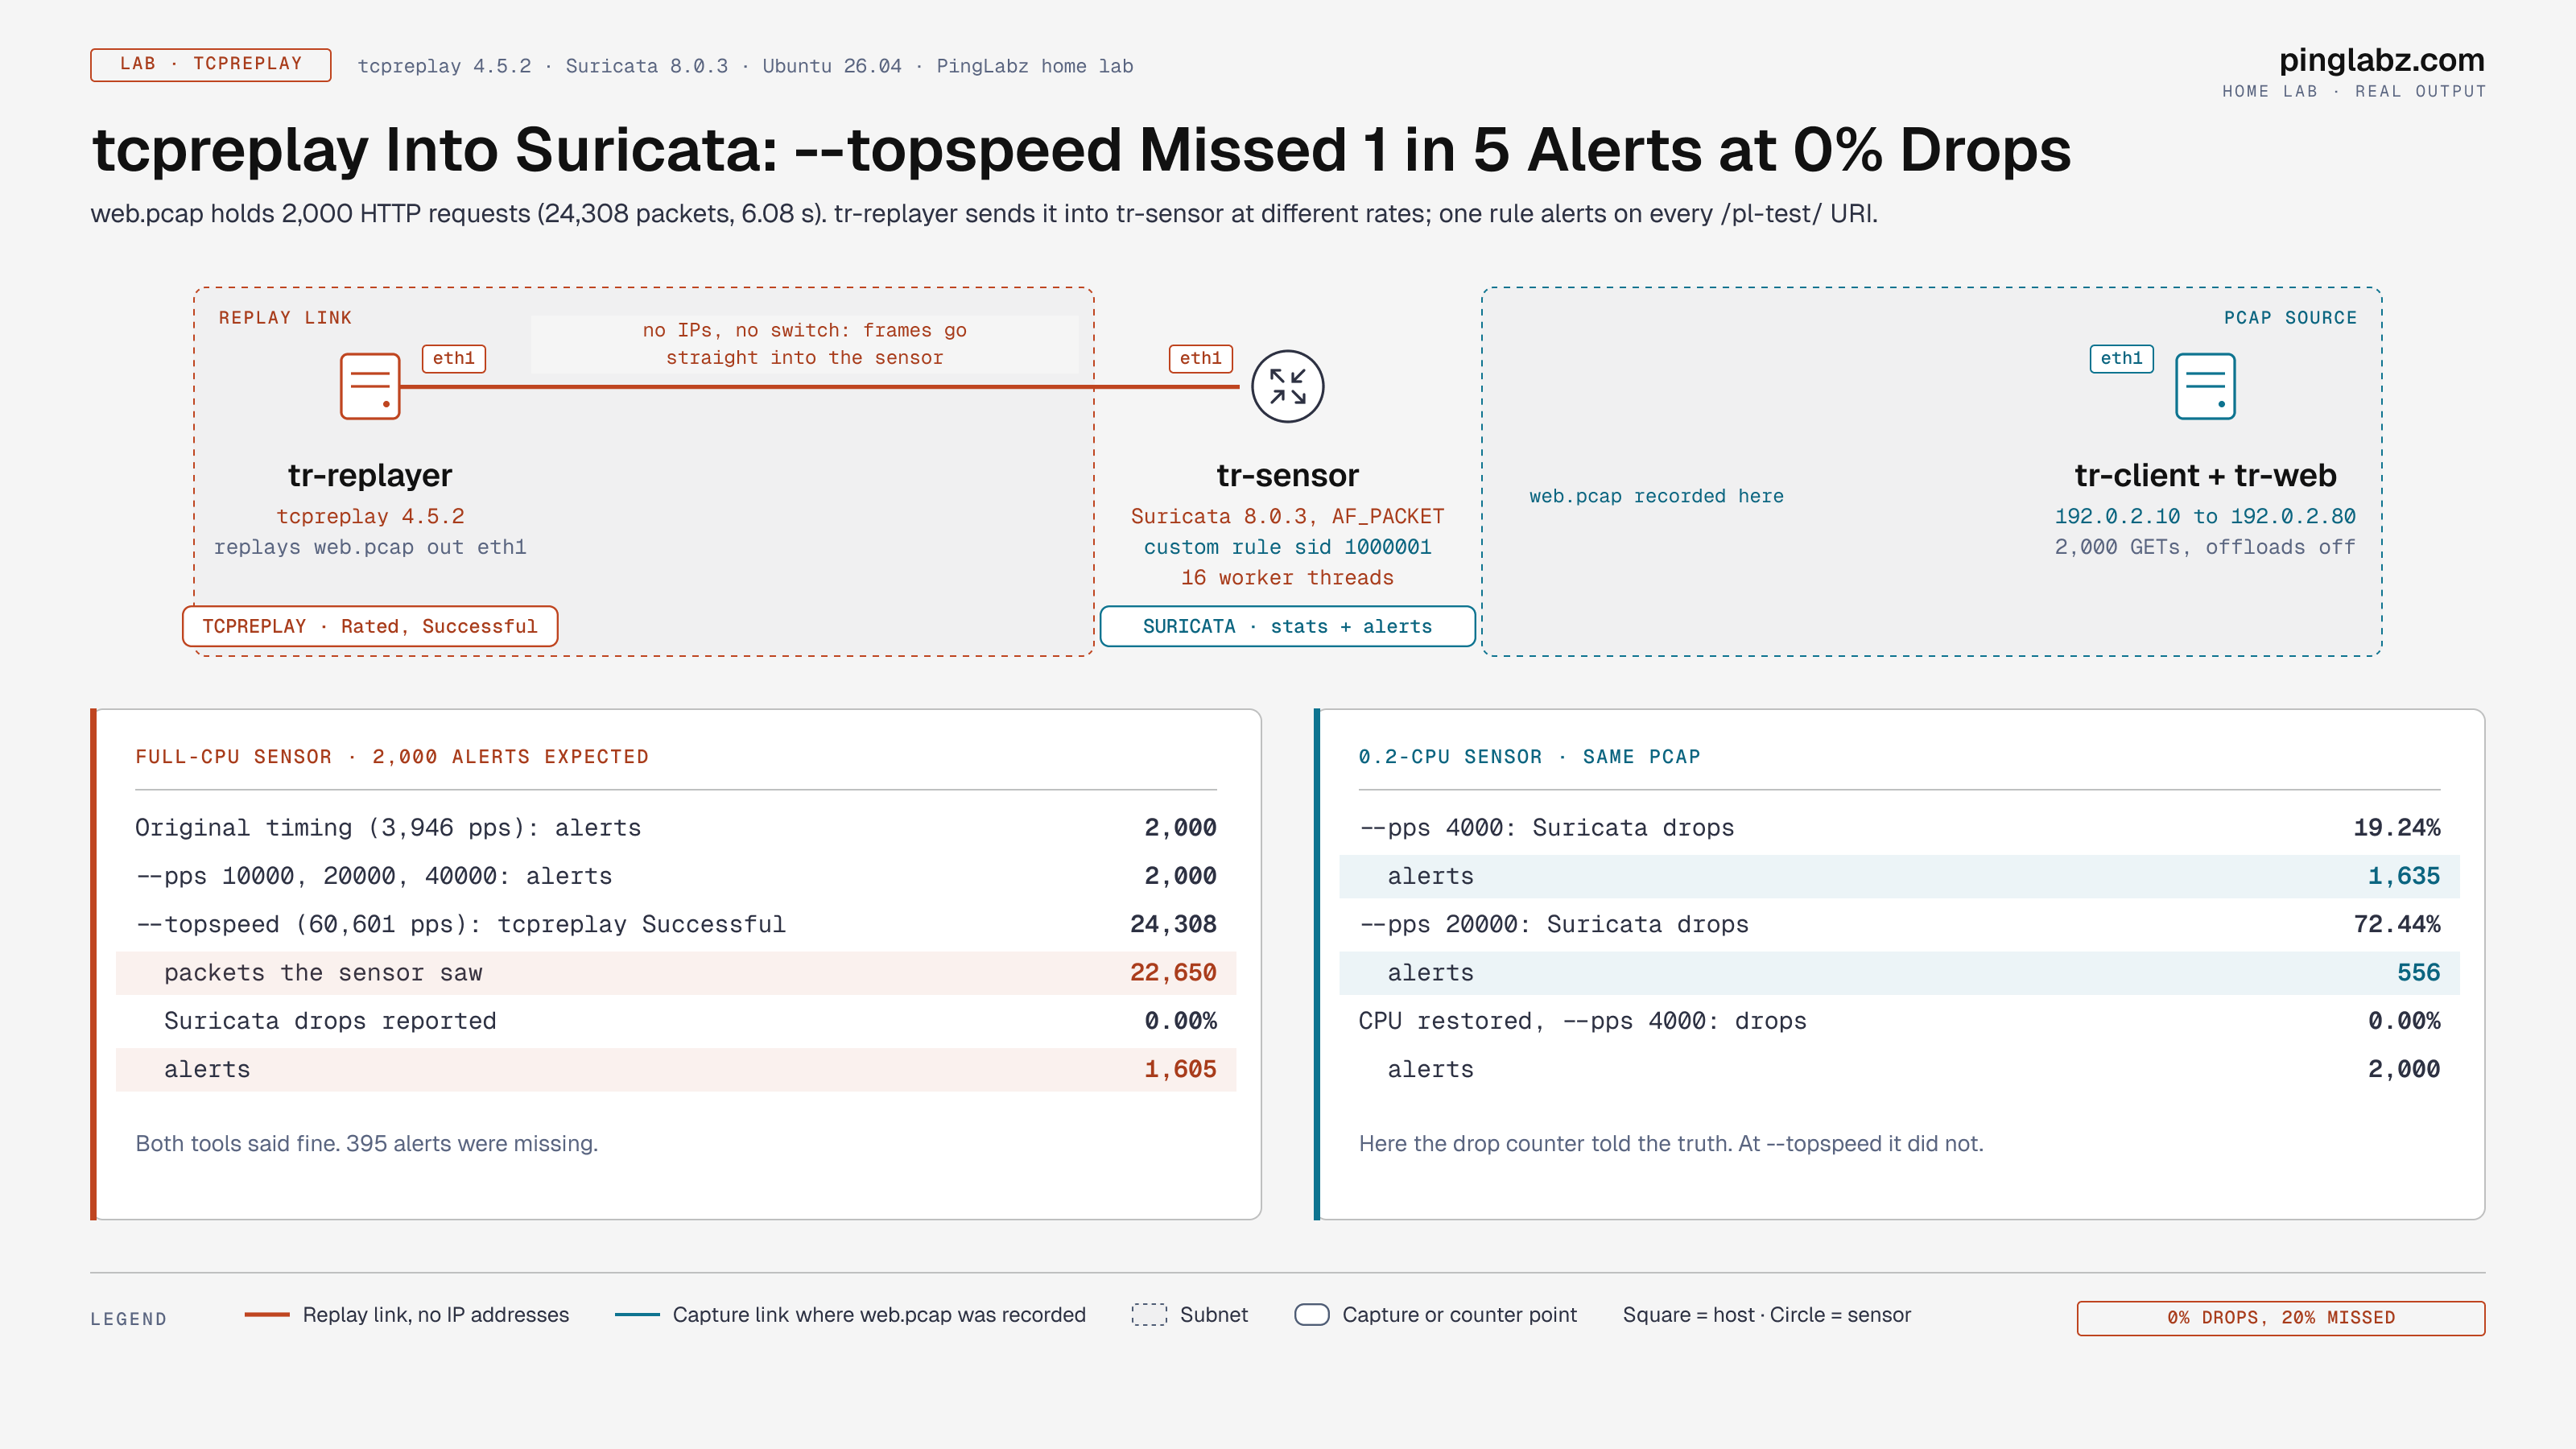
That check is where tcpreplay fools people, so I measured it. I recorded 2,000 HTTP requests (24,308 packets) and replayed them into Suricata with one rule that alerts on every request. At the original speed and at up to 40,000 pps, I got 2,000 of 2,000 alerts. At --topspeed (about 60,600 pps), tcpreplay reported 24,308 successful packets and Suricata reported 0.00% drops, but Suricata saw only 22,650 packets and raised 1,605 alerts. One in five was missing, and neither tool's counters showed it.
Part of the Linux Networking Commands: The Complete Guide. Scope: tcpreplay 4.5.2 on Ubuntu 26.04 (Kali ships the same suite), Suricata 8.0.3 as the sensor, and two Linux hosts that generated the capture, built in my home lab on documentation addresses.
Step 1: Install tcpreplay and check the version
sudo apt install tcpreplay
tcpreplay -V
tcpreplay version: 4.5.2 (build git:v4.5.2) (debug)The package installs the whole suite: tcpreplay to send, tcprewrite to edit headers, tcpprep to split a capture into client and server sides for two-interface replays, and tcpcapinfo to inspect a file. Sending needs root or CAP_NET_RAW.
Two safety rules. Replay only onto a lab segment or a sensor port, never onto the interface you're connected through. And remember that the packets go out with the MACs and IPs they were captured with, unless you rewrite them.
Step 2: Check the capture before you send it
$ capinfos web.pcap
Number of packets:   24 k
Data size:           3097 kB
Capture duration:    6.084793 seconds
Average packet size: 127.42 bytes
Average packet rate: 3994 packets/s

$ tcpcapinfo web.pcap | head -9
file size   = 3486173 bytes
magic       = 0xa1b2c3d4 (tcpdump) (little-endian)
snaplen     = 262144
linktype    = 0x00000001
Packet	OrigLen		Caplen		Timestamp	Csum	Note
1	  74		  74		6af2c82f.d0fe6	9beee	OK
Check three things. linktype 1 is Ethernet, which is what tcpreplay wants. OrigLen equal to Caplen means nothing was cut by the snap length. And frame sizes should fit the outgoing interface's MTU. That last one bites people with captures taken on a host with segmentation offload on; see Step 7.
I made the capture on tr-client with tcpdump -i eth1 -w web.pcap tcp port 80 while it ran 2,000 curl requests to http://192.0.2.80/pl-test/1 through /pl-test/2000, eight at a time.
Step 3: Replay at the original speed
$ sudo tcpreplay -i eth1 web.pcap
Actual: 24308 packets (3097221 bytes) sent in 6.15 seconds
Rated: 502819.9 Bps, 4.02 Mbps, 3946.29 pps
Flows: 4000 flows, 649.38 fps, 24308 unique flow packets, 0 unique non-flow packets
Statistics for network device: eth1
	Successful packets:        24308
	Failed packets:            0
	Truncated packets:         0
	Retried packets (ENOBUFS): 0
	Retried packets (EAGAIN):  0
How to read it: Actual and Rated are what tcpreplay pushed and how fast. Flows: 4000 is 2,000 TCP connections counted once per direction. The device block counts what the send call accepted. Successful means the kernel took the packet. It doesn't mean the packet reached the wire, and the lab below shows the difference.
Step 4: Control the rate
$ sudo tcpreplay -i eth1 -x 10 web.pcap
Rated: 4531015.5 Bps, 36.24 Mbps, 35560.88 pps

$ sudo tcpreplay -i eth1 --mbps 20 web.pcap
Rated: 2499996.7 Bps, 19.99 Mbps, 19620.78 pps

$ sudo tcpreplay -i eth1 --pps 40000 web.pcap
Rated: 5096812.7 Bps, 40.77 Mbps, 40001.44 pps

$ sudo tcpreplay -i eth1 --topspeed web.pcap
Rated: 7721490.2 Bps, 61.77 Mbps, 60600.77 pps
-x 10 keeps the capture's rhythm, bursts included, at ten times the speed. --mbps and --pps flatten it into a constant rate. --topspeed sends as fast as the CPU and driver allow. For load tests, pick --pps or --mbps so the number you report is the number you asked for.
Step 5: Loop, preload and limit
$ sudo tcpreplay -i eth1 -K --loop 3 --pps 40000 web.pcap
File Cache is enabled
Actual: 72924 packets (9291663 bytes) sent in 1.82 seconds
Rated: 5096698.1 Bps, 40.77 Mbps, 40000.54 pps

$ sudo tcpreplay -i eth1 --limit 1000 --pps 1000 web.pcap
Actual: 1000 packets (126621 bytes) sent in 0.999002 seconds
Flows: 164 flows, 164.16 fps, 1000 unique flow packets, 0 unique non-flow packets
-K reads the file into RAM so disk I/O doesn't throttle the send loop. --loop 3 sent 3 × 24,308 = 72,924 packets. Looping replays the same 4-tuples each time, so a stateful sensor sees retransmissions of old sessions on the second pass; add --unique-ip if you need new flows per loop. --limit stops after a packet count, which is handy for a quick smoke test.
Step 6: Rewrite addresses with tcprewrite
$ tcprewrite --pnat=192.0.2.0/24:198.51.100.0/24 --enet-dmac=02:00:00:00:00:01 \
    --fixcsum -i web.pcap -o web-rw.pcap
$ tcpdump -nn -e -r web-rw.pcap -c 1
07:30:55.856038 aa:c1:ab:96:2b:5b > 02:00:00:00:00:01, ethertype IPv4 (0x0800), length 74: 198.51.100.10.39230 > 198.51.100.80.80: Flags [S], ...
--pnat maps one subnet onto another and keeps host positions. --enet-dmac sets the destination MAC, which matters when the target is a router or firewall that drops frames not addressed to it. --fixcsum recomputes checksums after the edit. Replayed into the sensor at 4,000 pps, the rewritten file still produced 2,000 of 2,000 alerts and 0.00% drops.
Lab: how fast can you replay into an IDS?
tr-replayer's eth1 connects straight to tr-sensor's eth1, with no IP addresses and no switch. Suricata 8.0.3 runs in AF_PACKET mode on the sensor with one custom rule:
alert http any any -> any any (msg:"PINGLABZ replay test URI"; flow:established,to_server; http.uri; content:"/pl-test/"; startswith; sid:1000001; rev:1;)Every request in the pcap matches, so the right answer is always 2,000 alerts. For each run I started Suricata fresh, replayed, waited, stopped it, and read its shutdown summary and fast.log.
| Replay | Rate | Sensor saw | Suricata drops | Alerts |
|---|---|---|---|---|
| Original timing | 3,946 pps | 24,308 | 0.00% | 2,000 |
--pps 10000 | 10,000 pps | 24,308 | 0.00% | 2,000 |
--pps 20000 | 20,001 pps | 24,308 | 0.00% | 2,000 |
--pps 40000 | 40,001 pps | 24,308 | 0.00% | 2,000 |
--topspeed, run 1 | 60,601 pps | 22,650 | 0.00% | 1,605 |
--topspeed, run 2 | 62,819 pps | 21,560 | 0.00% | 1,591 |
--topspeed, run 3 | 62,424 pps | 21,571 | 0.00% | 1,561 |
At --topspeed, the loss hides from both tools
Here's Suricata's own summary for topspeed run 1:
Notice: device: eth1: packets: 22650, drops: 0 (0.00%), invalid chksum: 0It reports every packet it received and no drops, and that's true. 1,658 packets never reached it. In run 3, the replay interface's own transmit counter went up by 21,571, exactly what Suricata saw, while tcpreplay still printed Successful packets: 24308. The packets were lost after tcpreplay handed them to the kernel and before they left the interface. Nothing logged a drop.
A capture on the sensor side during another topspeed replay shows what that does to the traffic: 23,947 of 24,308 packets arrived, Wireshark flagged 754 packets with tcp.analysis.lost_segment, and only 1,962 of 2,000 HTTP requests were visible at all. The same capture at --pps 40000: 24,308 packets, 0 flags, 2,000 requests.
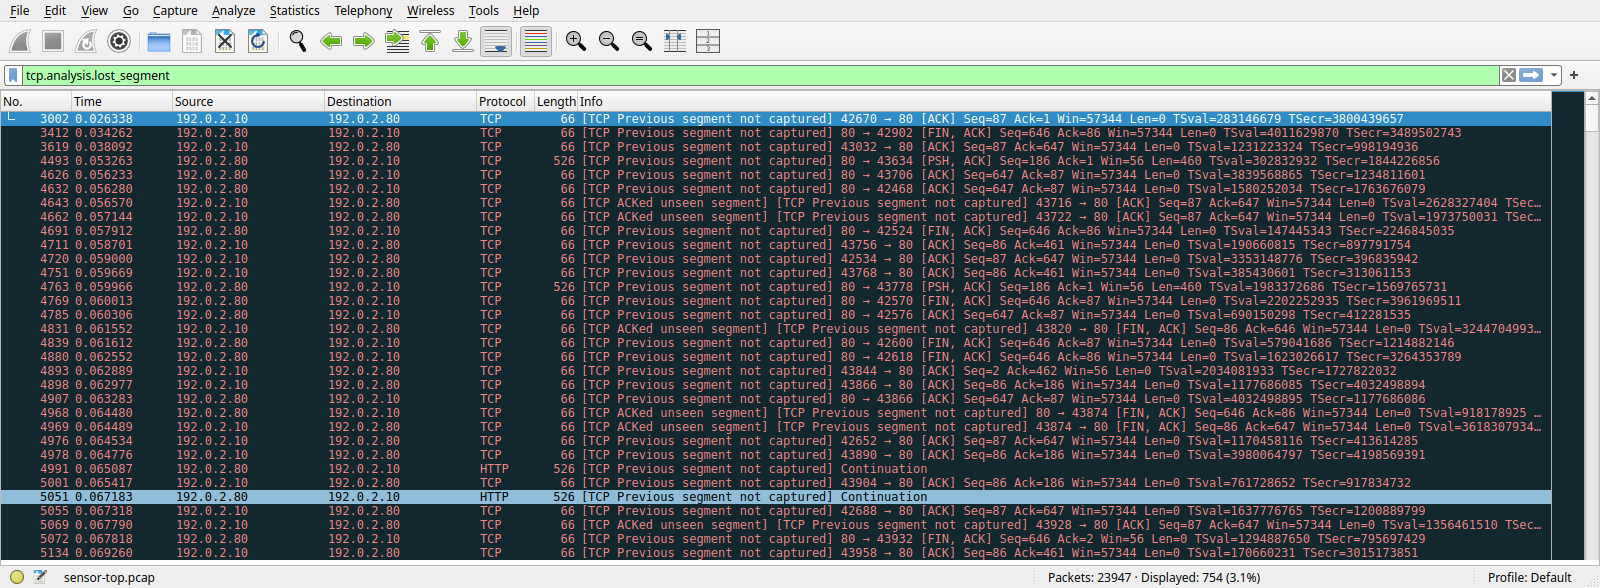
Missing segments cost more than their share of packets. Suricata reassembles TCP streams before the HTTP parser sees a request, and a hole in the handshake or the request can keep the HTTP parser from ever seeing that request. Losing 7% of packets cost 20% of the alerts.
An undersized sensor does show up in the drop counter
For contrast, I capped the sensor at 0.2 of a CPU core and replayed again:
| Replay | Suricata drops | Alerts |
|---|---|---|
--pps 4000 | 4,677 (19.24%) | 1,635 |
--pps 4000, rerun | 6,199 (25.50%) | 1,519 |
--pps 20000 | 17,609 (72.44%) | 556 |
CPU restored, --pps 4000 | 0 (0.00%) | 2,000 |
This time the packets reached the interface and Suricata couldn't keep up, so capture.kernel_drops counted them. That's the failure everyone checks for. The topspeed case is the one that slips through, because the counter you're watching sits after the loss.
Fix: pace the replay and check against the pcap
- Use a fixed rate, not
--topspeed. In this lab, everything up to--pps 40000produced 2,000 of 2,000 alerts. Step up until the result changes, then report the last clean rate. - Compare packets in with packets in the file. The pcap has 24,308 packets. If the sensor's packet count is lower, the loss happened before the sensor and its drop counter won't show it.
- Count the result you care about. A known number of rule hits, flow records or log lines is the test. Drop counters are a diagnostic.
- Watch both drop counters.
capture.kernel_dropsrising means the sensor is short on CPU or ring buffer, as the 0.2-CPU runs showed.
Step 7: Oversized frames from offload captures
A capture taken on a host with TSO or GSO on records the oversized segments the stack built before the NIC split them. I captured a 1 MB download that way: 187 packets, with frames up to 9,514 bytes. Replaying that out an interface with a 1500-byte MTU:
$ sudo tcpreplay -i eth1 big.pcap
Warning in txring.c:txring_put() line 104:
[!] 7466 bytes from 9514 packet truncated

Warning in send_packets.c:send_packets() line 548:
Unable to send packet: Only able to write 2048 bytes out of 9514 bytes total
...
Statistics for network device: eth1
	Successful packets:        75
	Failed packets:            0
	Truncated packets:         112
112 of 187 frames went out cut short, and a sensor would see garbage where the payload should be. The real fix is to capture with offloads off, which is how web.pcap was made:
sudo ethtool -K eth1 tso off gso off gro offIf you can't recapture, tcprewrite --mtu=1500 --mtu-trunc -i big.pcap -o big-1500.pcap makes the file sendable. The replay then reported 187 successful and 0 truncated packets. The payload past 1,500 bytes is still gone, so don't use a truncated file to test content rules.
tcpreplay vs Scapy vs iperf3
| tcpreplay | Scapy sendp() | iperf3 | |
|---|---|---|---|
| Traffic | Exactly what's in a pcap | Packets you build in Python | Synthetic TCP or UDP streams |
| Rate control | --pps, --mbps, -x, --topspeed | Slow; Python per packet | -b target bitrate |
| Stateful endpoints needed | No, it replays both sides | No | Yes, client and server |
| Header edits | tcprewrite, offline | Anything, in code | None |
| Best for | IDS, NetFlow and firewall regression tests with real traffic | One-off crafted test cases | Throughput and loss between two hosts |
See How to Use iperf3 for throughput tests and Scapy packet crafting for building packets by hand.
tcpreplay cheat sheet
| Option | What it does |
|---|---|
-i eth1 | Output interface (add -I for the second side with tcpprep) |
-x 10 / --multiplier | Speed multiplier of the original timing |
--pps 40000 | Fixed packets per second |
--mbps 20 | Fixed bit rate in Mbps |
-t / --topspeed | As fast as possible |
--loop N | Repeat the file N times; 0 loops forever |
-K / --preload-pcap | Load the file into RAM first |
--limit N | Stop after N packets |
--duration S | Stop after S seconds |
--unique-ip | Change IPs on each loop so flows are new |
tcprewrite --pnat=A/n:B/n | Map one subnet onto another |
tcprewrite --enet-dmac=MAC | Set the destination MAC |
tcprewrite --fixcsum | Recompute checksums after edits |
tcprewrite --mtu=1500 --mtu-trunc | Truncate frames that exceed the MTU |
Gotchas
Successful packetsisn't delivery. At--topspeed, tcpreplay said 24,308 while the interface sent 21,571.- 0.00% drops isn't proof either. Suricata reported 0.00% while missing 395 alerts, because the packets never reached it.
Unable to send packet: Only able to write 2048 bytes out of 9514 bytes totalwith a nonzeroTruncated packetscount means oversized frames from an offload capture. Recapture with offloads off, or truncate withtcprewrite --mtu-trunc.Invalid interface name/alias: eth9afterFatal Error in tcpreplay.c:main(): the interface doesn't exist. Checkip link. tcpreplay exits with status 255.- Looped replays reuse 4-tuples. A stateful sensor treats pass two as retransmissions. Use
--unique-ip. - A router or firewall ignores your replay if the destination MAC isn't its own. Set it with
tcprewrite --enet-dmac.
FAQ
What is tcpreplay used for?
Replaying captured traffic to test devices that inspect it: IDS and IPS sensors, NetFlow collectors, firewalls and load balancers. Because the traffic is real, you know exactly what the device should report.
How do I replay a pcap at a specific rate?
Use --pps for packets per second or --mbps for bandwidth, for example tcpreplay -i eth1 --pps 40000 file.pcap. -x scales the original timing instead.
Why does my IDS miss alerts during replay?
Either the sensor can't keep up, which shows in its drop counter, or packets were lost before they reached it, which doesn't. In the lab, --topspeed cost 20% of the alerts at 0.00% reported drops. Pace the replay and compare the sensor's packet count with the pcap's.
How do I change IP addresses in a pcap?
tcprewrite --pnat=192.0.2.0/24:198.51.100.0/24 --fixcsum -i in.pcap -o out.pcap. Use --srcipmap or --dstipmap to change one side only.
Does tcpreplay need root?
It needs raw socket access, so run it with sudo or give the binary CAP_NET_RAW. tcprewrite and tcpcapinfo only edit and read files and don't need root.
Does tcpreplay replay TCP sessions statefully?
No. It sends both sides of each conversation exactly as captured and never answers anything. That's why it works into a passive sensor with no IP address, and why it can't test a real server.
Key takeaways
tcpreplay -i eth1 file.pcapreplays at the original timing;--ppsand--mbpsgive you a rate you can report.- At up to 40,000 pps the lab sensor raised 2,000 of 2,000 alerts. At
--topspeedit raised about 1,600, with 0.00% drops reported. - Validate a replay against the pcap's packet count and a known number of results, not against
Successful packetsor a drop counter. - Capture with offloads off. Oversized frames from TSO and GSO get truncated on replay.
More in this series: How to Use Wireshark to inspect the sensor-side capture of a replay for lost segments.
Related: Suricata on a SPAN Port: Wrong Direction, No Alerts · Suricata eve.json · pcap to Zeek Logs · tcpdump for Network Engineers · How to Use Wireshark · How to Use iperf3 · Series hub: Linux Networking Commands: The Complete Guide