
To use Wireshark, pick the interface the traffic actually crosses, set a capture filter such as tcp port 8080 so you only record what you need, start the capture, then narrow the view with display filters such as ip.addr == 198.51.100.10 or tcp.analysis.flags. Capture filters use BPF syntax and decide what gets saved. Display filters use Wireshark's field syntax and only hide packets. When something is wrong, open Analyze > Expert Information first: it counts the gaps, duplicate ACKs and retransmissions for you.
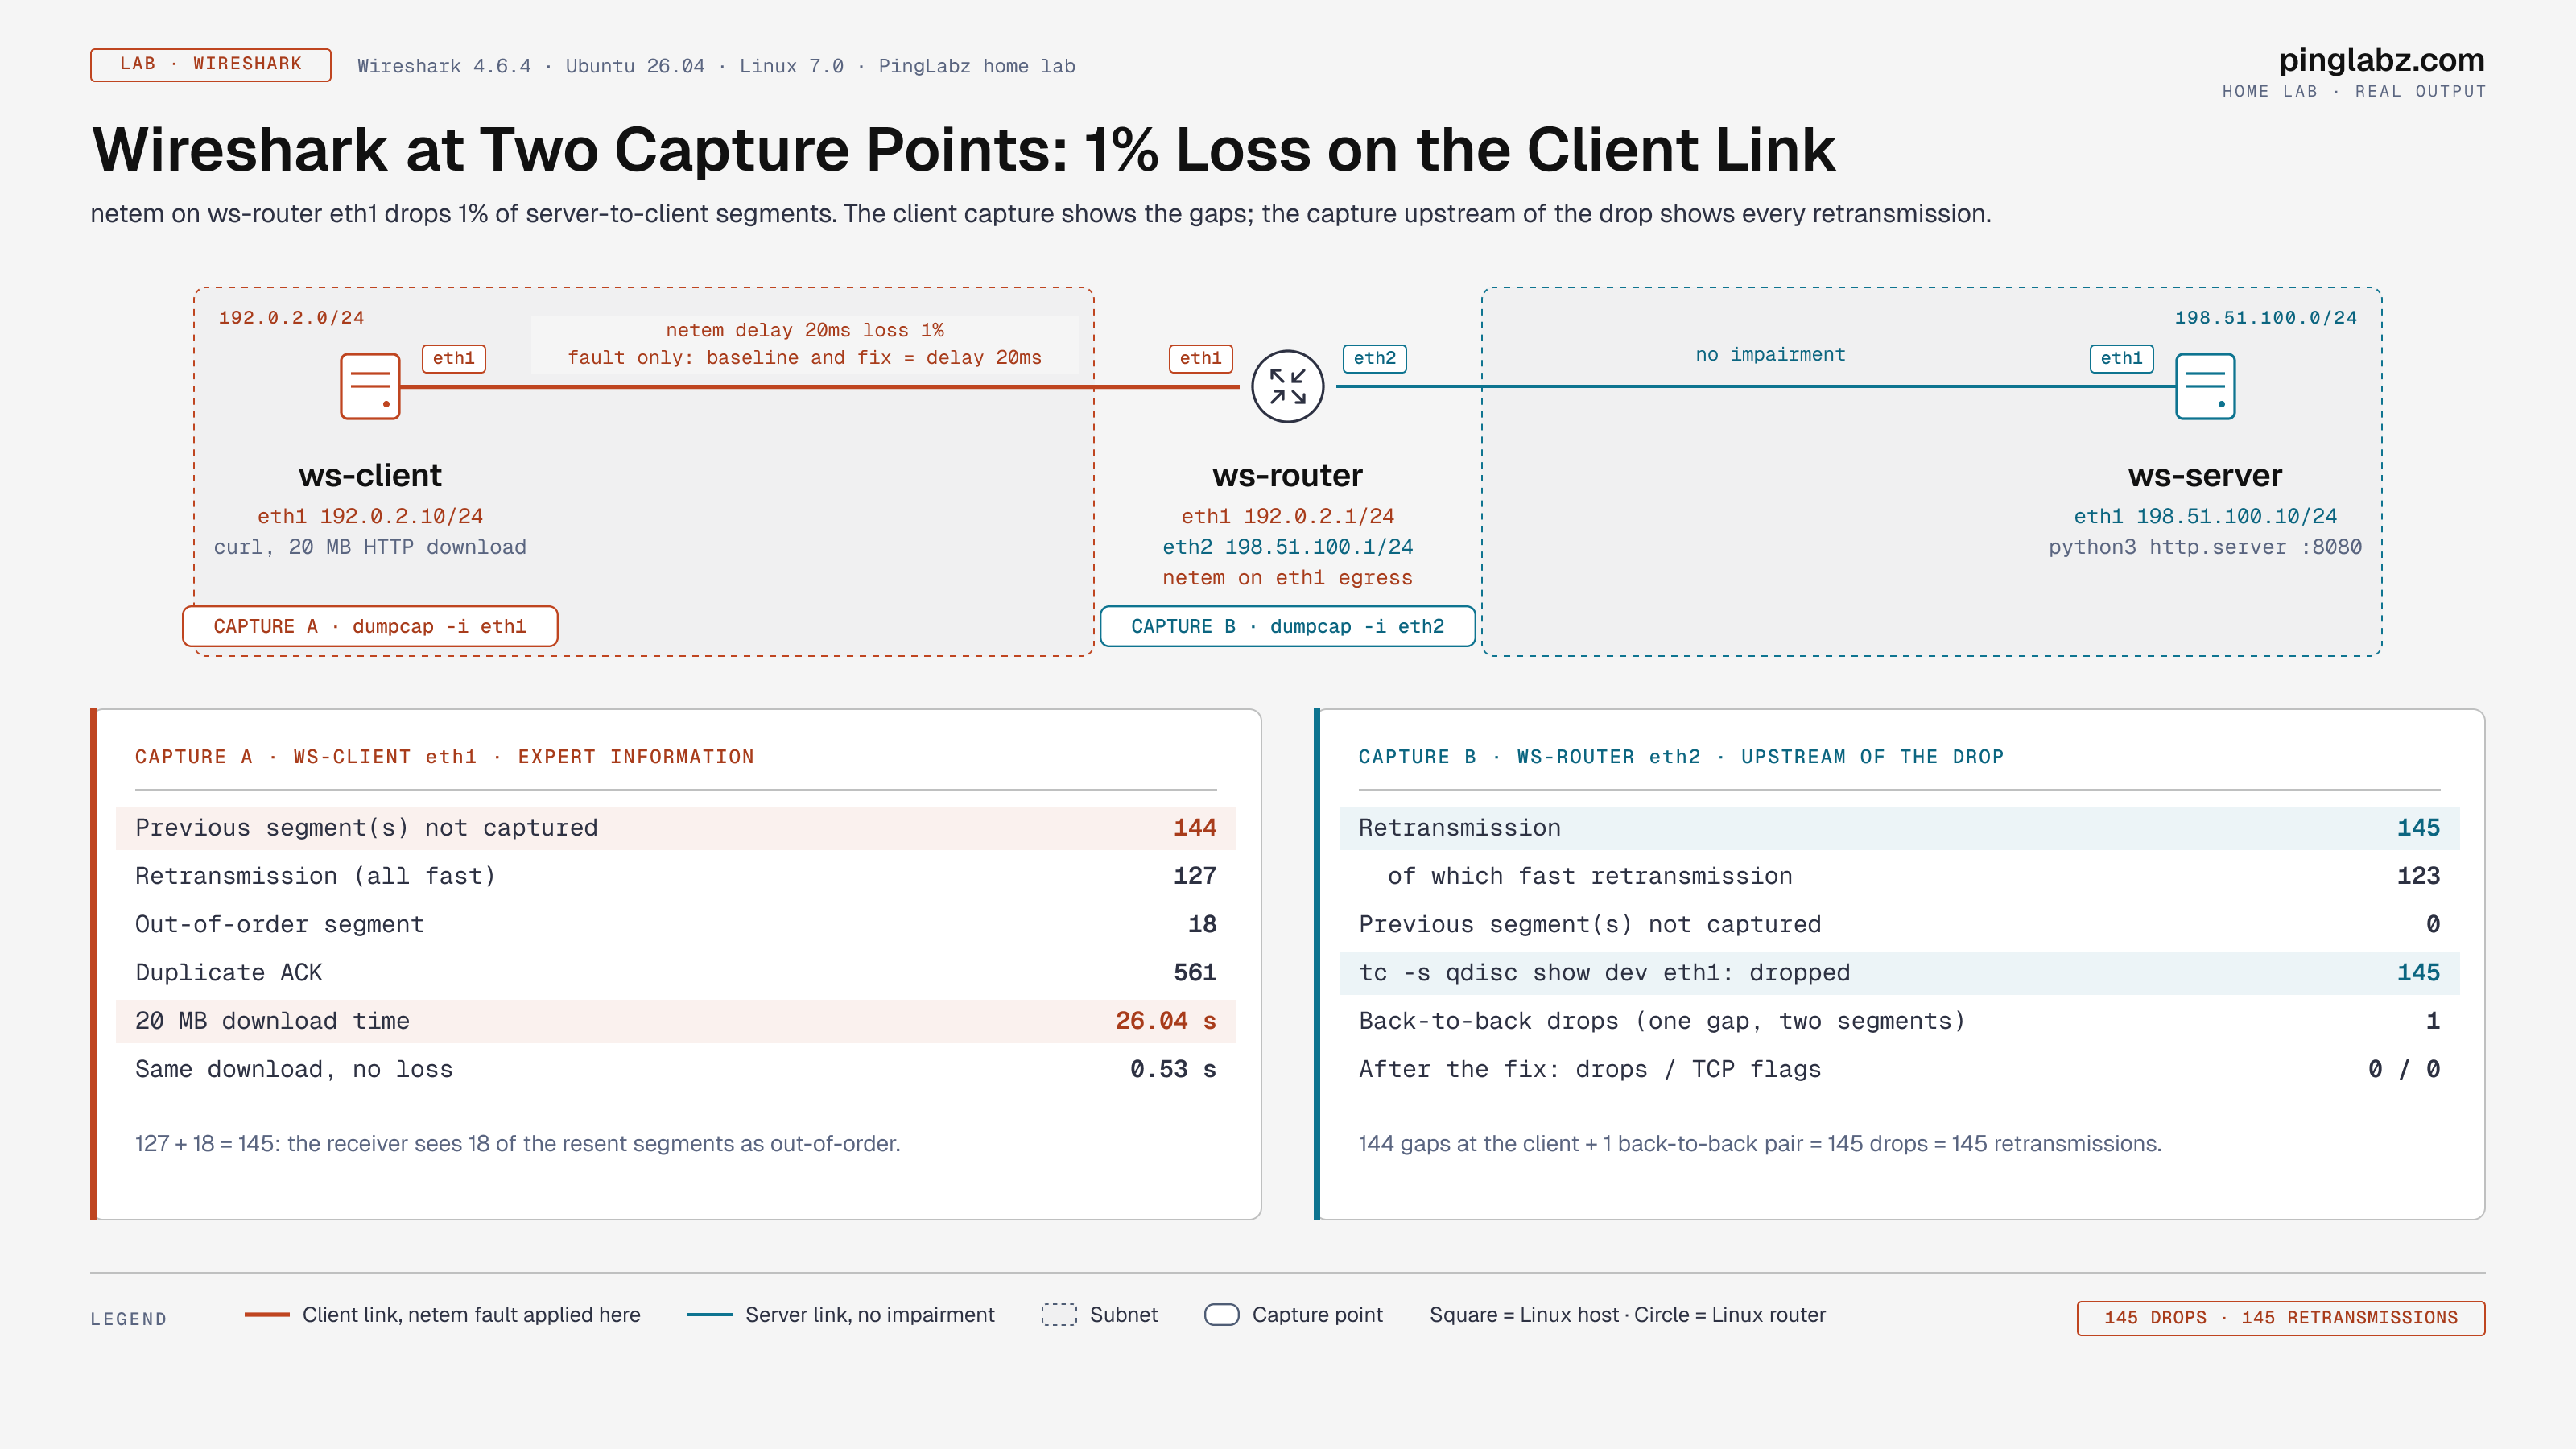
To show what Expert Information is worth, I broke a path on purpose. A 1% loss impairment dropped 145 segments of a 20 MB download. Wireshark at the client flagged 144 [TCP Previous segment not captured] gaps, a second capture upstream of the drop counted exactly 145 retransmissions, and the download went from 0.53 seconds to 26.04 seconds. This guide shows every step, the filters behind each screenshot, and how to read what Wireshark tells you.
Part of the Linux Networking Commands: The Complete Guide. Scope: Wireshark 4.6.4 and dumpcap on Ubuntu 26.04 (kernel 7.0), three Linux hosts built in my home lab on documentation addresses, one fault: tc netem 1% loss on one router interface.
How Wireshark works
Wireshark is two programs. dumpcap does the capturing: it opens the interface, applies the capture filter in the kernel, and writes a pcapng file. The Wireshark GUI (and tshark in the terminal) reads that file and runs every packet through thousands of protocol dissectors. That split explains two things you will hit early: capture permissions belong to dumpcap, not the GUI, and a display filter can never bring back a packet the capture filter threw away.
Wireshark also keeps state per TCP conversation. It remembers the next sequence number it expects in each direction, so it can label a segment as a retransmission, a gap, or out of order. Those labels are inferences from one capture point. They are very good inferences, but where you capture changes what Wireshark can see, which the lab below proves.
Step 1: Install Wireshark
Kali Linux ships Wireshark in its default desktop image. On Debian and Ubuntu:
sudo apt install wireshark
sudo usermod -aG wireshark $USER   # then log out and back in
wireshark --version | head -1
Answering yes at the install prompt gives dumpcap the CAP_NET_RAW and CAP_NET_ADMIN capabilities for members of the wireshark group, so you never run the GUI as root. If you skipped the prompt, run sudo dpkg-reconfigure wireshark-common. On macOS use the official installer (it adds ChmodBPF for capture access) or brew install --cask wireshark. On Windows the installer bundles Npcap, which is the capture driver.
Step 2: Pick the interface and set a capture filter
Open Capture > Options (Ctrl+K). Every interface dumpcap can open is listed, including any and extcap sources such as sshdump and ciscodump. Select the interface the traffic crosses and type the capture filter at the bottom. The bar turns green when the BPF expression compiles.

tcp port 8080. Green means the BPF compiled.The terminal equivalent is useful for remote boxes and long captures. This is what I ran on both capture points, with the same filter:
dumpcap -D                                   # list interfaces: 1. eth0 2. eth1 3. any 4. lo ...
dumpcap -q -i eth1 -f "tcp port 8080" -w /tmp/fault-client.pcapng
A capture filter matters on a busy link. Without one, a 10-minute capture on a server uplink can be gigabytes, and dumpcap can start dropping packets under load. With one, you record only the conversation you are troubleshooting.
Step 3: Start the capture and generate traffic
Click Start, then reproduce the problem. Here two small HTTP requests from the client produced 20 packets. The status bar shows eth1: <live capture in progress>, and the red square in the toolbar stops the capture.
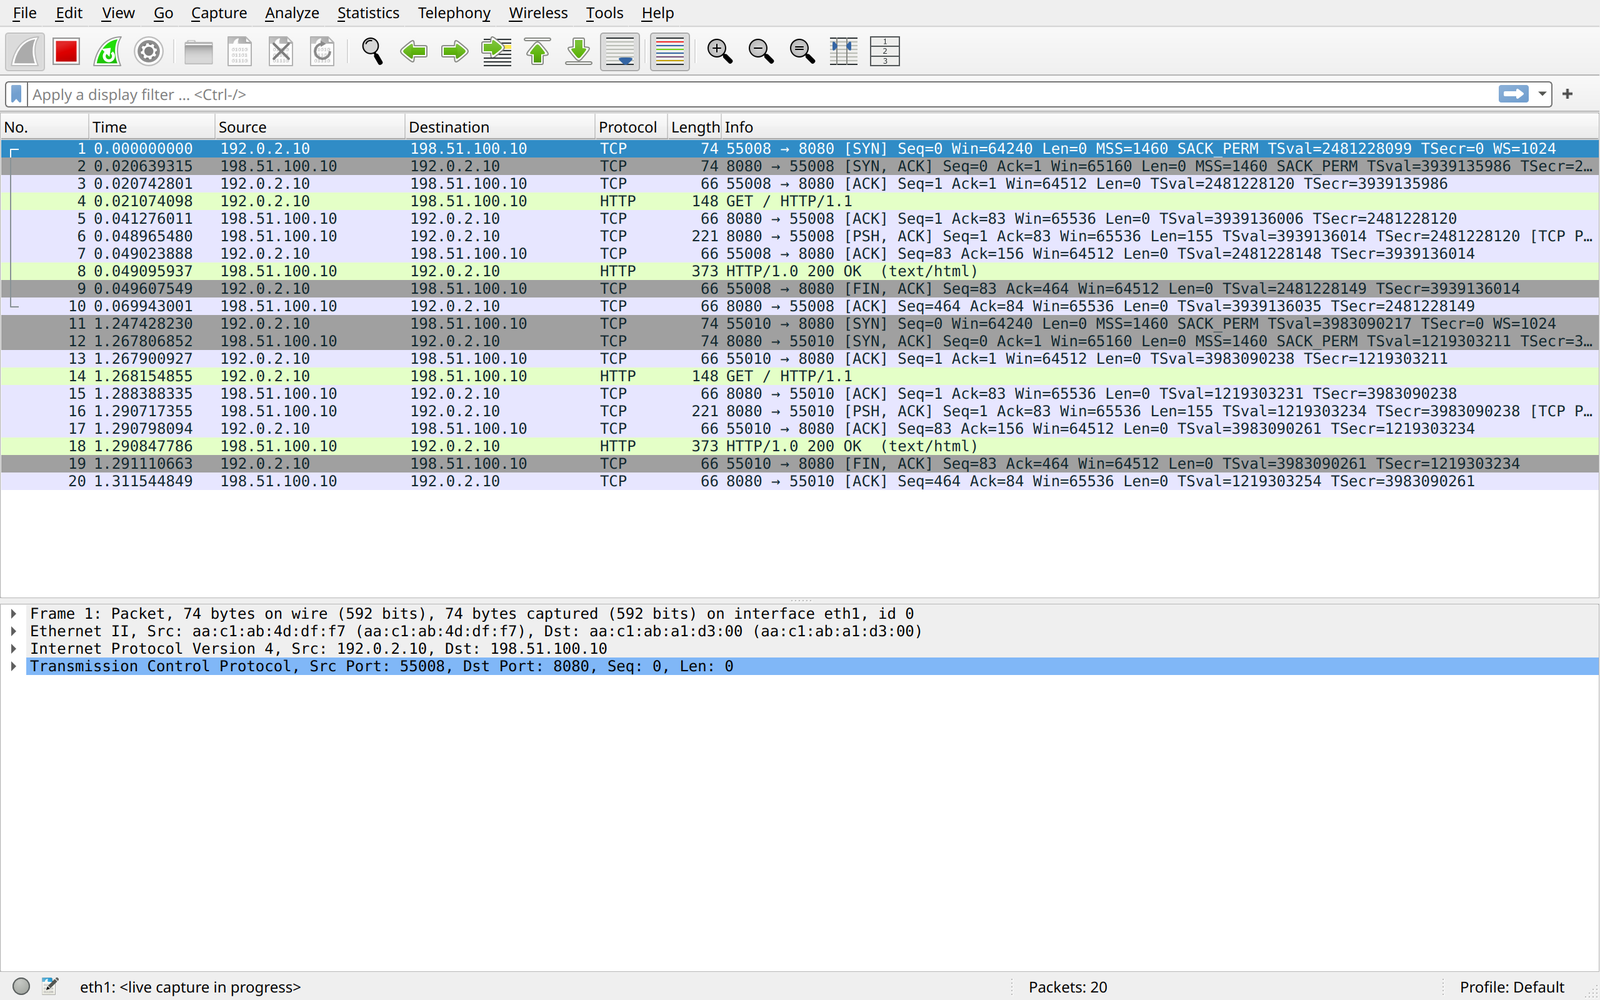
Start the capture before the connection opens. Wireshark learns the MSS, window scale and SACK permission from the SYN. Join a flow mid-stream and the analysis gets worse, as the gotchas section shows with real numbers.
Step 4: Apply display filters
Type a display filter in the bar above the packet list and press Enter. Green means valid. Red means Wireshark rejected it, and the status bar says why. The most common mistake is typing capture-filter syntax into the display filter bar:
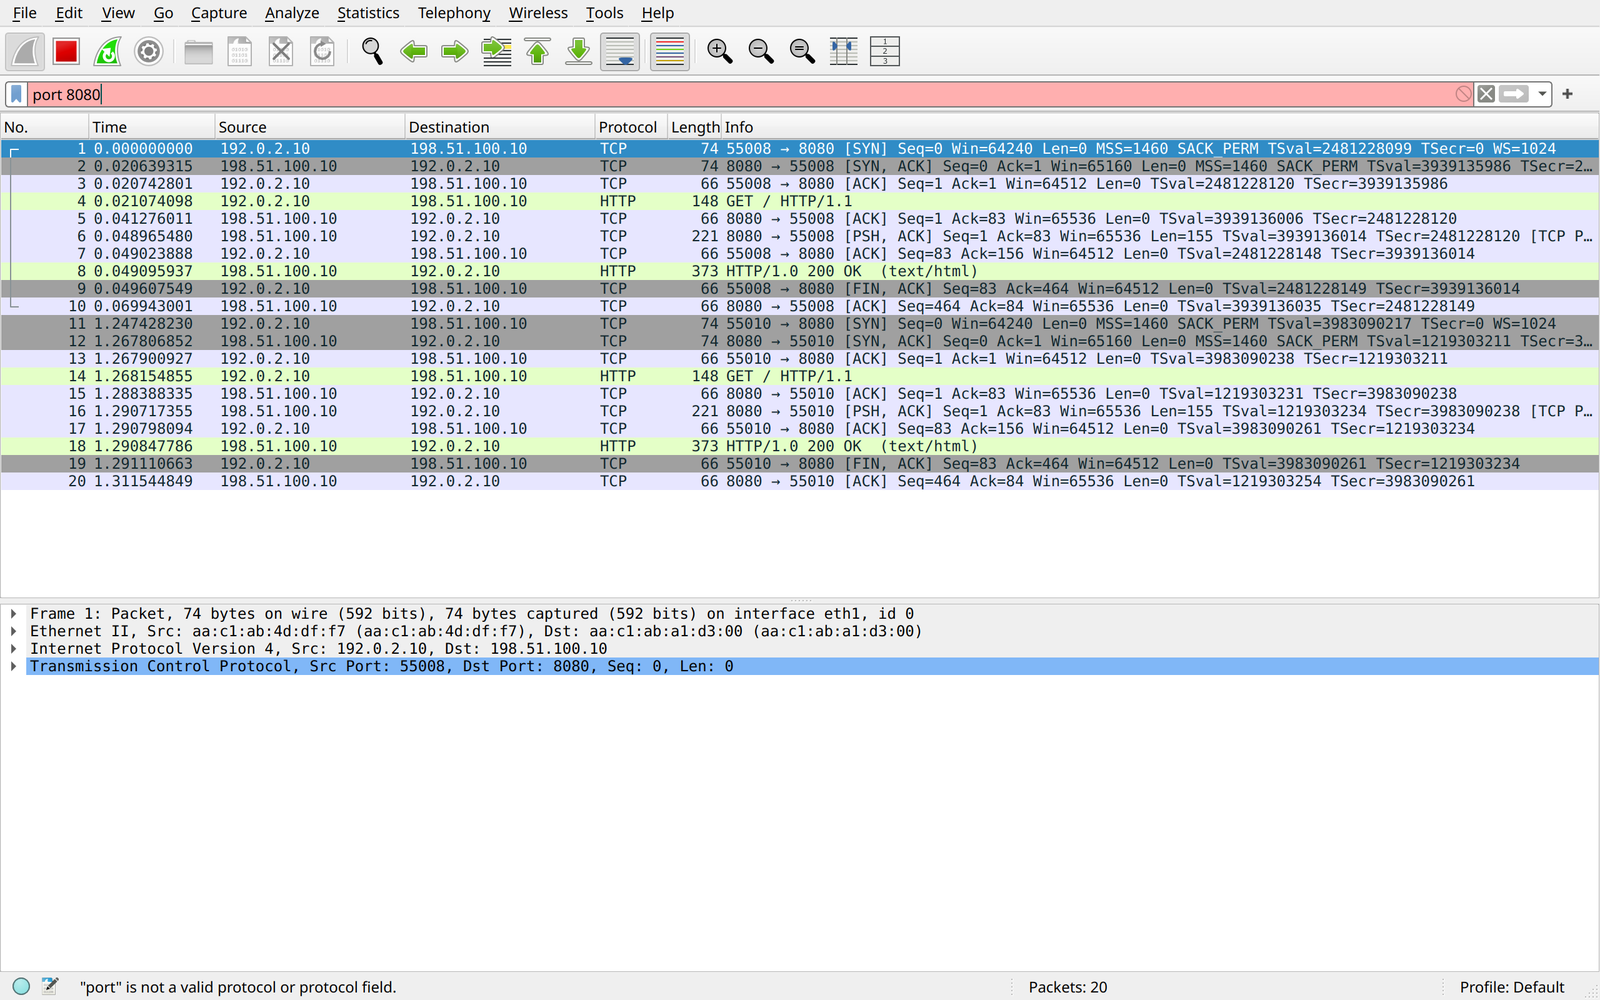
port 8080 is a capture filter. In the display bar it fails with "port" is not a valid protocol or protocol field.The display filter for the same thing is tcp.port == 8080. Here is the translation table I keep in my head:
| You want | Capture filter (BPF) | Display filter |
|---|---|---|
| One host, either direction | host 198.51.100.10 | ip.addr == 198.51.100.10 |
| Source only | src host 192.0.2.10 | ip.src == 192.0.2.10 |
| A subnet | net 192.0.2.0/24 | ip.addr == 192.0.2.0/24 |
| A TCP port | tcp port 8080 | tcp.port == 8080 |
| DNS | udp port 53 | dns |
| A MAC address | ether host aa:c1:ab:4d:df:f7 | eth.addr == aa:c1:ab:4d:df:f7 |
| TCP SYNs only | tcp[tcpflags] & tcp-syn != 0 | tcp.flags.syn == 1 && tcp.flags.ack == 0 |
| Exclude your SSH session | not tcp port 22 | !(tcp.port == 22) |
| TCP problems | none (needs TCP state) | tcp.analysis.flags |
Display filters can do things BPF never can, because they work on dissected fields. These are the ones I use most when troubleshooting:
| Display filter | Shows |
|---|---|
tcp.analysis.flags | Every TCP segment Wireshark flagged: gaps, retransmissions, duplicate ACKs, zero windows |
tcp.analysis.lost_segment | [TCP Previous segment not captured]: a sequence gap before this segment |
tcp.analysis.retransmission | Segments that resend sequence space already seen (includes fast retransmissions) |
tcp.analysis.duplicate_ack | The receiver repeating the same ACK because data is missing |
tcp.analysis.zero_window | A receiver telling the sender to stop: an application or host problem, not the network |
tcp.flags.reset == 1 | Connection resets, from a closed port, a firewall or an application |
tcp.stream eq 0 | One TCP conversation, the same filter Follow TCP Stream applies |
dns.flags.rcode != 0 | DNS errors such as NXDOMAIN and SERVFAIL |
icmp.type == 3 | ICMP destination unreachable, including fragmentation needed |
frame.time_delta_displayed > 1 | Gaps of more than a second between displayed packets |
Combine with &&, || and !, or the words and, or and not. The fastest way to build any filter is to right-click a field in the details pane and choose Apply as Filter > Selected.
Step 5: Read the three panes
The packet list is one row per frame: number, time since capture start, source, destination, protocol, length and Info. The Info column is where Wireshark writes its analysis in brackets. The default coloring rules paint TCP problems black with red text, so a gap followed by a column of duplicate ACKs stands out even before you filter:
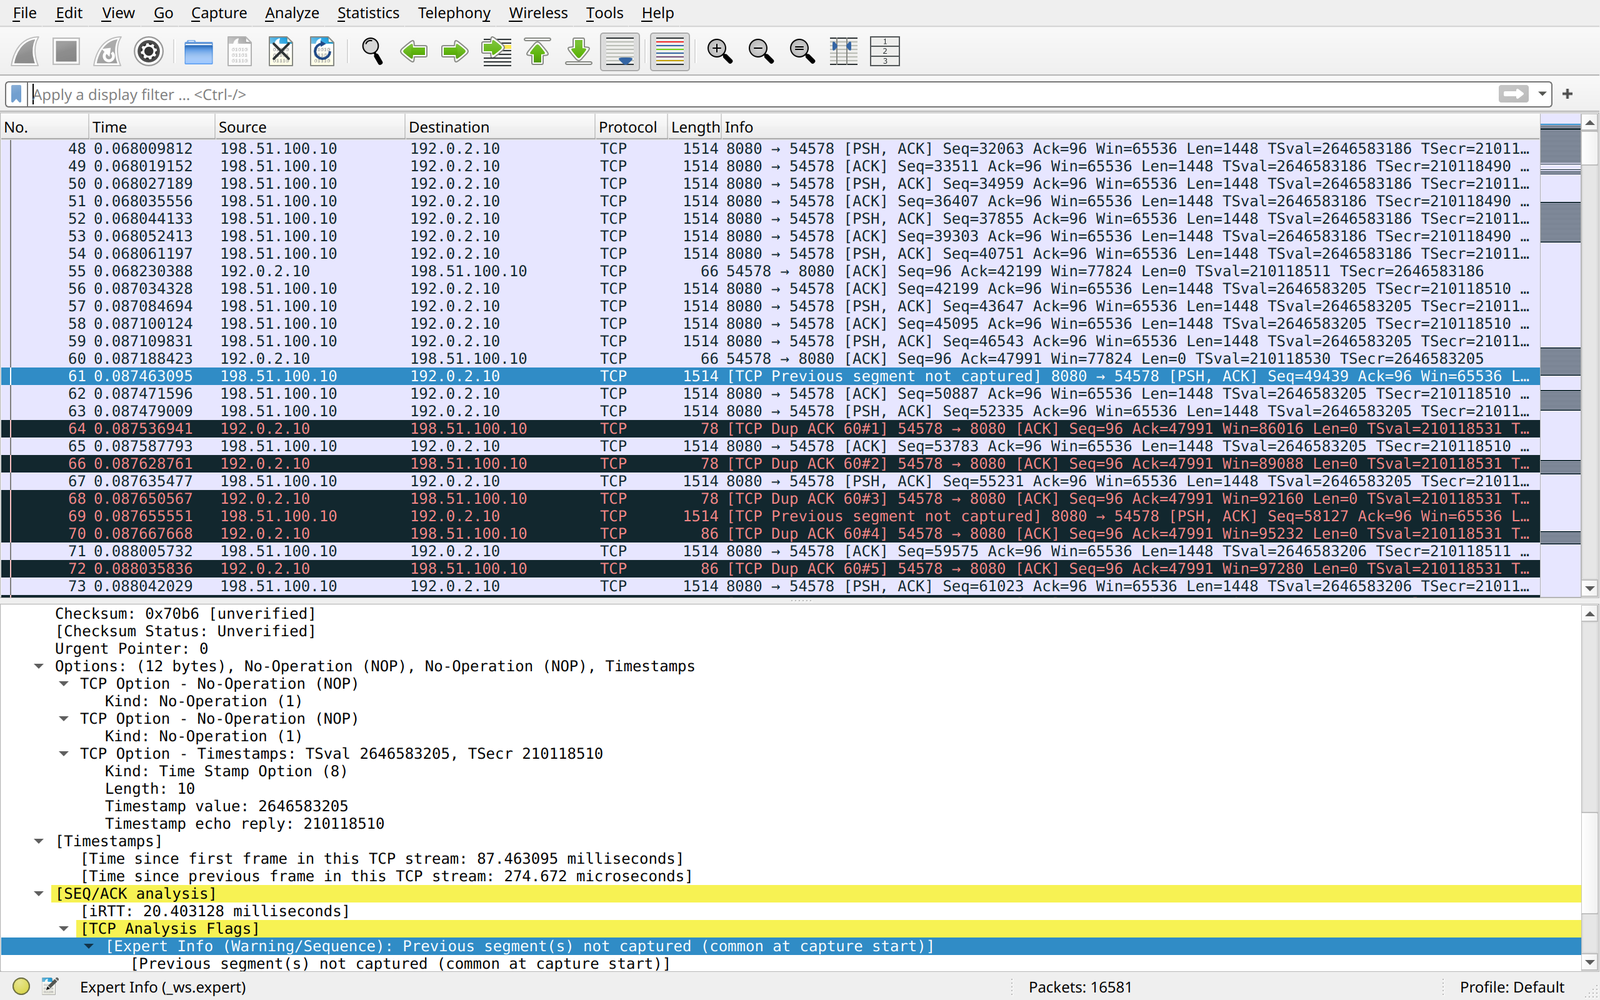
The packet details pane is the dissection tree of the selected frame, from Frame and Ethernet down to TCP and the application. Wireshark's own conclusions sit in square brackets, such as [SEQ/ACK analysis] and [iRTT: 20.403128 milliseconds]; they are not on the wire. The packet bytes pane shows the raw hex and highlights the bytes of whatever field you click. I hide it (View > Packet Bytes) when the screen is busy.
Lab: find 1% packet loss with Expert Information
The question for the lab: if you capture at the client, can Wireshark tell you how much the network dropped, and how do you prove it? The topology is three Linux hosts. The router adds 20 ms of delay toward the client at all times, so the path behaves like a WAN. The fault adds 1% random loss on the same interface. Nothing else changes between runs.
# ws-server
ip addr add 198.51.100.10/24 dev eth1
ip route add 192.0.2.0/24 via 198.51.100.1
head -c 20000000 /dev/urandom > /srv/blob-20MB.bin
cd /srv && taskset -c 3 python3 -m http.server 8080

# ws-router
ip addr add 192.0.2.1/24 dev eth1
ip addr add 198.51.100.1/24 dev eth2
sysctl -w net.ipv4.ip_forward=1
tc qdisc add dev eth1 root netem delay 20ms limit 100000      # baseline "WAN"

# ws-client
ip addr add 192.0.2.10/24 dev eth1
ip route add 198.51.100.0/24 via 192.0.2.1

# all three hosts, so captures show wire-size segments
ethtool -K eth1 tso off gso off gro off      # and eth2 on ws-router
Each run starts both captures, downloads the file, then stops the captures and reads the qdisc counter:
# ws-client and ws-router, before the download
dumpcap -q -i eth1 -f "tcp port 8080" -w /tmp/fault-client.pcapng        # ws-client
dumpcap -q -i eth2 -f "tcp port 8080" -w /tmp/fault-router-eth2.pcapng   # ws-router

# ws-client
taskset -c 3 curl -s -o /dev/null -w "time_total=%{time_total} speed_Bps=%{speed_download}\n" \
  http://198.51.100.10:8080/blob-20MB.bin

# ws-router, after
tc -s qdisc show dev eth1
Two lab notes. The netem default queue limit is 1,000 packets, and on my first baseline that limit alone dropped 305 packets, so set limit 100000. On virtual links I also pinned curl and the web server to one CPU with taskset; without it, the virtual path reordered packets and Wireshark flagged out-of-order segments with zero drops. The reordering and capture-artifact post covers that trap in detail.
Baseline: zero flags
time_total=0.528946 speed_Bps=37811043
qdisc netem 800e: root refcnt 17 limit 100000 delay 20ms
 Sent 20912574 bytes 13824 pkt (dropped 0, overlimits 0 requeues 0)
20 MB in 0.53 seconds, about 302 Mbit/s, and zero drops. Both captures returned zero for every tcp.analysis filter. That zero matters: it proves the lab itself does not create flags.
The fault: 1% loss
tc qdisc del dev eth1 root
tc qdisc add dev eth1 root netem delay 20ms loss 1% limit 100000
time_total=26.036240 speed_Bps=768160
qdisc netem 800f: root refcnt 17 limit 100000 delay 20ms loss 1%
Sent 20912178 bytes 13818 pkt (dropped 145, overlimits 0 requeues 0)The same download took 26.04 seconds, about 6.1 Mbit/s. One percent loss cost 98% of the throughput, because every loss event makes TCP cut its congestion window. Now open the client capture and apply tcp.analysis.lost_segment or tcp.analysis.retransmission:

Read it as a story. Frame 61 arrived with Seq=49439 while the last in-order byte was 47,990. The missing 1,448 bytes are exactly one MSS: one dropped segment. The client sent duplicate ACKs for 47,991 (Dup ACK 60#1 to 60#31) until frame 134, 20 ms later, delivered the fast retransmission of Seq=47991. Select frame 61 and expand TCP to see Wireshark's reasoning:
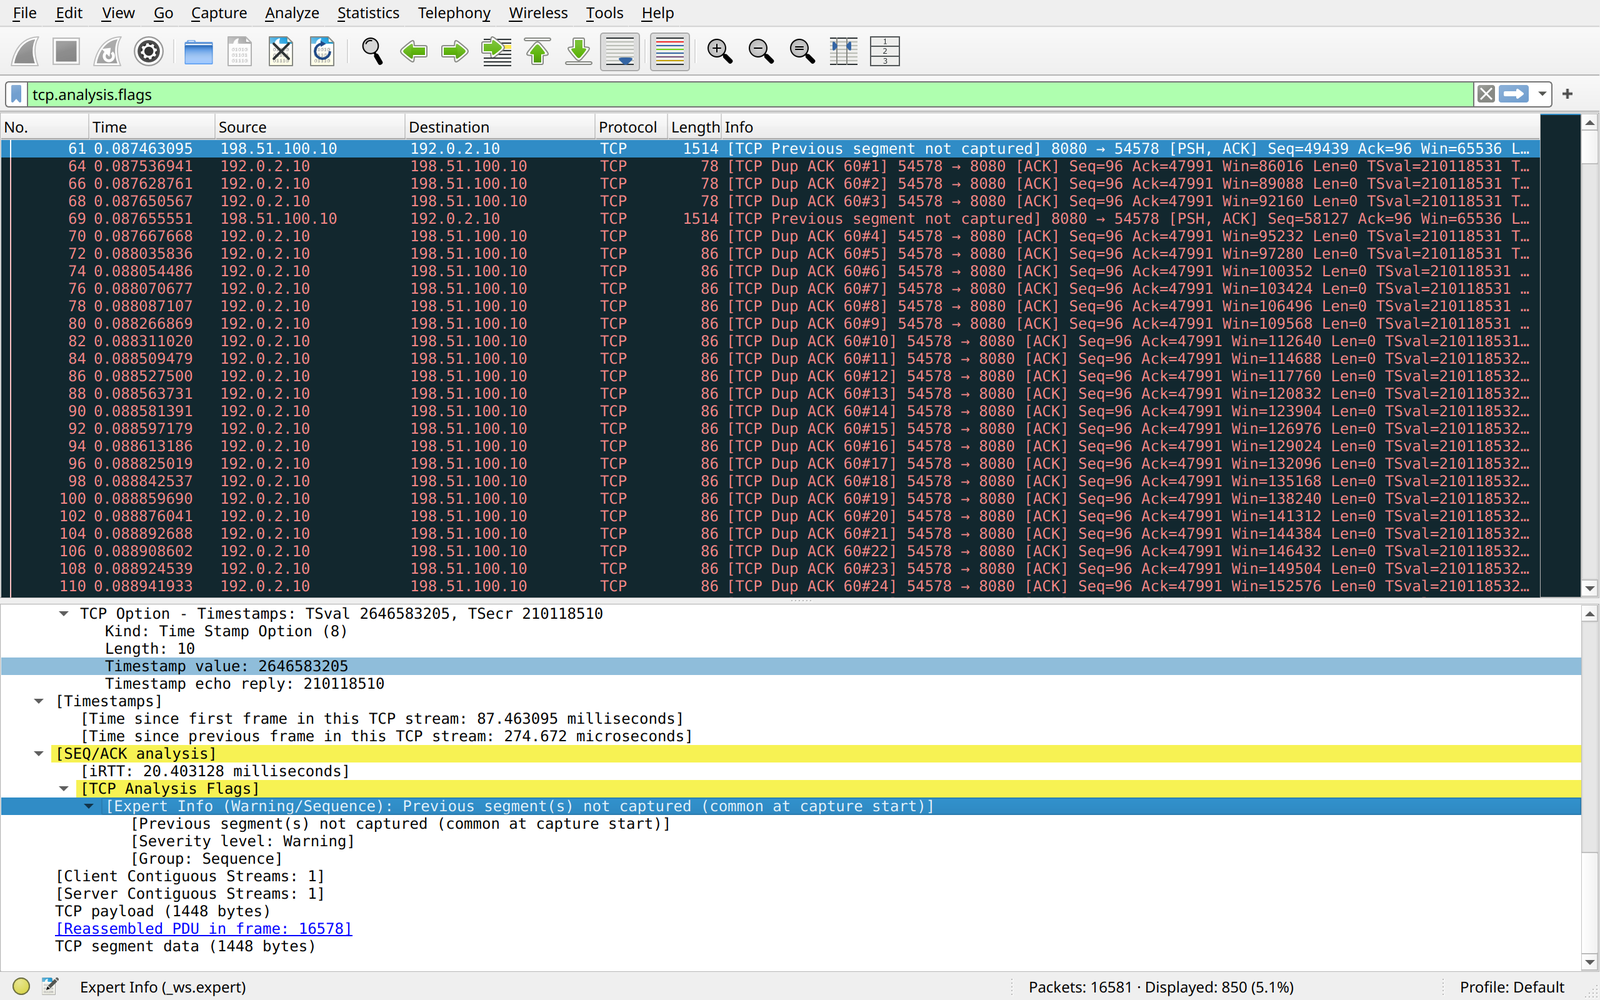
[SEQ/ACK analysis] > [TCP Analysis Flags]. iRTT 20.4 ms is the netem delay, measured from the handshake.Now let Wireshark do the counting. Analyze > Expert Information groups every flag by type:
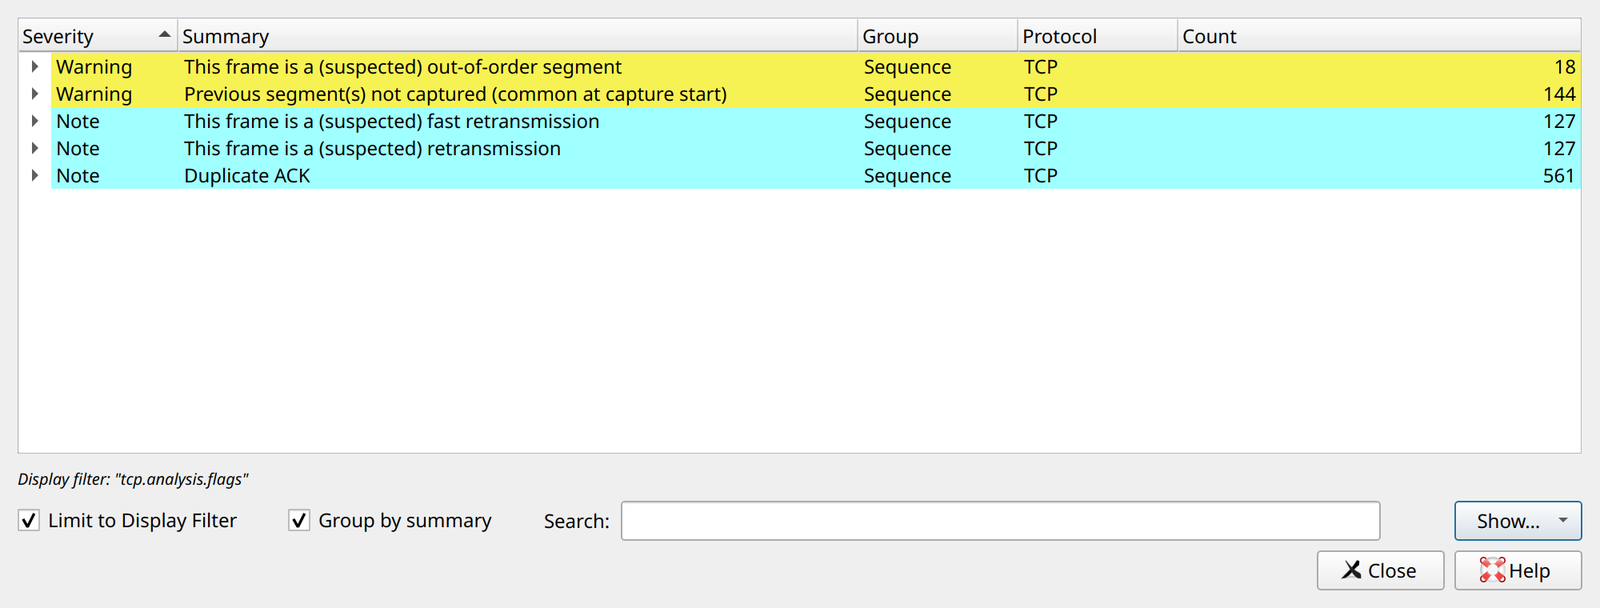
tcp.analysis.flags: 144 gaps, 127 retransmissions, 18 out-of-order, 561 duplicate ACKs.Reconcile the two capture points
The tempting read is "127 retransmissions, so the network dropped 127 packets". It did not. The capture upstream of the drop, on the router's server-facing interface, saw every resend before netem could touch it:
| Evidence | Client capture (A) | Router eth2 capture (B) |
|---|---|---|
[TCP Previous segment not captured] | 144 | 0 |
| Retransmission | 127 (all fast) | 145 (123 fast) |
| Out-of-order | 18 | 0 |
| Duplicate ACK | 561 | 561 |
tc -s qdisc dropped | 145 | |
The numbers close. Capture B counted 145 retransmissions for 145 drops. At the client, Wireshark labeled 127 of those resends as retransmissions and the other 18 as out-of-order; I matched all 145 sequence numbers against capture B. And 144 gaps for 145 drops is not a miss: one gap covered two back-to-back dropped segments. So at the receiver, count gaps, not retransmissions, and capture on the sender side when you need the exact loss figure.
The I/O Graph (Statistics > I/O Graphs) shows the shape over time. The default "TCP Errors" series is just tcp.analysis.flags per interval, plotted under all packets:
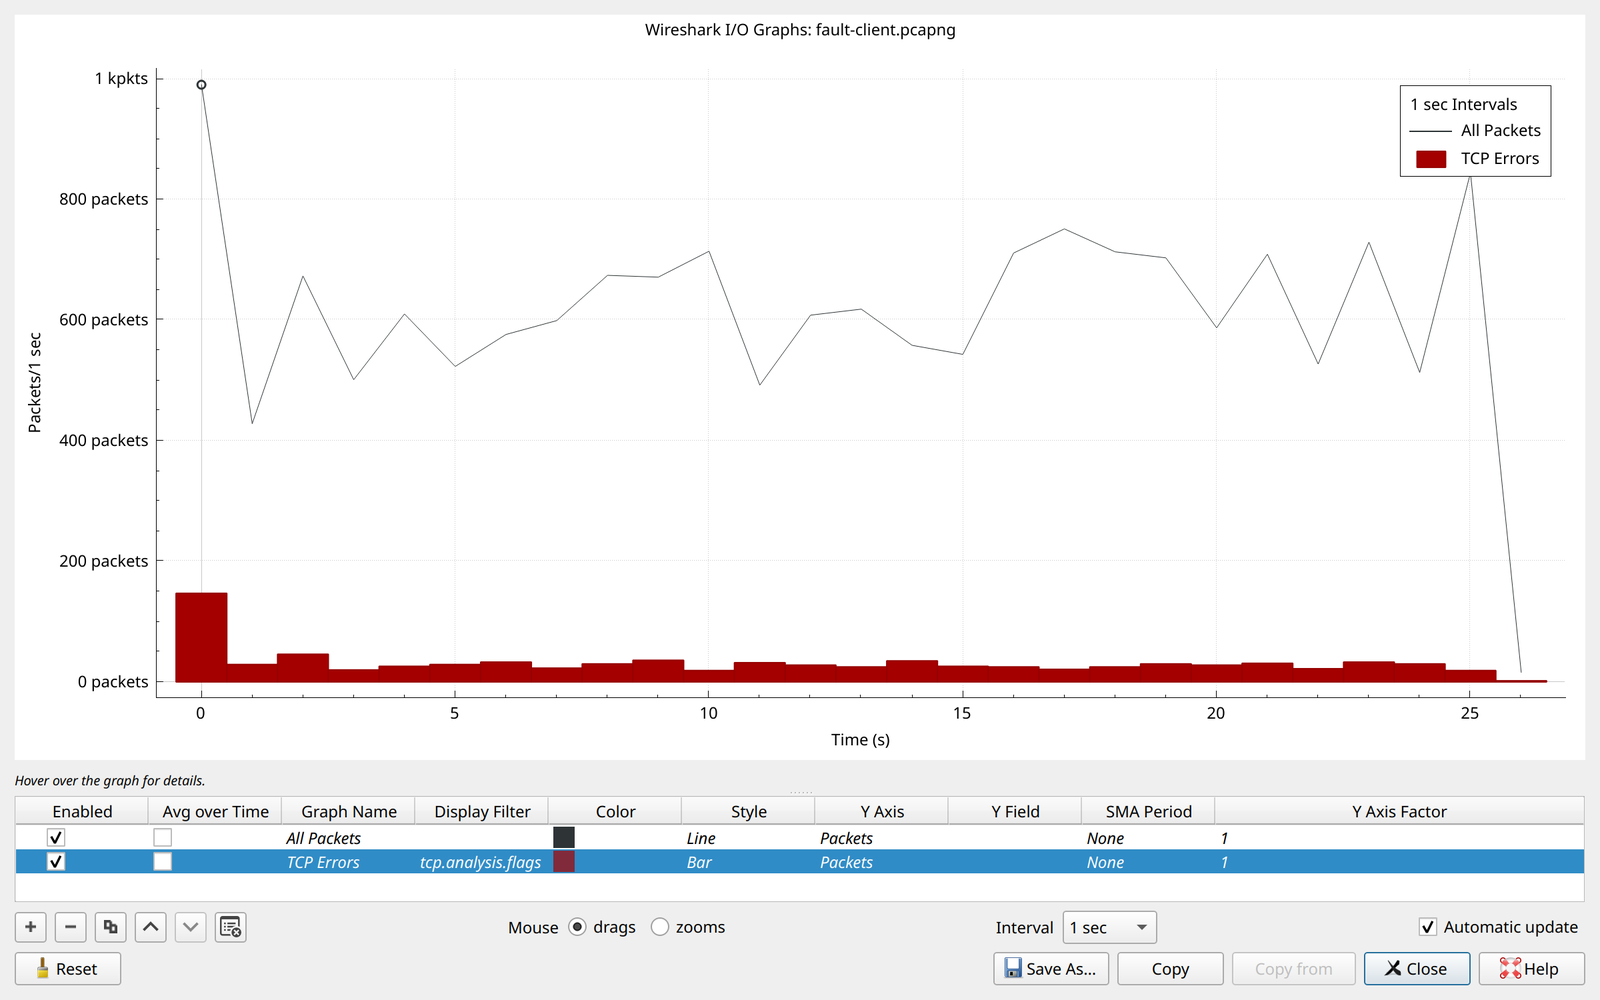
Statistics > Conversations, TCP tab, gives the conversation-level result: 16,581 frames, 26.06 seconds, 6,420 kbit/s from server to client.

Fix and verify
Remove the loss, keep the delay, and run the same download with both captures:
tc qdisc del dev eth1 root
tc qdisc add dev eth1 root netem delay 20ms limit 100000
time_total=0.584885 speed_Bps=34194756
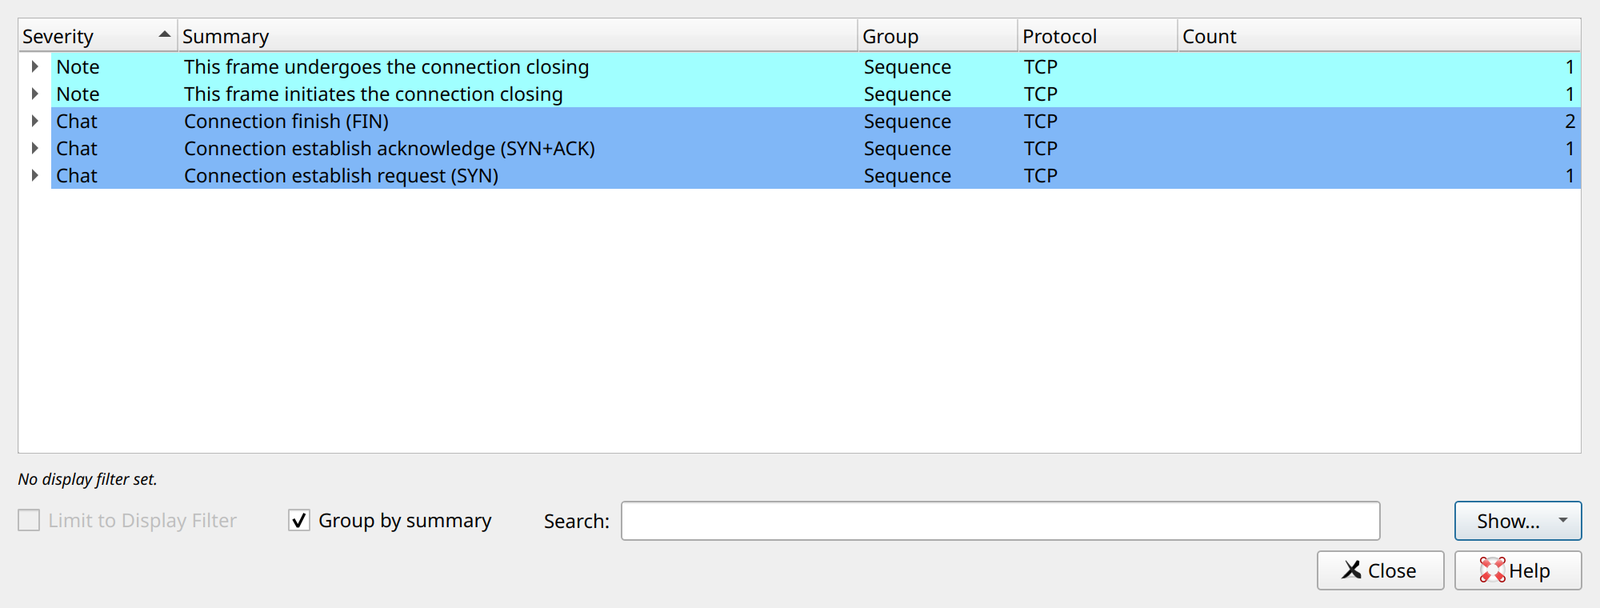
Sent 20912508 bytes 13823 pkt (dropped 0, overlimits 0 requeues 0)0.58 seconds again, about 274 Mbit/s, zero drops. Expert Information is back to the normal life of one connection: SYN, SYN-ACK, two FINs and the close.
In production the fix is wherever the loss lives: a dirty optic, a duplex mismatch, a policer, or a congested queue. Wireshark tells you the path is losing segments and in which direction. Interface error counters and show policy-map interface on each hop tell you where.
Follow TCP Stream
Right-click any packet and choose Follow > TCP Stream (Ctrl+Alt+Shift+T). Wireshark reassembles the conversation, client data in red and server data in blue, and applies tcp.stream eq N to the main window.
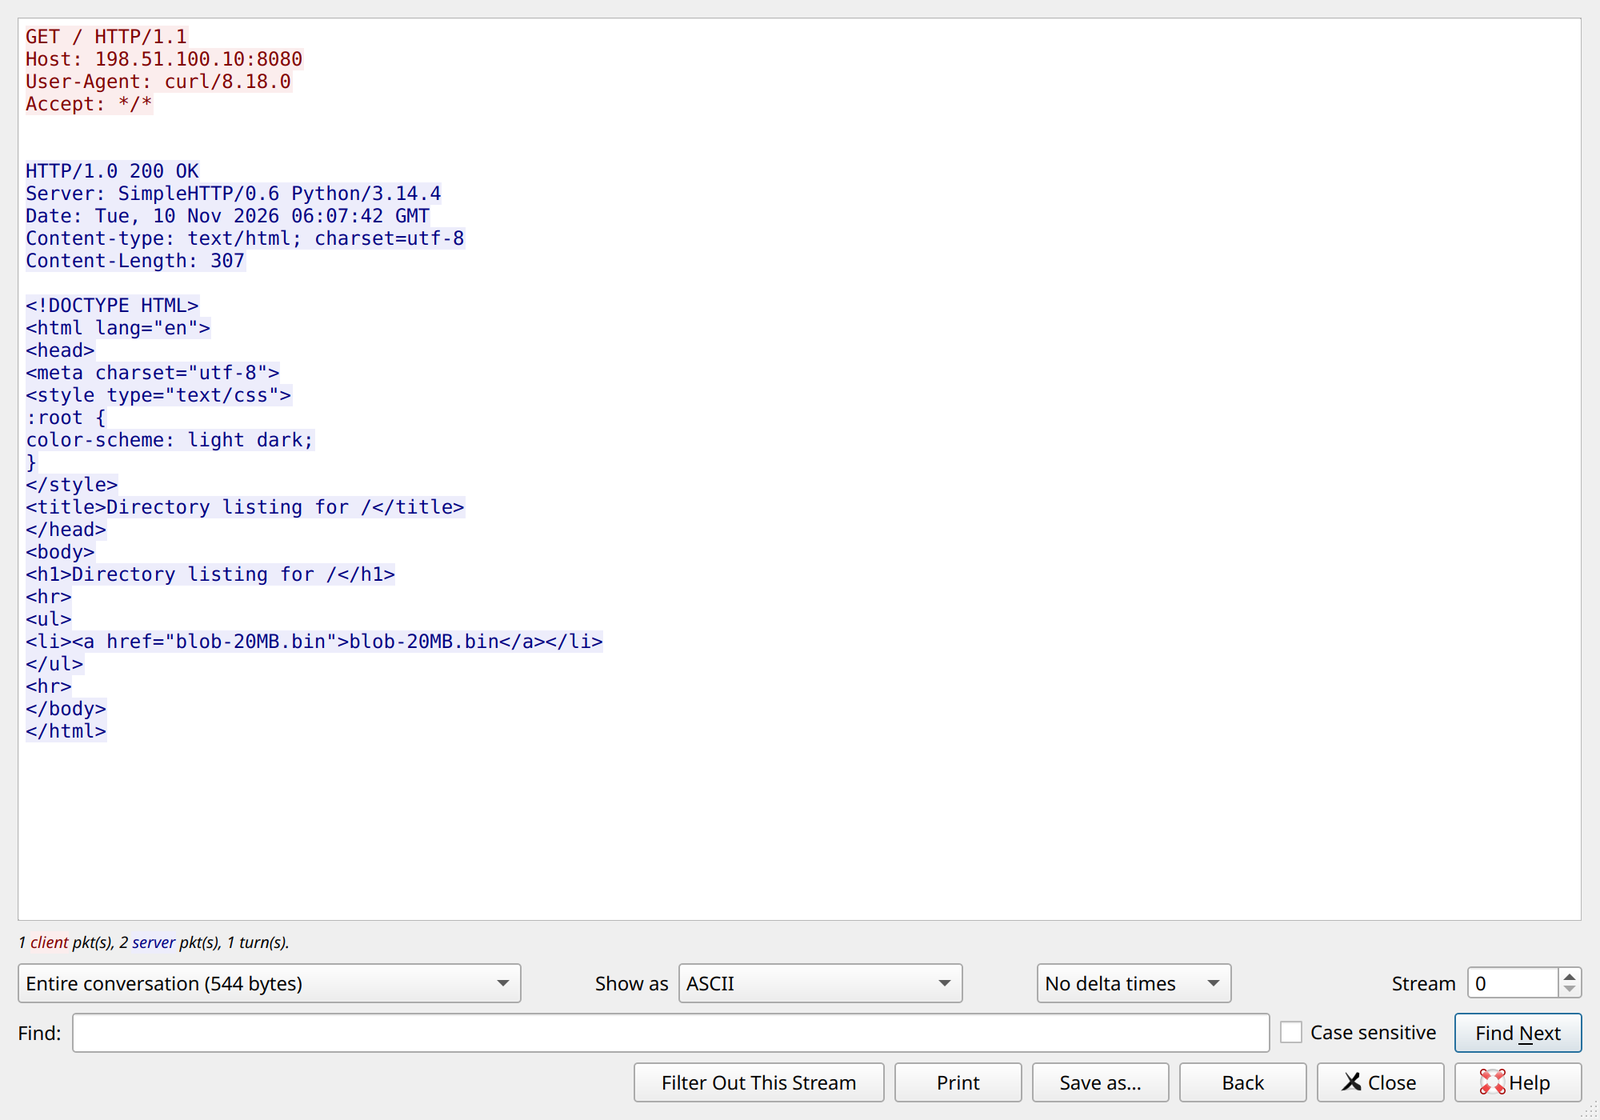
For cleartext protocols this is the fastest way to see what an application actually said. For TLS you see the handshake and ciphertext only, unless you load session keys.
Wireshark vs tshark vs tcpdump
| Wireshark | tshark | tcpdump | |
|---|---|---|---|
| Interface | GUI | Terminal | Terminal |
| Capture engine | dumpcap | dumpcap | libpcap directly |
| Capture filter syntax | BPF | BPF (-f) | BPF |
| Display filters and full dissectors | Yes | Yes (-Y, -T fields) | No, header-level decode only |
| Expert Info, I/O Graph, Follow Stream | Yes | As text (-z expert, -z io,stat, -z follow) | No |
| Best for | Reading and explaining a capture | Scripting and remote boxes | Quick captures on any Linux box or appliance |
A common workflow: capture with tcpdump or dumpcap where the problem is, copy the pcap back, and read it in Wireshark. The tcpdump tutorial and the tshark guide cover the terminal side.
Gotchas
"port" is not a valid protocol or protocol field. You typed BPF in the display filter bar. Use tcp.port == 8080 there, and keep port 8080 for Capture Options.dumpcap: You do not have permission to capture on device "eth1". (Attempt to create packet socket failed - CAP_NET_RAW may be required) Your user is not in the wireshark group, or you have not logged out since adding it. Do not fix it by running Wireshark as root.This packet's length exceeds MSS (common with TSO or incomplete conversations) I started a capture two seconds into a download: 2,896 of these notes and two bogus HTTP warnings, because Wireshark never saw the SYN. Start the capture first.ethtool -K when segment-level analysis matters.Previous segment(s) not captured (common at capture start) with no real loss. The capture itself can miss packets. Check the dumpcap summary line (Packets received/dropped on interface 'eth1': 2922/0) and the drop counter in Statistics > Capture File Properties before blaming the network."tcp.port in {80 8443}" isn't a valid display filter: "8443" was unexpected in this context. Wireshark 4.6 wants commas in a set. Write tcp.port in {80, 8443}.FAQ
How do I filter by IP address in Wireshark?
Use ip.addr == 198.51.100.10 for either direction, ip.src or ip.dst for one direction, and ip.addr == 192.0.2.0/24 for a subnet. For IPv6 the field is ipv6.addr.
What is the difference between a capture filter and a display filter?
A capture filter is BPF, runs in the kernel and decides what gets written to disk. A display filter runs on dissected fields after capture and only hides packets. You can change a display filter at any time; you cannot recover packets a capture filter dropped.
What does TCP Previous segment not captured mean?
The segment's sequence number is higher than the next one Wireshark expected, so bytes are missing from the capture. In the lab each one matched a real drop. It can also mean the capture started mid-flow or dropped packets itself, so check the capture drop counters.
How do I find TCP retransmissions in Wireshark?
Apply tcp.analysis.retransmission, or open Analyze > Expert Information and read the count. Remember the capture point: at the receiver, some resends show up as out-of-order instead, so count from the sender side when you need an exact number.
Can Wireshark capture traffic on a Cisco switch or router?
Not directly. Mirror the port with SPAN to a Wireshark host, or capture on the device with Embedded Packet Capture on IOS XE or ASA packet capture, export the pcap and open it in Wireshark.
Is Wireshark on Kali Linux different?
No. Kali packages the same Wireshark as Debian, preinstalled. The capture permission rules, filters and Expert Information work exactly as shown here.
Not covered here: wireless monitor mode, TLS decryption with key logs, and long ring-buffer captures (the tshark guide covers ring buffers).
Key takeaways
- Capture filters (BPF) decide what is saved; display filters (fields) decide what you see. Mixing them up is the red bar.
- Expert Information is the fastest loss check: in the lab, 144 gaps at the client matched 145 drops, with one back-to-back pair explaining the difference.
- At the receiver, count
[TCP Previous segment not captured]; capture upstream of the loss when you need exact retransmission numbers. - Prove a zero baseline and a clean recovery, and rule out capture artifacts (late start, offloads, reordering) before you blame the network.
Next in the series: How to Use hping3: Commands and Examples, where Wireshark shows what an IOS XE ACL sends back.
Related: tshark: Wireshark in the Terminal · tcpdump Tutorial for Network Engineers · TCP Retransmission, Reordering or Capture Artifact · tc netem: Delay, Loss and Reordering · How to Use iPerf3 · Series hub: Linux Networking Commands: The Complete Guide