
The Zabbix article recorded what SNMP and a few simple checks look like on this campus-and-branch network. The Cacti article recorded what the official Cisco graphs look like over SNMPv3. Nagios Core answers a different question: what do active host and service checks look like when the checker itself reaches the devices, and what does a real failure look like as it moves from a soft result to a hard one.
This write-up is from Nagios Core 4.5.14 with official Nagios Plugins 2.5, built in my home lab on November 8, 2026. It complements Zabbix on a multi-site enterprise lab and Cacti SNMP graphs on a multi-site lab. It is not a ranking of the three tools.
I built Core and the plugins from the official tarballs, with checksums checked before compile. I used the stock Nagios CGI interface, not Adagios.
The network I checked
The lab is the same multi-site design: HQ campus, data center, two branches, and two WAN providers. Provider A is preferred. Provider B is the backup.
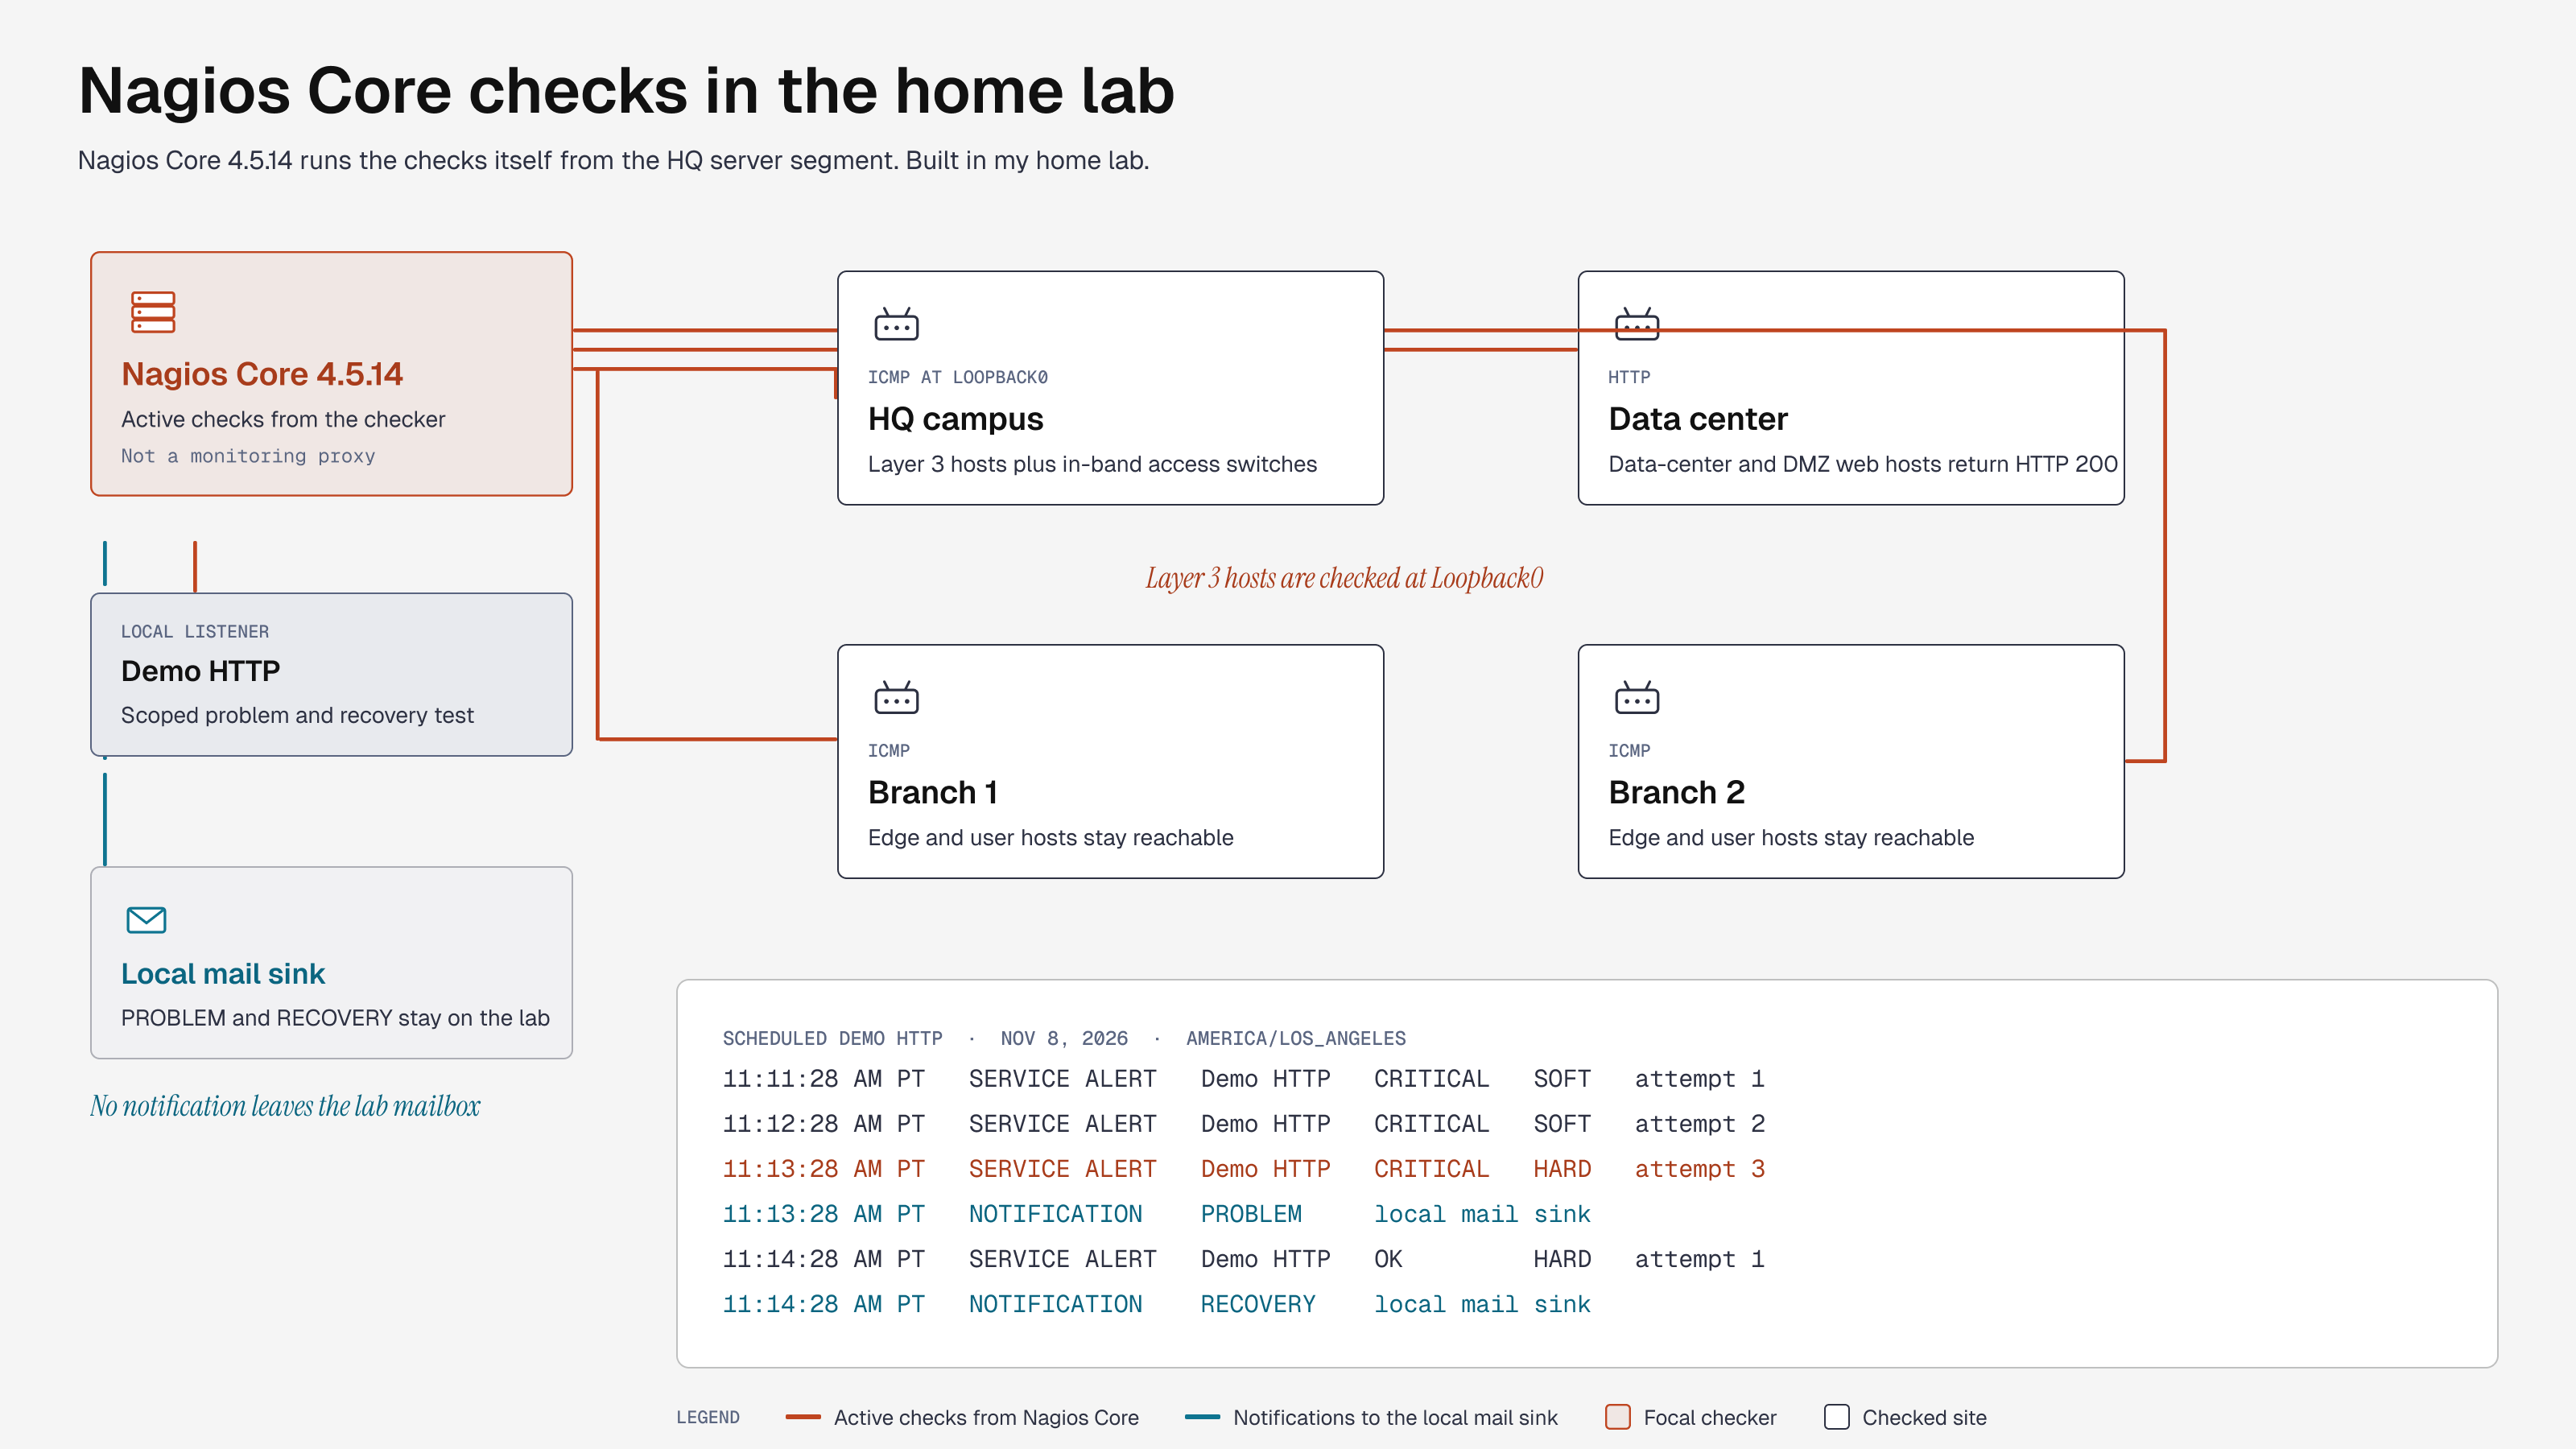
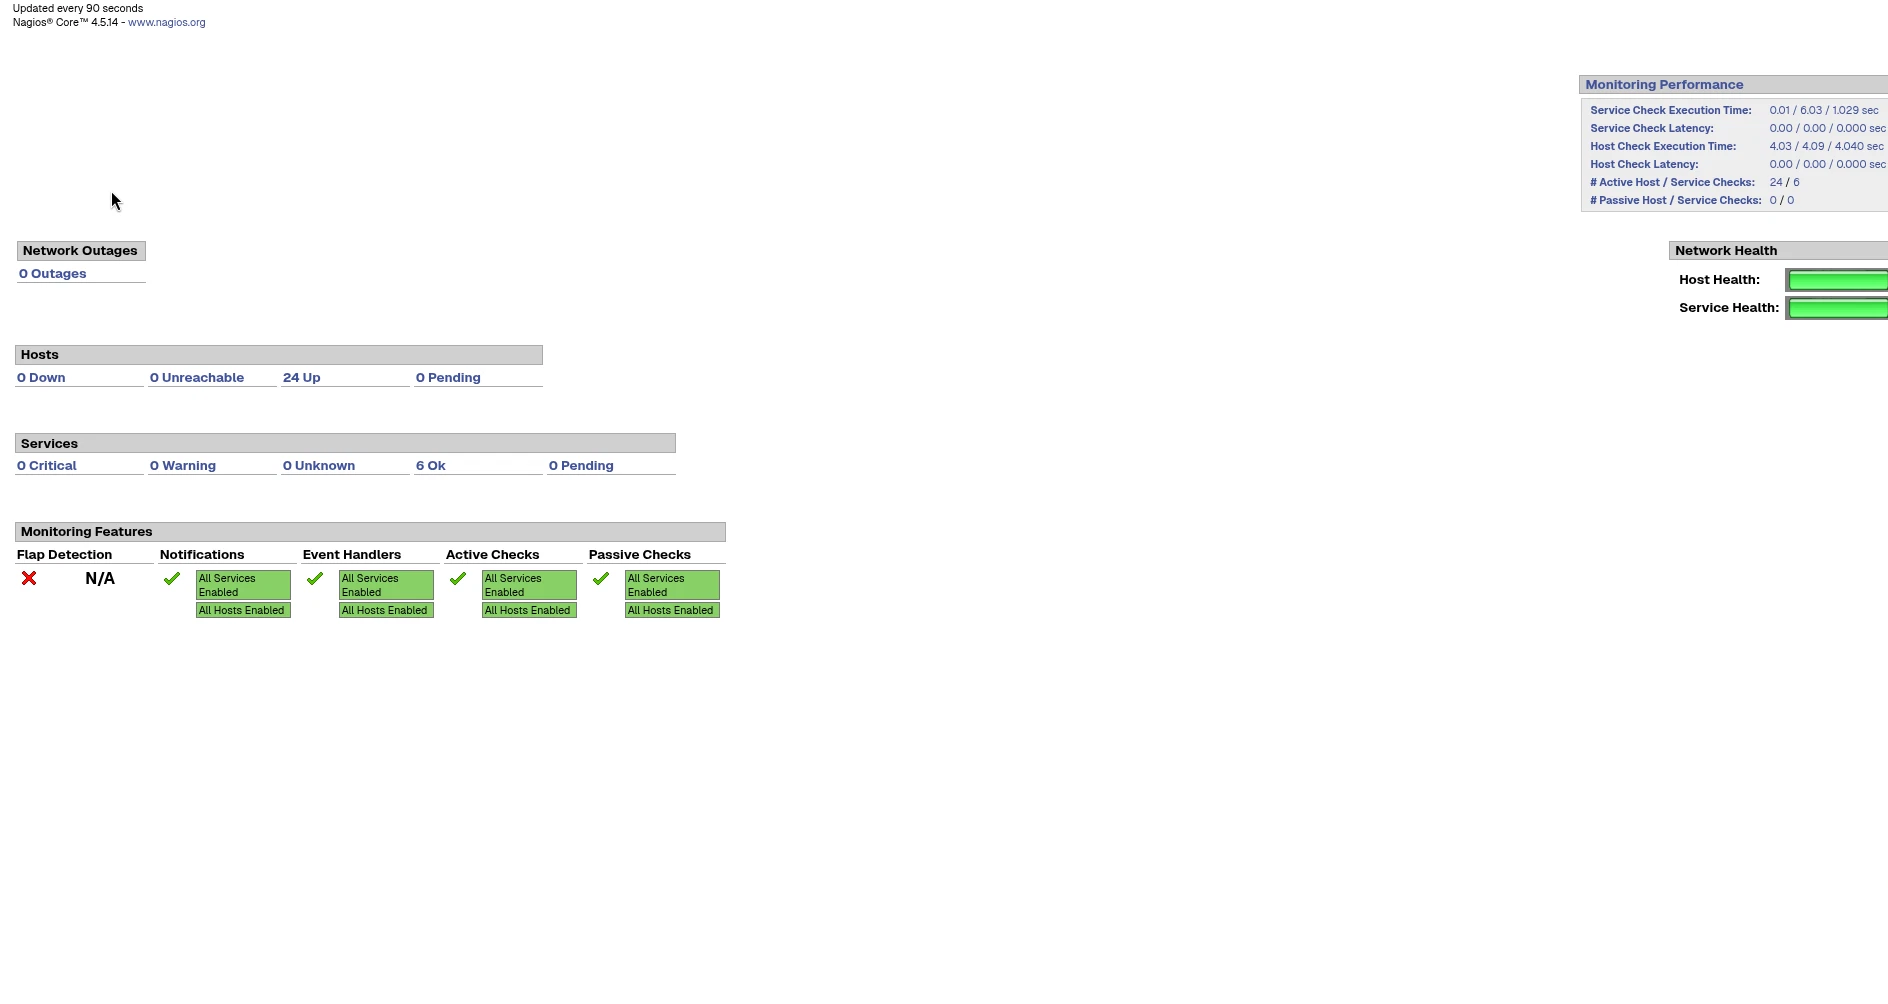
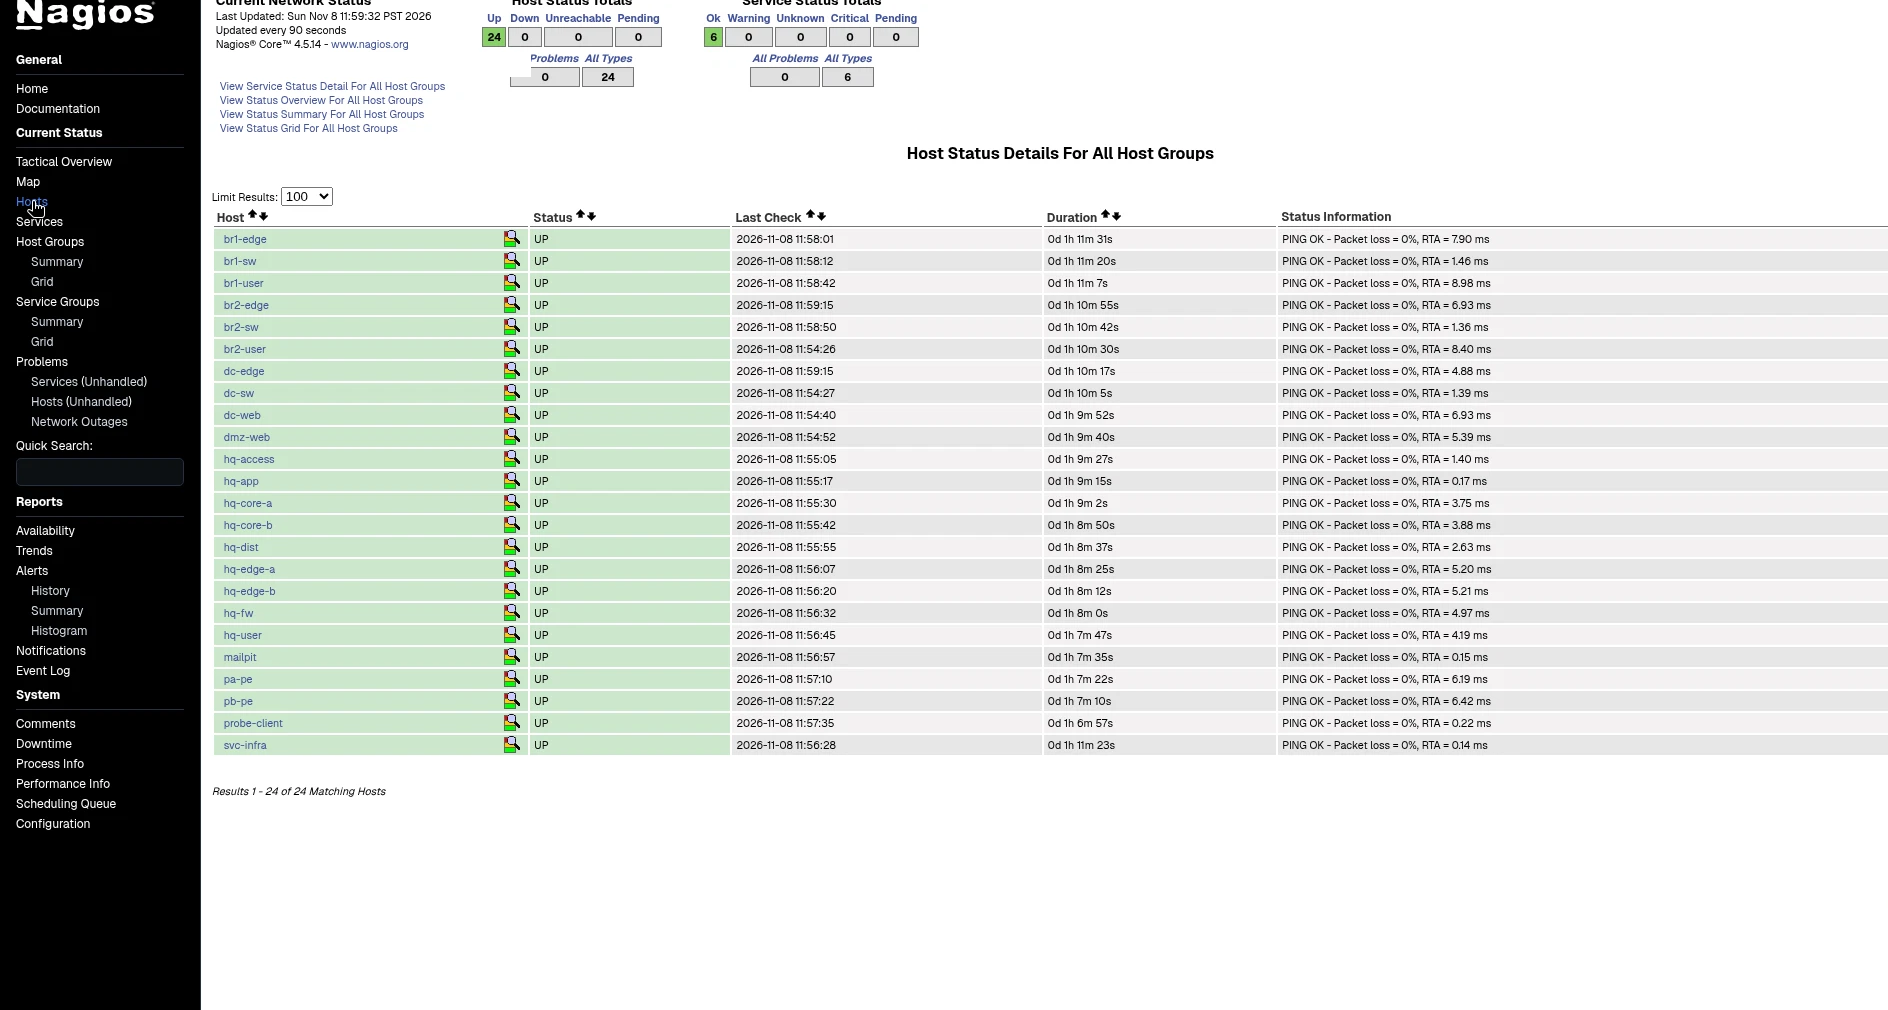
I added 24 hosts. The 11 Layer 3 routers are checked at Loopback0, so a WAN link down is not also a management-path down. The four access switches are checked at their in-band management addresses. The remaining hosts are Linux endpoints: campus and branch users, the services host, the data-center and DMZ web hosts, a probe client, the HQ app, and the local mail sink.
The checker that talks to those hosts is Nagios Core itself, running in the HQ server segment. There is no proxy in this path.
The HQ app is checked at its management address. ICMP to that management address succeeded, with a round-trip average of 0.22 ms. ICMP to the app's data-plane address failed with "Host Unreachable." The access switch port toward that app is still up and forwarding, and it still has not learned a MAC on that port. That matches the earlier Cacti note: an up interface is not the same as the attached application being reachable. I did not bounce the port.
What the checks returned
nagiostats from this instance reported Nagios Stats 4.5.14 (last modified 2026-08-05), 24 hosts up, and 6 services OK:
Total Hosts:                            24
Hosts Up/Down/Unreach:                  24 / 0 / 0
Total Services:                         6
Services Ok/Warn/Unk/Crit:              6 / 0 / 0 / 0
Services Actively Checked:              6
Services Passively Checked:             0
Every host and every service in this instance is an active check. I did not feed results in through the external command pipe for the baseline.
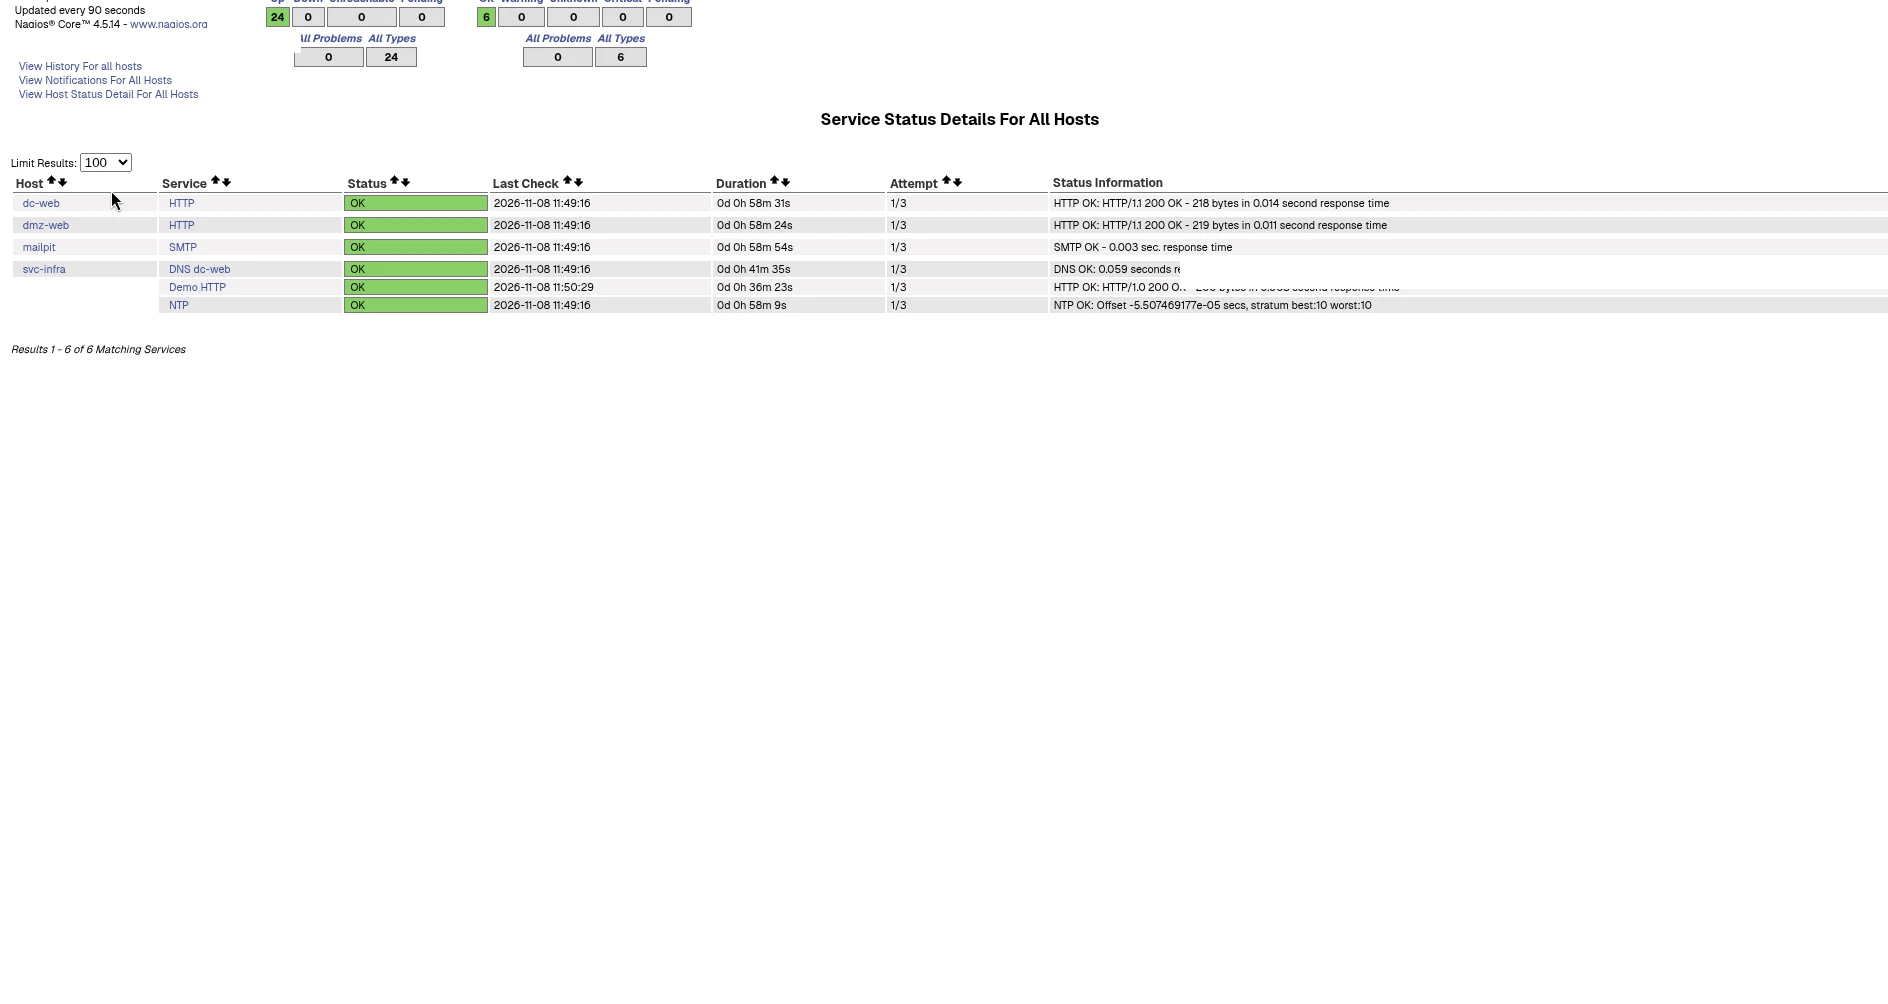
The six services, after the restored baseline, were:
- HTTP on the data-center web host:
HTTP OK: HTTP/1.1 200 OK - 218 bytes in 0.013 second response time - HTTP on the DMZ web host:
HTTP OK: HTTP/1.1 200 OK - 219 bytes in 0.010 second response time - DNS on the services host, looking up the data-center web name:
DNS OK: 0.047 seconds response time - NTP on the services host:
NTP OK: Offset -0.000054 secs, stratum 10 - SMTP on the local mail sink:
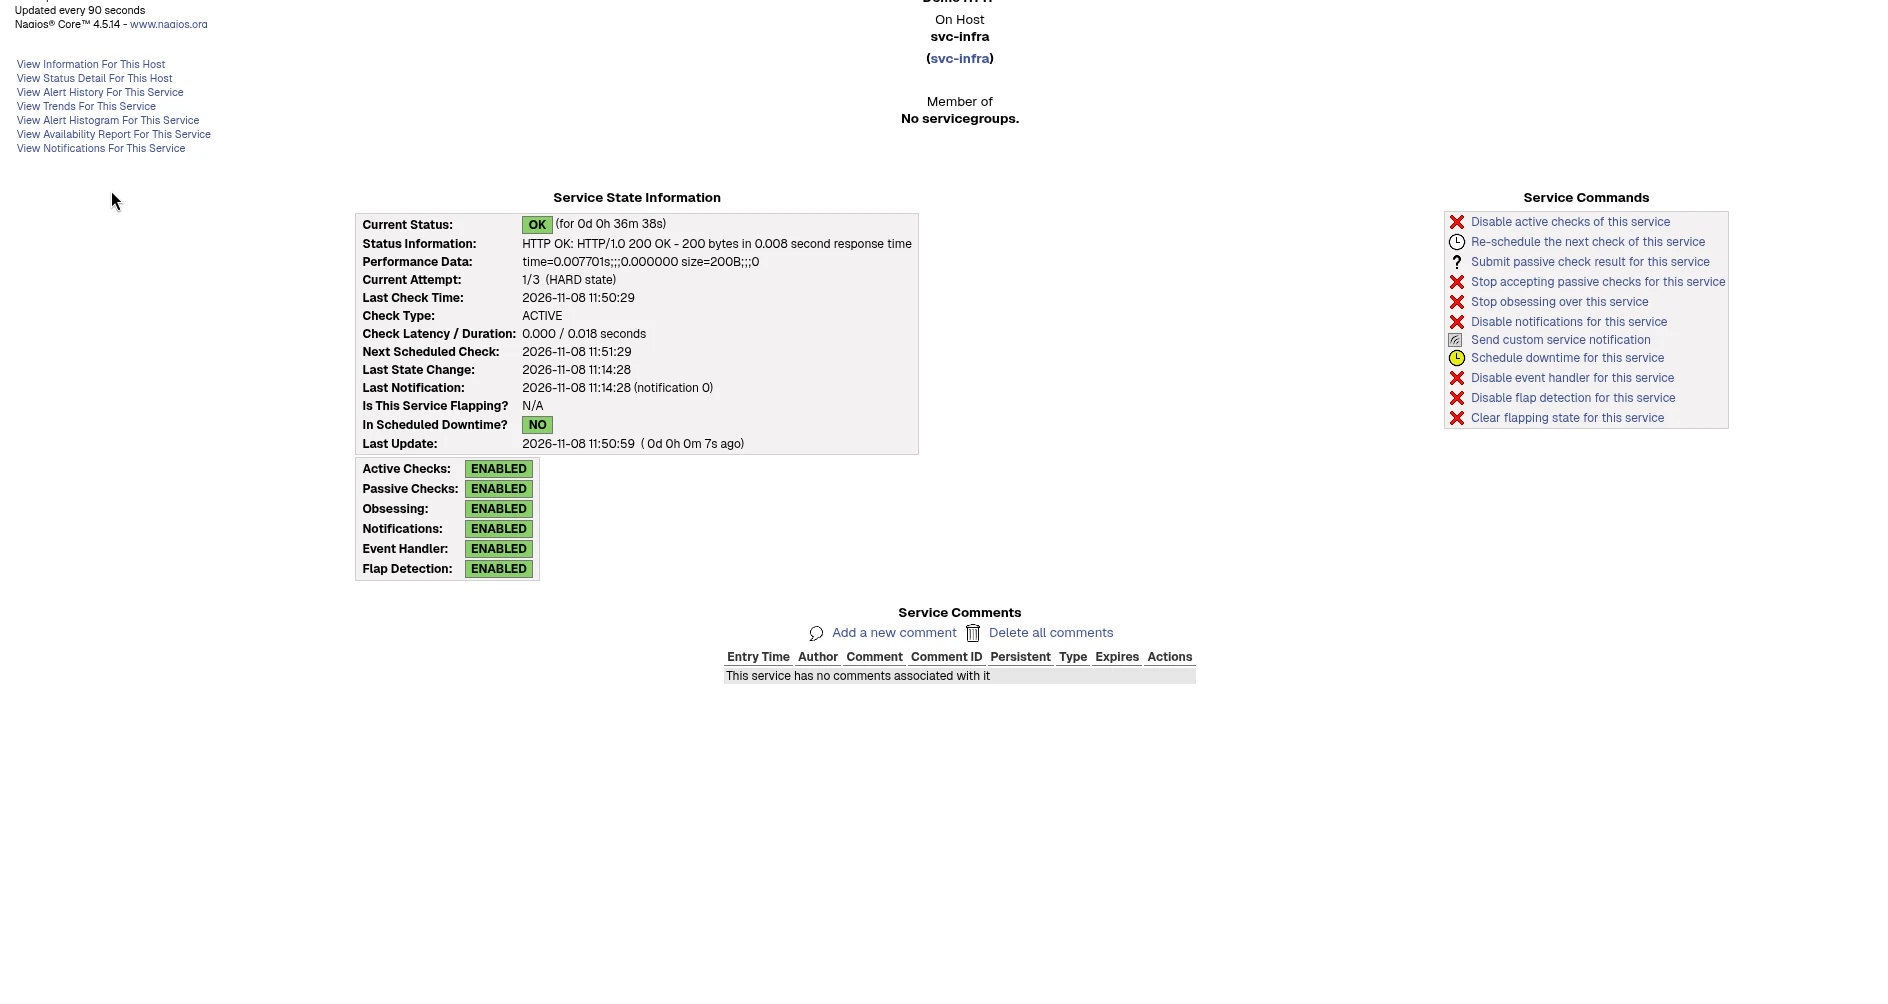
SMTP OK - 0.003 sec. response time - Demo HTTP on a listener that runs on the checker host itself:
HTTP OK: HTTP/1.0 200 OK - 200 bytes in 0.004 second response time
A ping from the same checker to an HQ edge loopback returned PING OK - Packet loss = 0%, RTA = 5.11 ms.
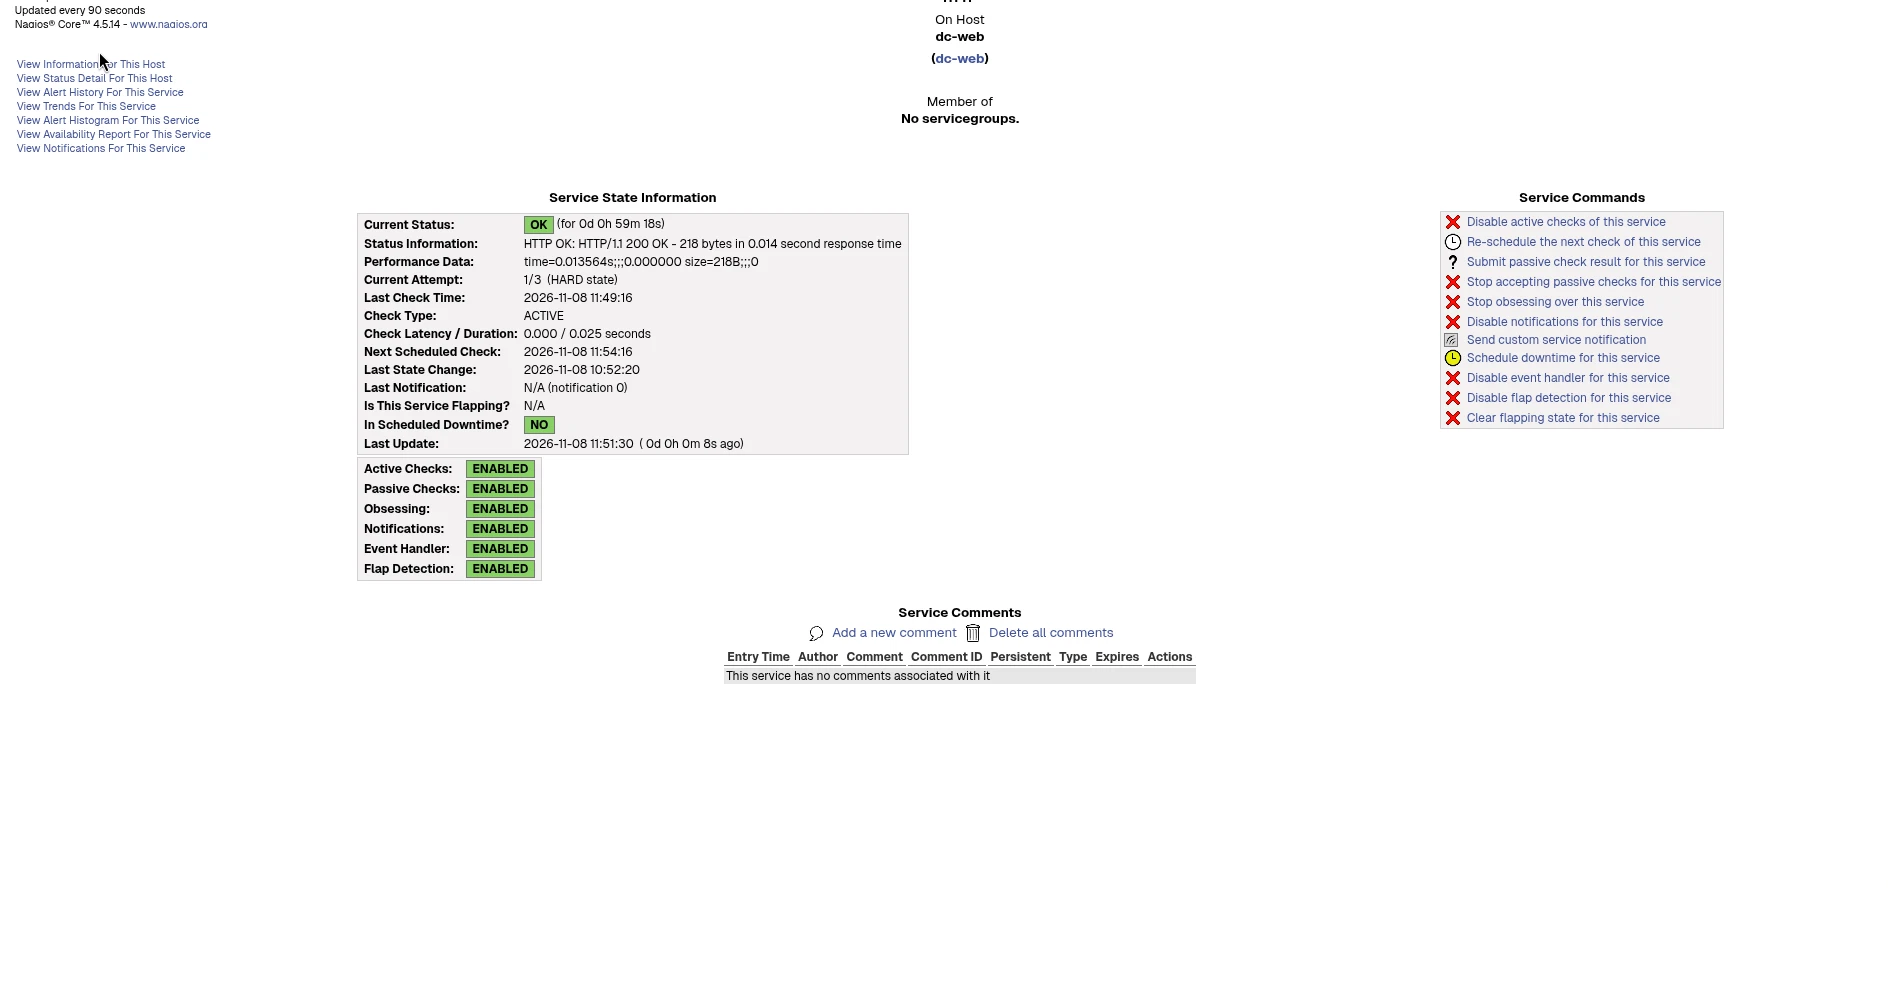
Host checks use a 5 minute interval, a 1 minute retry, and 3 attempts. Five of the services use that same template. Demo HTTP uses a 1 minute check interval and a 1 minute retry, still with 3 attempts, because I wanted the failure timeline to be readable in a few minutes. The process interval length is 60 seconds, so those service intervals are in minutes.
I did not add SNMP checks in this instance. Cacti already covers SNMPv3 graphs on the Cisco devices, and I did not want a second copy of those credentials in this write-up.
A scheduled failure and recovery
I stopped the Demo HTTP listener at 11:10:53 AM Pacific Time on November 8, 2026. I then left Nagios on its regular schedule. I did not send SCHEDULE_FORCED_SVC_CHECK during this window. The next results arrived one minute apart, which matches the 1 minute retry on that service.
11:11:28 AM PT  SERVICE ALERT  Demo HTTP  CRITICAL  SOFT  attempt 1
11:12:28 AM PT  SERVICE ALERT  Demo HTTP  CRITICAL  SOFT  attempt 2
11:13:28 AM PT  SERVICE ALERT  Demo HTTP  CRITICAL  HARD  attempt 3
11:13:28 AM PT  SERVICE NOTIFICATION  PROBLEM
11:14:28 AM PT  SERVICE ALERT  Demo HTTP  OK        HARD  attempt 1
11:14:28 AM PT  SERVICE NOTIFICATION  RECOVERY
The plugin text on the three failures was a connection refused to the local listener. The recovery text was HTTP OK: HTTP/1.0 200 OK - 200 bytes in 0.007 second response time.
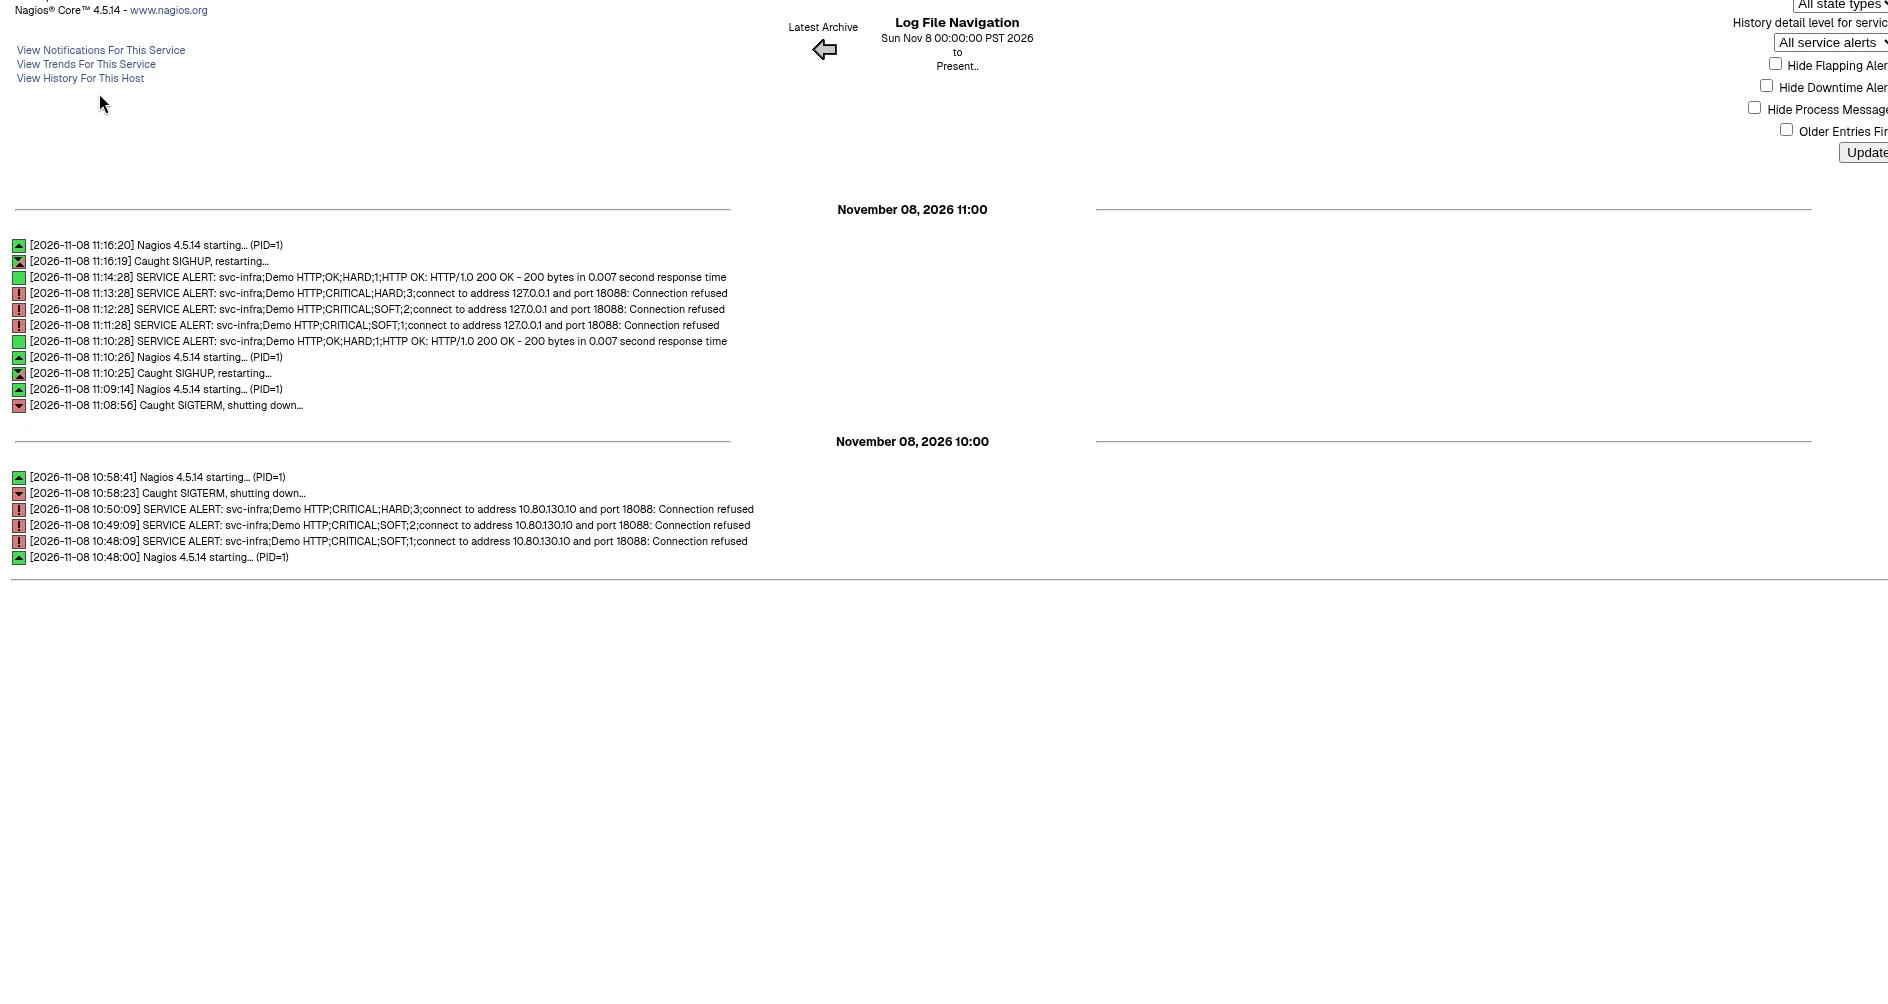
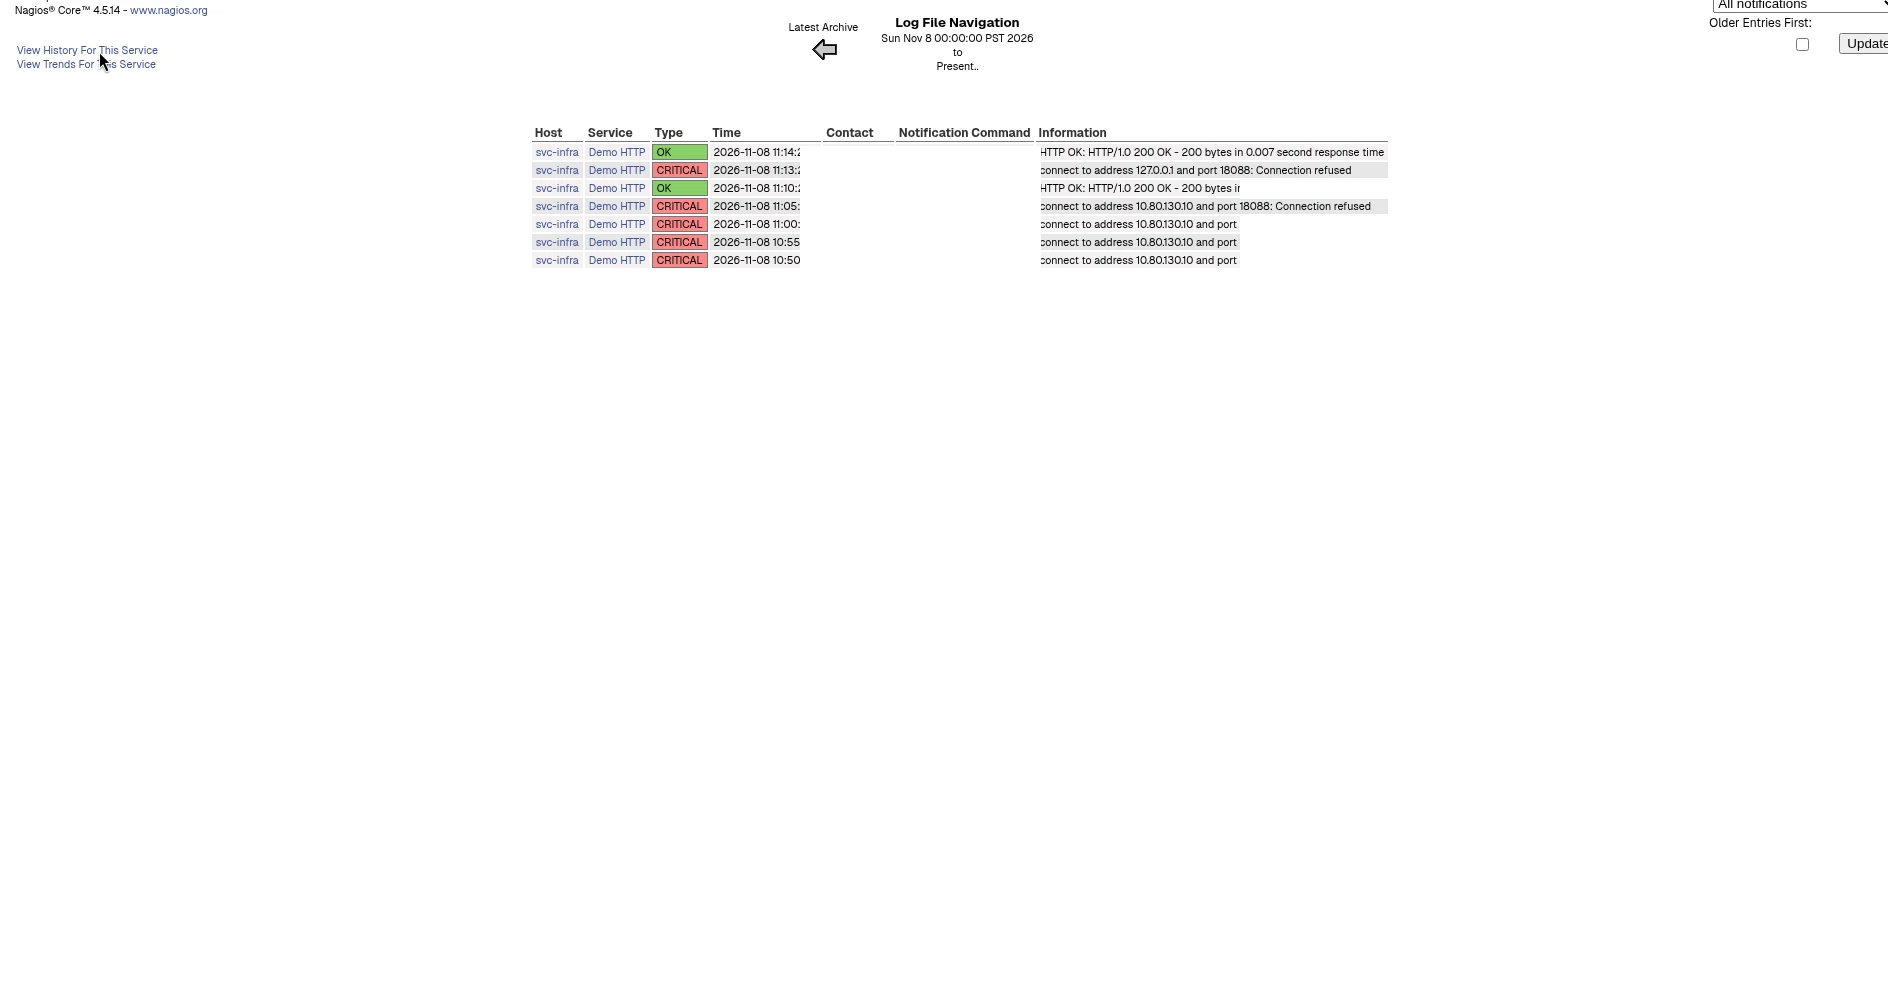
Soft results do not notify in this config. The first two CRITICAL results stayed SOFT. The third attempt became HARD, and that is when Nagios sent notify-service-by-email. I restored the listener at 11:14:00 AM PT. The next scheduled check, 28 seconds later, returned OK as a HARD recovery and sent the recovery notification.
Those notifications went to a local mail sink on the same lab, not to an outside mailbox. The sink stored these subjects:
11:13:28 AM PT  ** PROBLEM Service Alert: svc-infra/Demo HTTP is CRITICAL **
11:14:28 AM PT  ** RECOVERY Service Alert: svc-infra/Demo HTTP is OK **
The sink's created timestamps were 2026-11-08T19:13:28.53Z and 2026-11-08T19:14:28.561Z, which convert to those Pacific Time clock readings (PST on this date).
Earlier the same morning I did use forced checks, and the mail sink did record other PROBLEM lines. Those came from install work: the official check_dns plugin is an extra program and is compiled only when nslookup is present at build time, and the first Demo HTTP command aimed at the checker host address instead of the local listener. I am not treating those messages as the planned test. The scheduled window above has no external command between the first failure and the recovery.
What this post does not cover
I did not run Icinga, OpenNMS, or PRTG on this network for this article. This is not a performance comparison with Zabbix or Cacti. Native Nagios notification to a public mailbox is out of scope.