
People reach for Checkmk's free edition because they want automation, not another afternoon of clicking hosts into a GUI. A sponsored NetworkChuck video from October 12, 2026, says an AI agent can take the keys and finish the job. On Checkmk Community 2.5.0p18, that write path is the official REST API and an automation user, not the official MCP server. I installed Community in my home lab, used REST the way an agent would, and timed a reversible provider-A WAN shutdown.
This write-up uses the same multi-site network as the Zabbix, Cacti, and Nagios Core labs. It is not a ranking.
What the video showed, and what the docs say
The video creates an automation user with a machine-account secret, assigns the administrator role, activates changes, and asks an agent to add hosts and a dashboard through the API. That is REST. The official Checkmk MCP server is documented for commercial editions, version 2.5.0p13 or later, HTTPS plus OAuth. It is experimental and read-only. It cannot add hosts. The Slack and ticketing pieces in the video are outbound notification scripts into other tools, not MCP writes.
Community, the current name for the old Raw edition, includes the REST API. That is the interface a local agent can use without a paid site and without sending inventory to an external model.
The network I monitored
The lab is a small campus-and-branch design: a redundant HQ core, a data center, two branches, and two WAN providers. Provider A is preferred. Provider B is the backup.
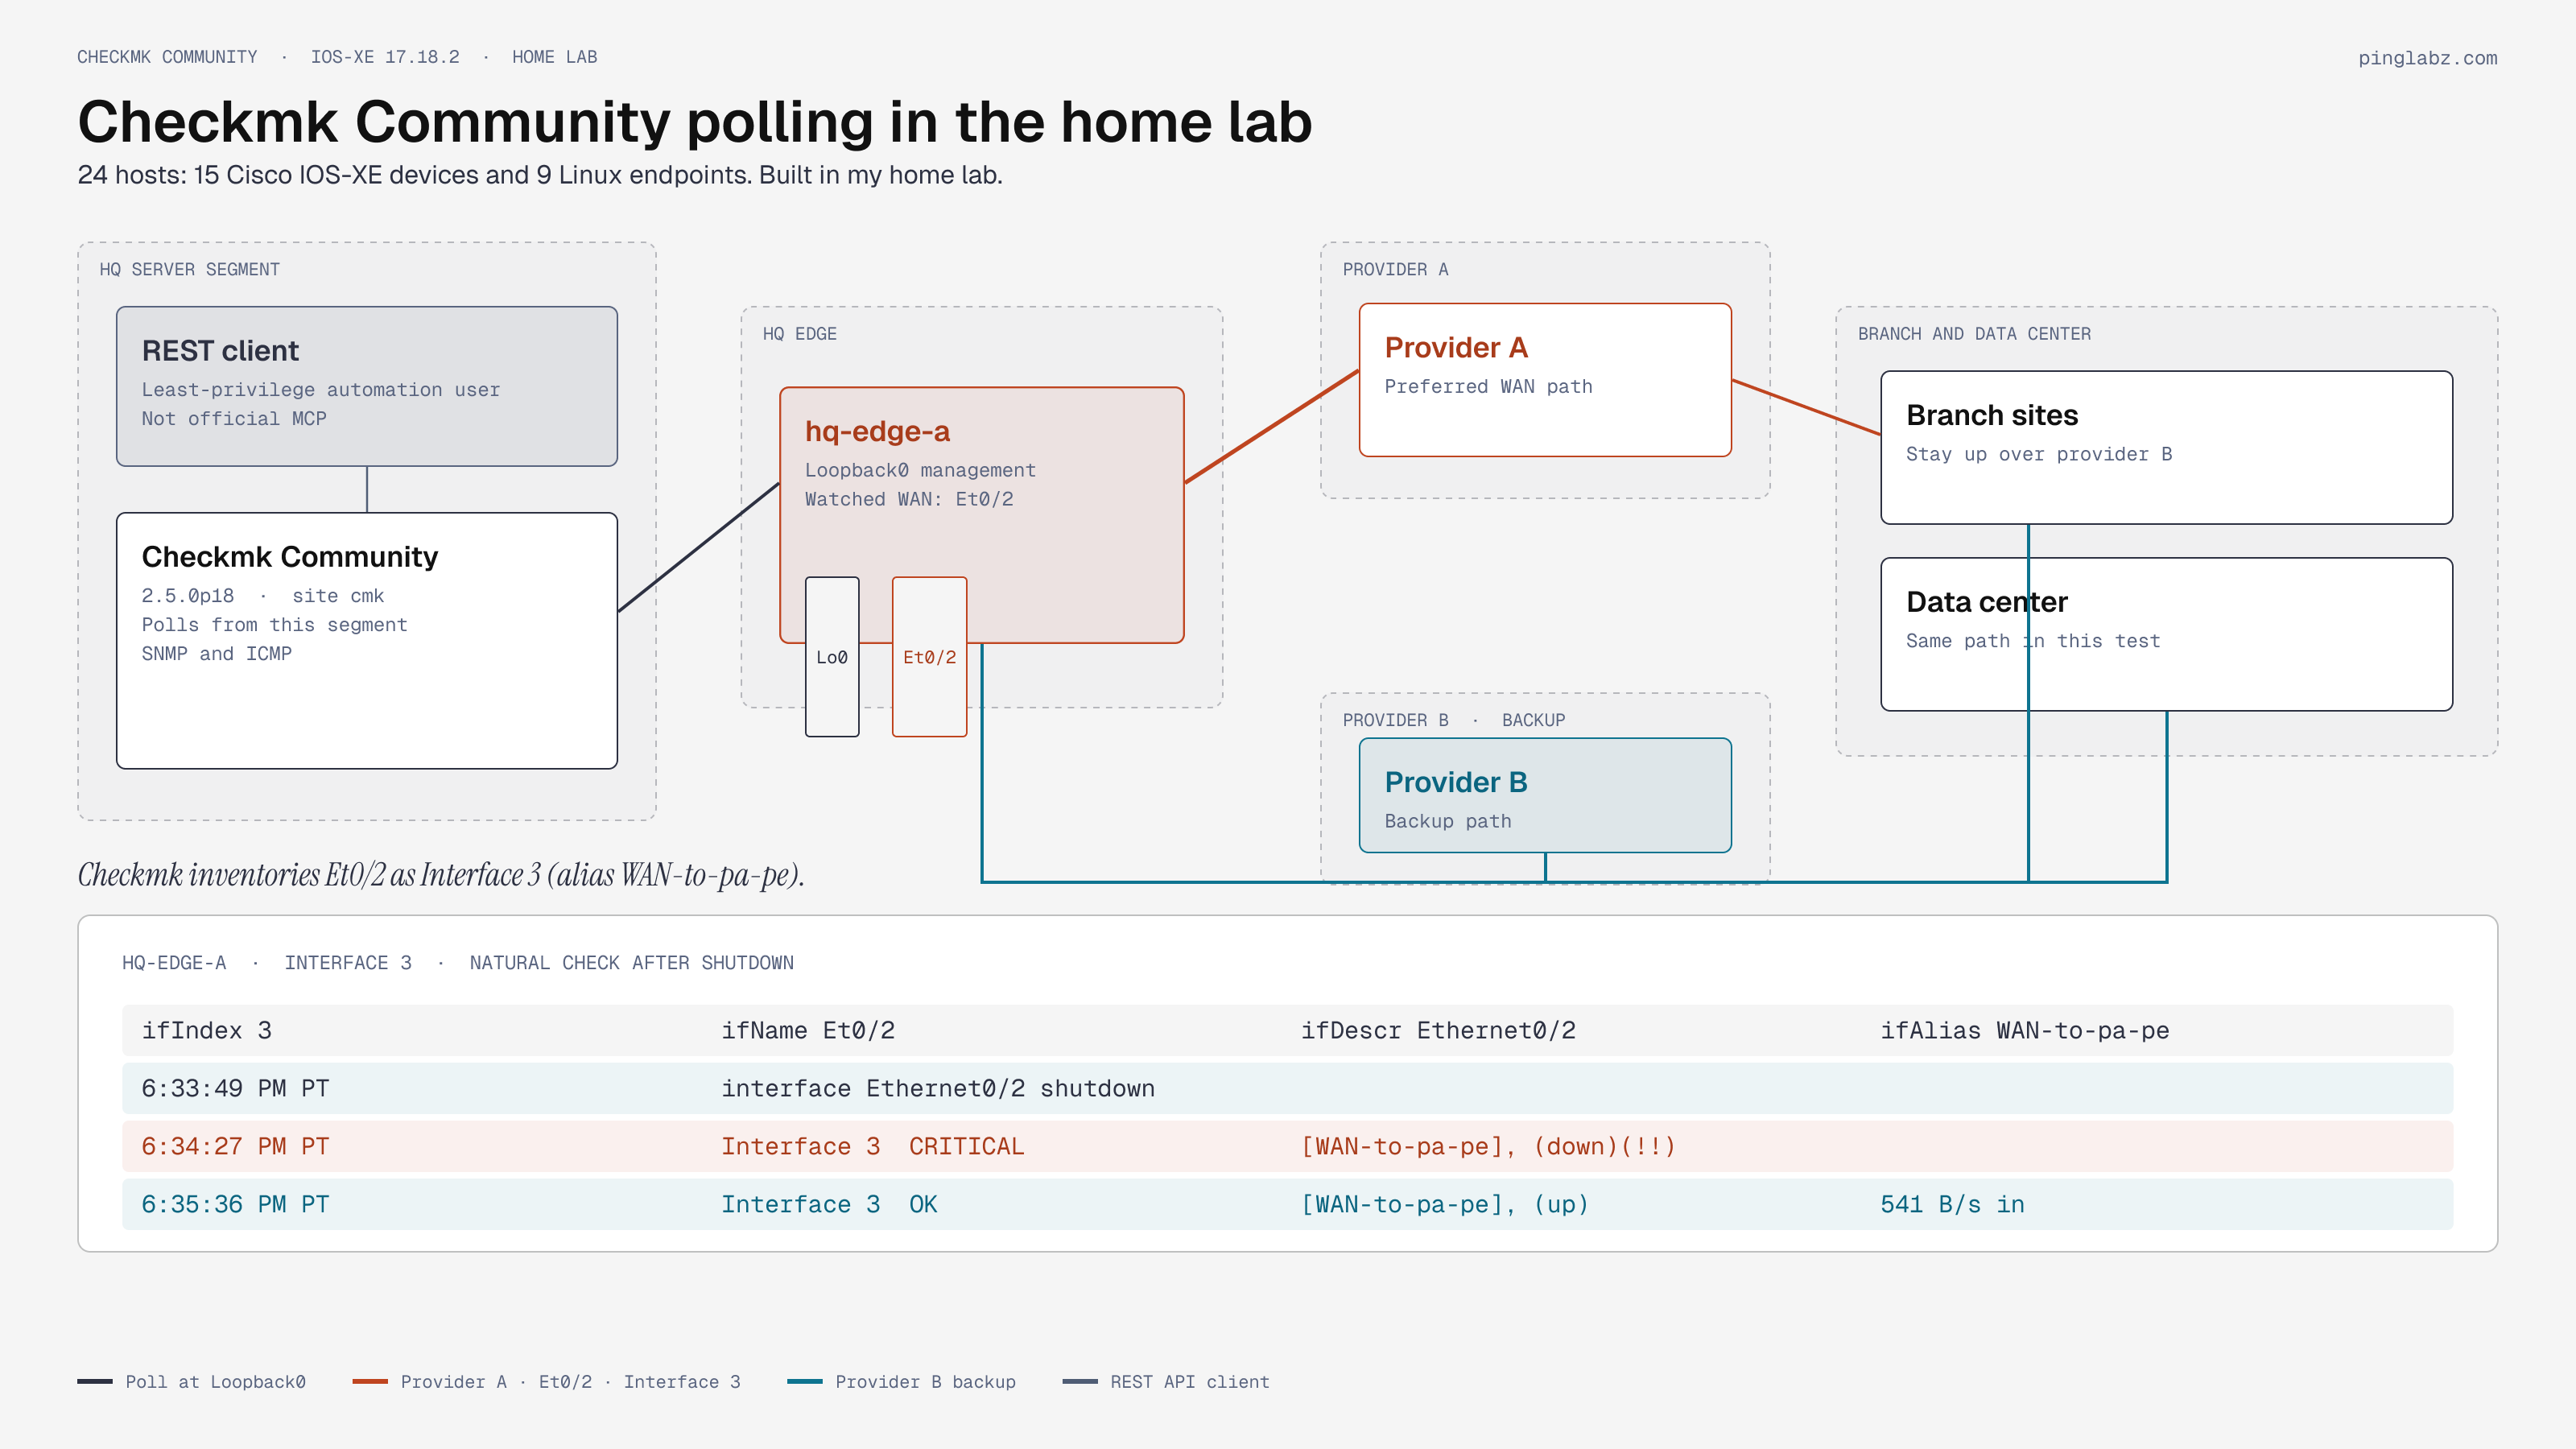
I monitored 24 hosts: 15 Cisco IOS-XE 17.18.2 devices and 9 Linux endpoints. The 11 Layer 3 routers are polled at Loopback0 so a WAN shutdown is not also a management black hole. The four access switches and the Linux endpoints use their in-fabric addresses. Linux hosts are ping-only in this site.
The Checkmk site ID is cmk. The installed version string is 2.5.0p18.community. The REST version resource reports edition community and demo false. Checks originate from the HQ server segment, not from a laptop on the home LAN.
I used the official Community container image, tag 2.5.0-latest, digest sha256:b7070e907f2a1bbcf9aefeabc405b11e4ad7686ce9bc0bb54f831bea05b94980.
Device side: IOS-XE SNMPv3 and short ifNames
The routers already speak SNMPv3 authPriv. The names Checkmk will see in IF-MIB are the short ifNames this image returns, such as Et0/2 and Lo0, with ifDescr Ethernet0/2 and ifAlias WAN-to-pa-pe on the provider-A handoff.
snmp-server group <GROUP> v3 priv
snmp-server user <USER> <GROUP> v3 auth sha <AUTH-SECRET> priv aes 128 <PRIV-SECRET>
snmp-server host <POLLER-ADDRESS> version 3 priv <USER>
Confirm the WAN name before you invent a service filter:
show interfaces Ethernet0/2 | include line protocol
show snmp user
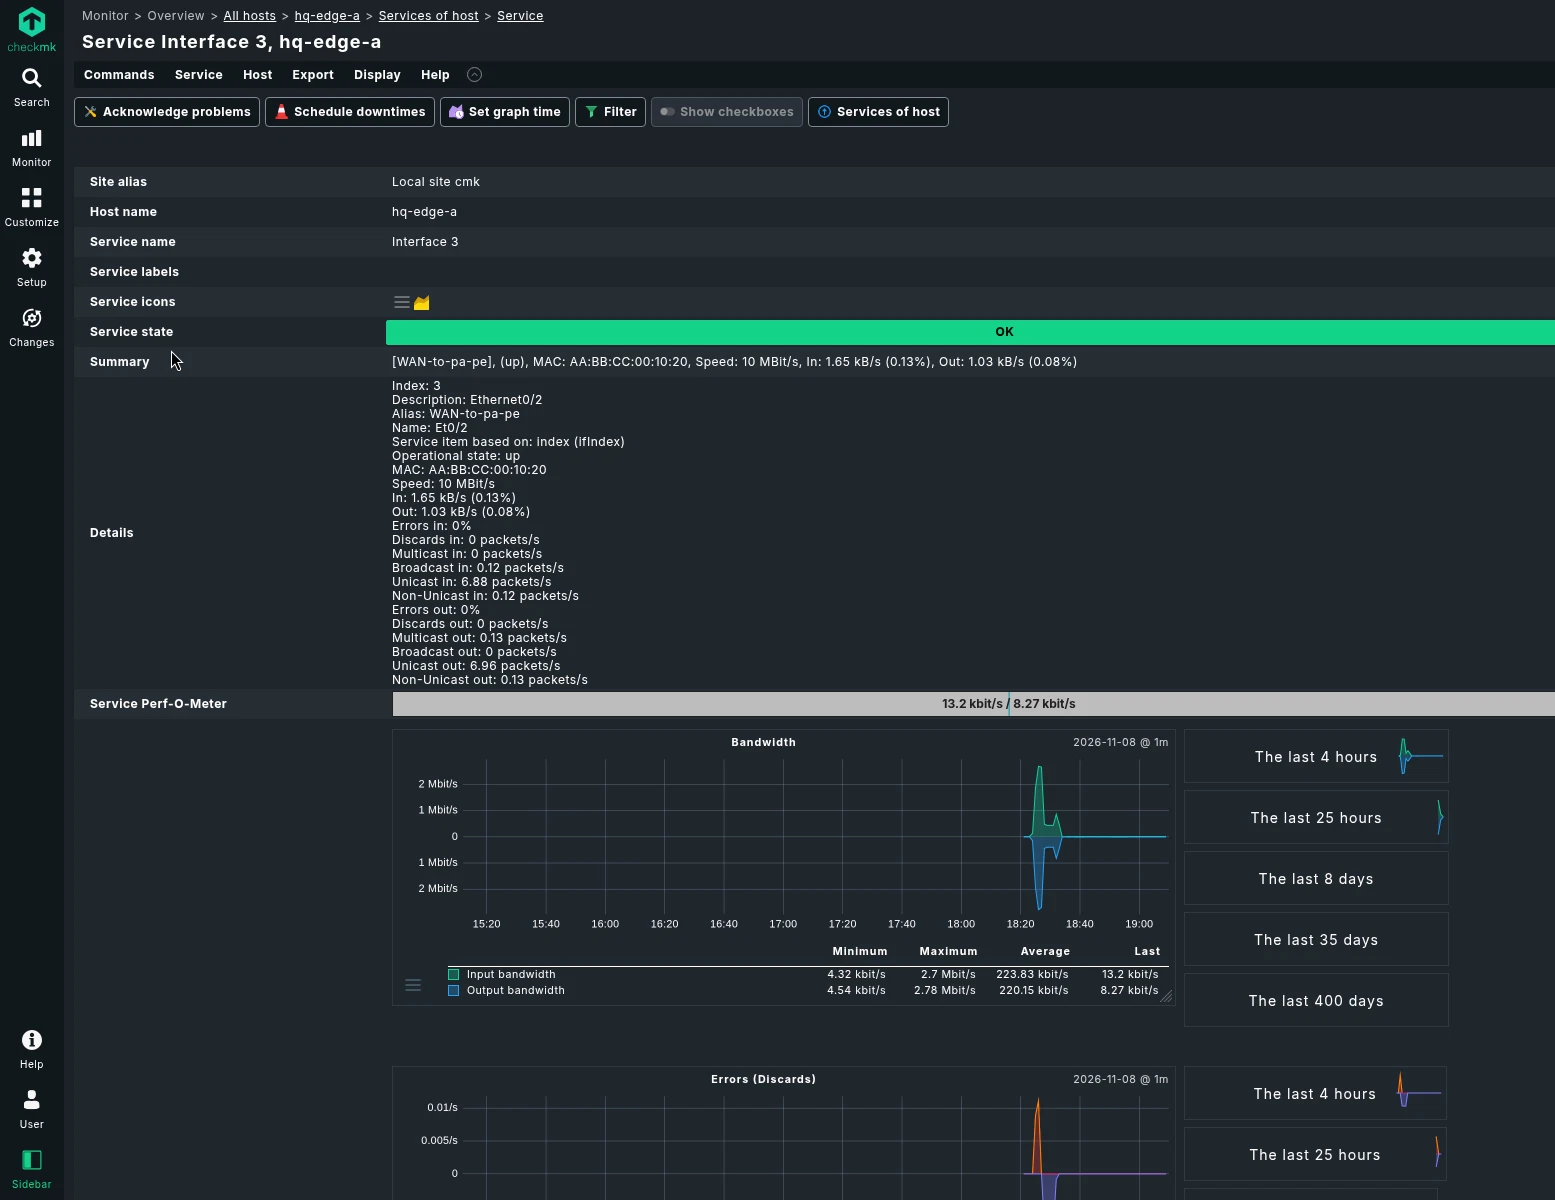
On this HQ edge router, ifIndex 1 is Et0/0, 2 is Et0/1, 3 is Et0/2 (WAN-to-pa-pe), and 4 is Et0/3. Checkmk's default interface inventory used the index as the service name, so the watched WAN check is Interface 3, not a service literally named Et0/2. Read the plugin output for the alias.
This lab has no NX-OS device, so there is no NX-OS snippet here.
Checkmk side: a writer that is not administrator
I cloned Checkmk's empty no_permissions role into rest_writer and enabled only what the agent needed: use Setup, see all hosts, manage and edit hosts, run service discovery (including moving services between undecided, monitored, and removed), and activate or discard changes. The role does not include user administration, global settings, backups, or notifications.
Create an automation user, for example rest-agent, with that role. Store the secret outside the article. REST calls use:
Authorization: Bearer rest-agent <AUTOMATION-SECRET>
Accept: application/json
Create a Cisco host at Loopback0. Community's REST schema rejected SHA and AES as protocol names and returned HTTP 400 listing the allowed enums, including SHA-1-96 and AES-128. Those two values worked with tag_agent=no-agent and tag_snmp_ds=snmp-v2:
curl -sS -X POST \
  -H "Authorization: Bearer rest-agent <AUTOMATION-SECRET>" \
  -H "Accept: application/json" \
  -H "Content-Type: application/json" \
  http://<CHECKMK-HOST>/cmk/check_mk/api/v1/domain-types/host_config/collections/all \
  -d '{
    "folder": "/",
    "host_name": "hq-edge-a",
    "attributes": {
      "ipaddress": "<LOOPBACK0>",
      "tag_agent": "no-agent",
      "tag_snmp_ds": "snmp-v2",
      "snmp_community": {
        "type": "v3_auth_privacy",
        "auth_protocol": "SHA-1-96",
        "privacy_protocol": "AES-128",
        "security_name": "<USER>",
        "auth_password": "<AUTH-SECRET>",
        "privacy_password": "<PRIV-SECRET>"
      }
    }
  }'
Linux hosts omit snmp_community and use tag_snmp_ds=no-snmp so they stay ping-only.
Discovery on this version is:
curl -sS -X POST \
  -H "Authorization: Bearer rest-agent <AUTOMATION-SECRET>" \
  -H "Accept: application/json" \
  -H "Content-Type: application/json" \
  http://<CHECKMK-HOST>/cmk/check_mk/api/v1/domain-types/service_discovery_run/actions/start/invoke \
  -d '{"host_name": "hq-edge-a", "mode": "refresh"}'
Use mode fix_all after a refresh that actually found services. Then read pending changes, send the If-Match ETag, and activate:
curl -sS -X POST \
  -H "Authorization: Bearer rest-agent <AUTOMATION-SECRET>" \
  -H "Accept: application/json" \
  -H "Content-Type: application/json" \
  -H "If-Match: <ETAG>" \
  http://<CHECKMK-HOST>/cmk/check_mk/api/v1/domain-types/activation_run/actions/activate-changes/invoke \
  -d '{"redirect": false, "sites": ["cmk"], "force_foreign_changes": false}'
A fix_all against an empty discovery table can persist no new services. Activate or compile after inventory has real SNMP results, then confirm Interface 3 exists before you call discovery done.
What the agent actually did
These are the REST calls the automation user rest-agent actually made, with recorded HTTP 200 responses:
POST /domain-types/host_config/collections/allcreated all 24 hosts.POST /domain-types/service_discovery_run/actions/start/invokestarted discovery on each host.POST /domain-types/activation_run/actions/activate-changes/invokeactivated the first wave (48 pending changes).- After the access-switch SNMP mismatch was identified,
PUT /objects/host_config/{host}setsnmp_community.typetov3_auth_no_privacywithauth_protocolSHA-1-96onhq-access,dc-sw,br1-sw, andbr2-sw. Checkmk recorded those asedit-hostactions byrest-agent. - A second activate-changes call applied those four host edits.
What REST did not do by itself: compiling newly invented SNMP services into the monitoring core after a successful inventory. I ran Checkmk's site inventory/compile on the host after the REST writes so the services became live. A later REST fix_all against an empty discovery table wiped two switch autocheck files; I re-ran inventory and compiled again rather than pretend that call had discovered anything.
On hq-edge-a, SNMP inventory added Uptime, SNMP Info, and four if64 interfaces. The Check_MK helper reported [snmp] Success. Interface 3's livestatus output in the OK state looks like [WAN-to-pa-pe], (up) plus a rate and a percent of the 10 Mbps discovered speed. That alias is how you know you are looking at Et0/2.
After the switch credential fix and compile, the site had 24 hosts UP and 145 services. Each access switch gained SNMP Info, Uptime, Memory Processor, and interface services, and the Check_MK helper on those hosts reported [snmp] Success.
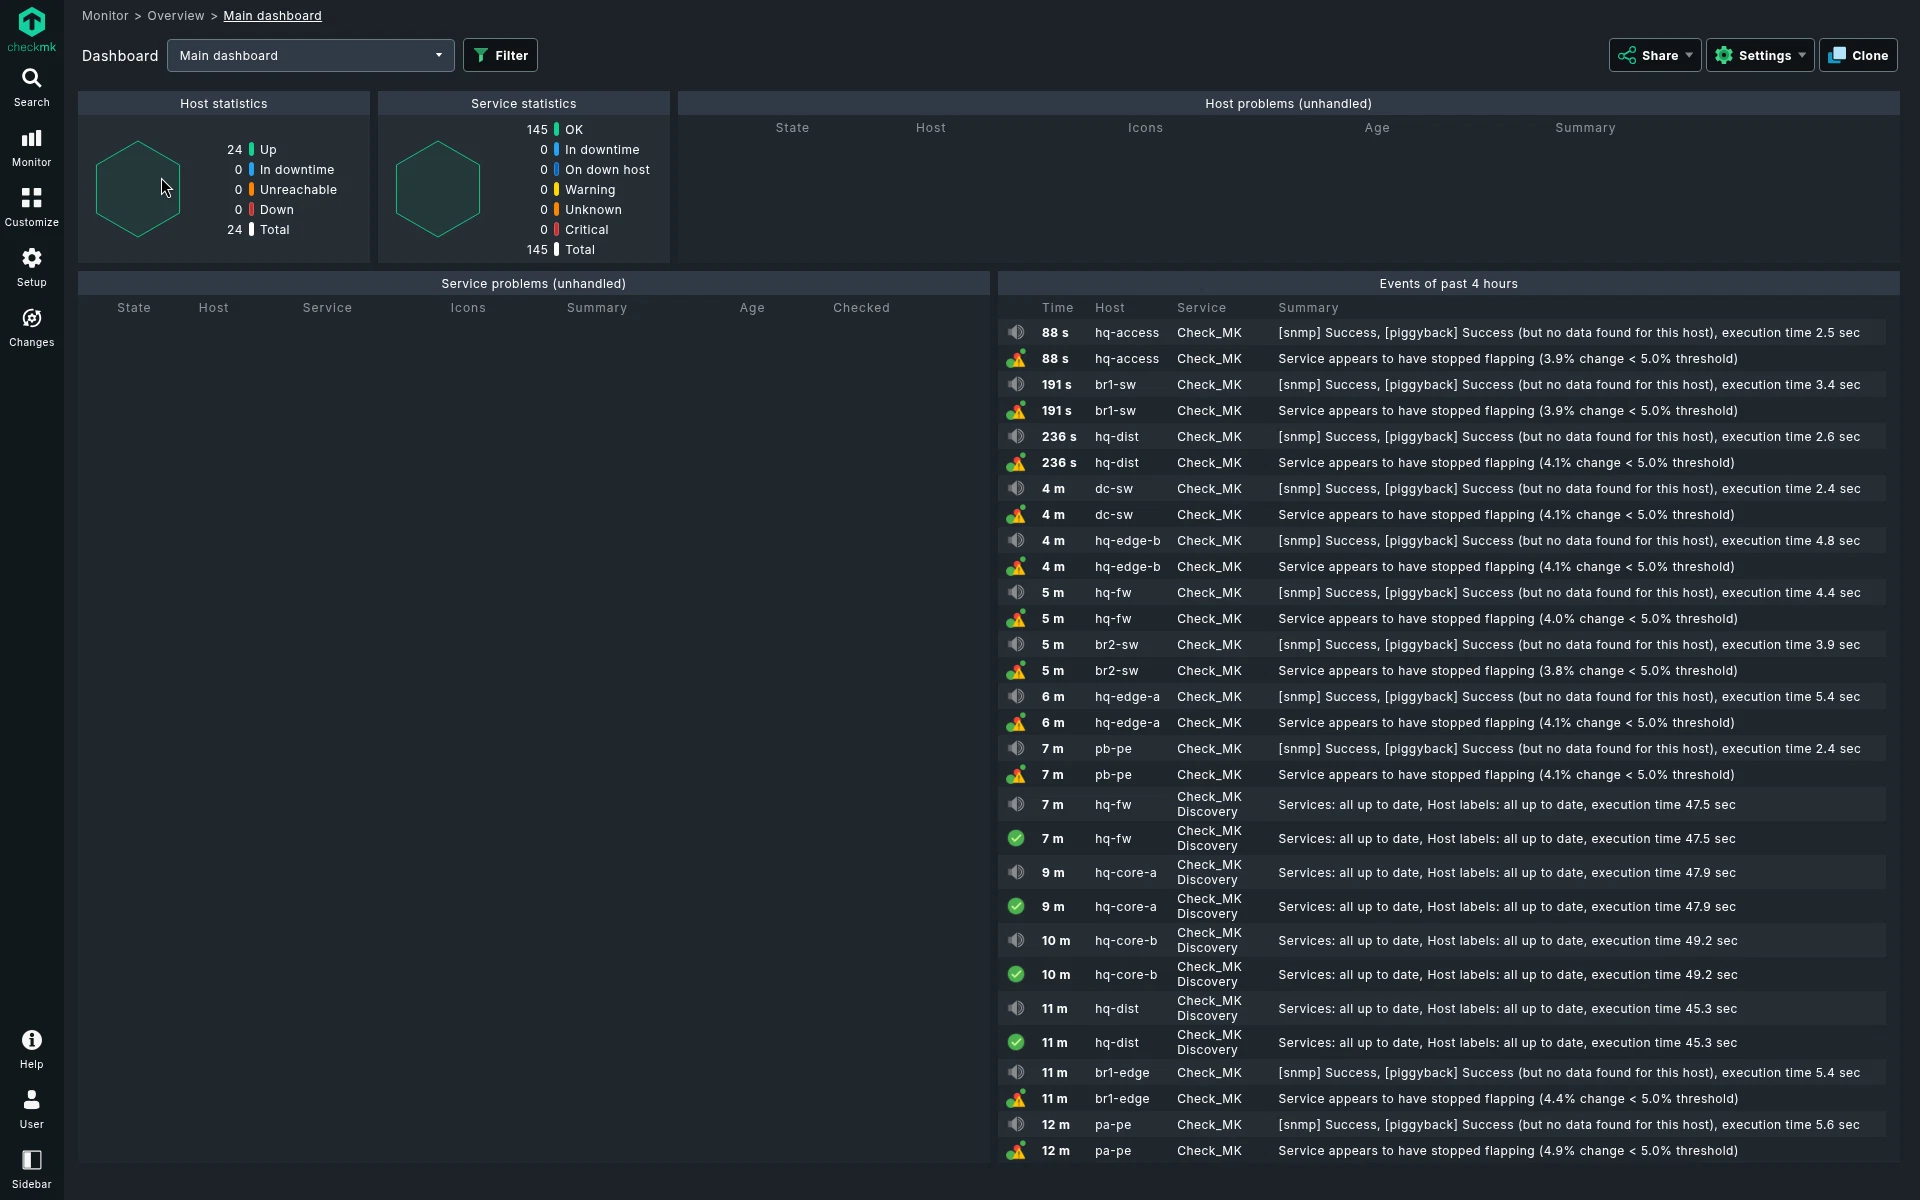
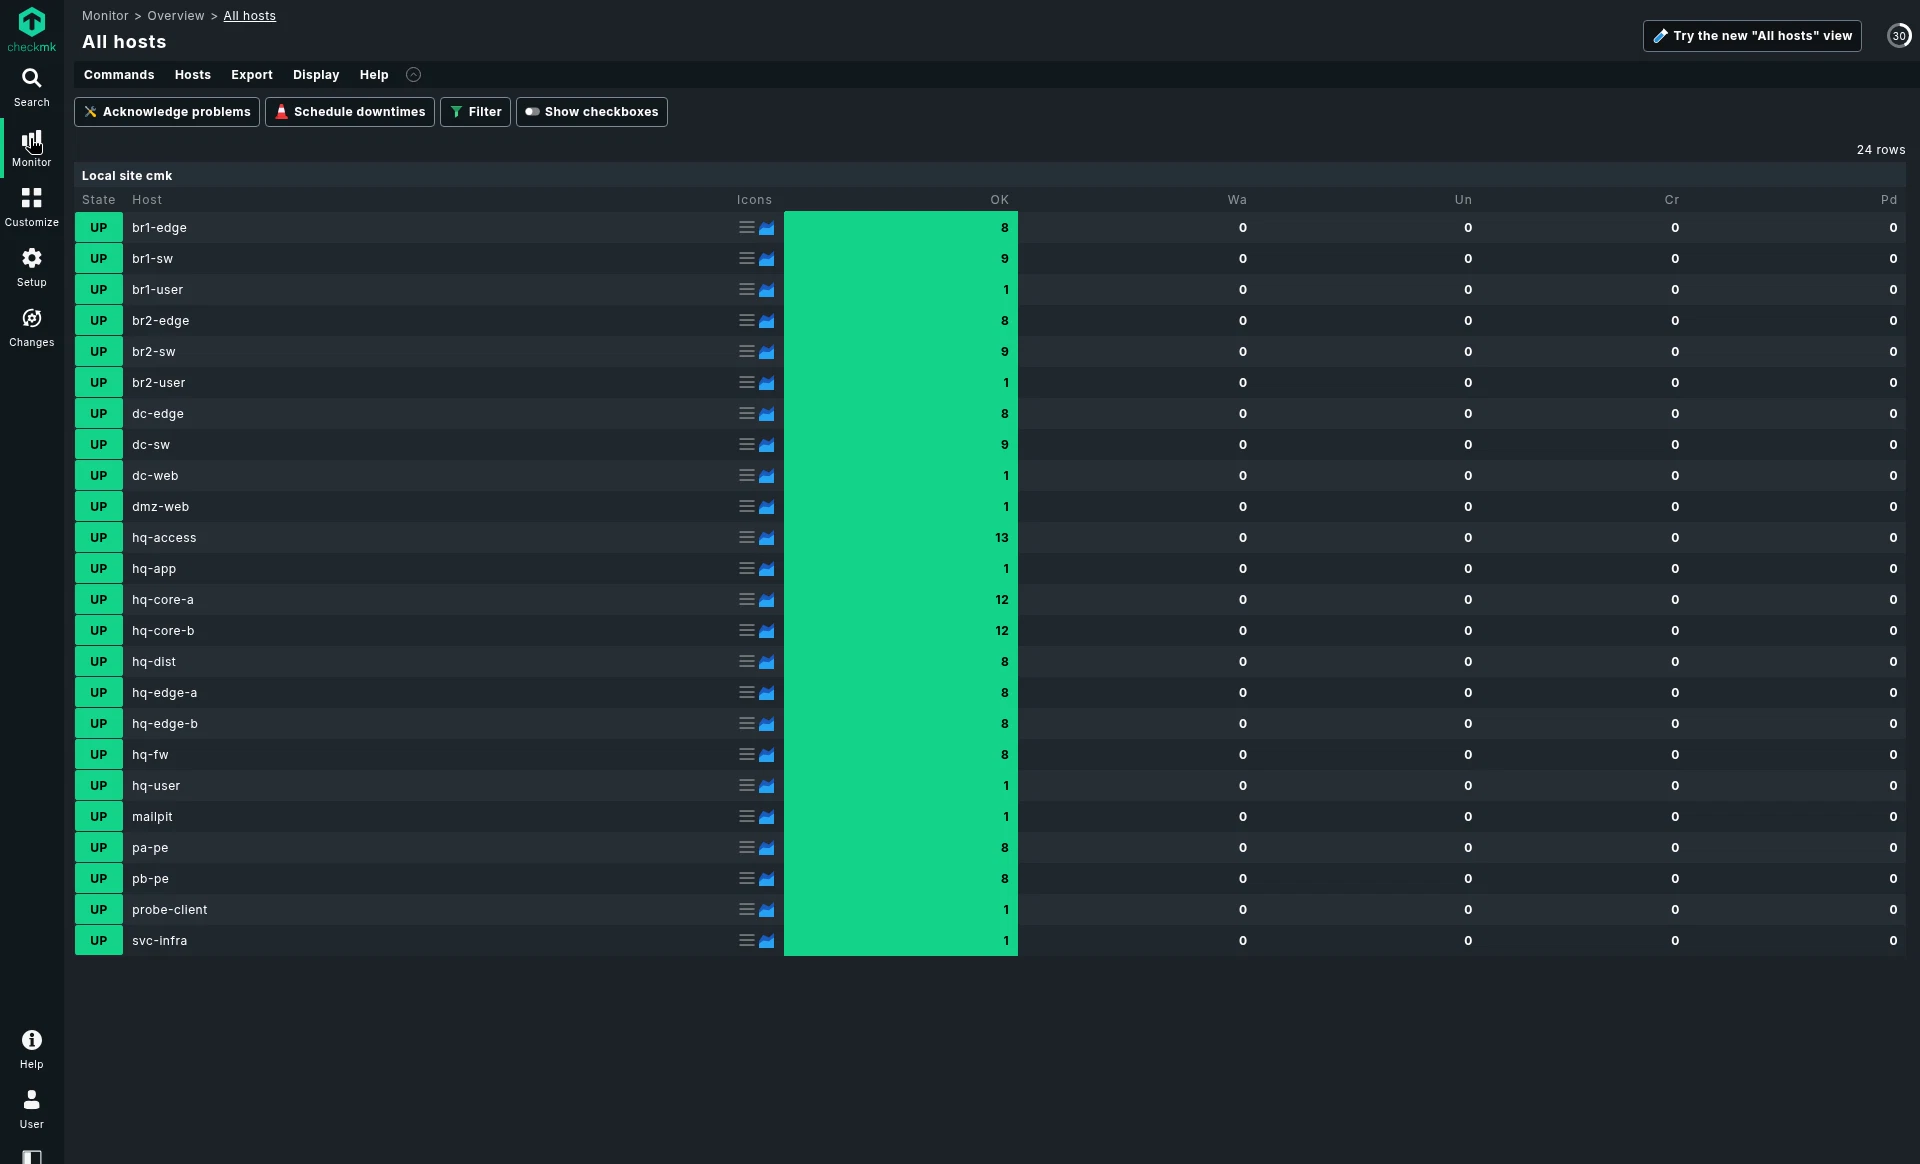
I did not connect an external model vendor. The agent loop here is structured intent, REST calls, and recorded results. A generic CLI --approve script that never called the API would not count.
A short traffic test, not a trend
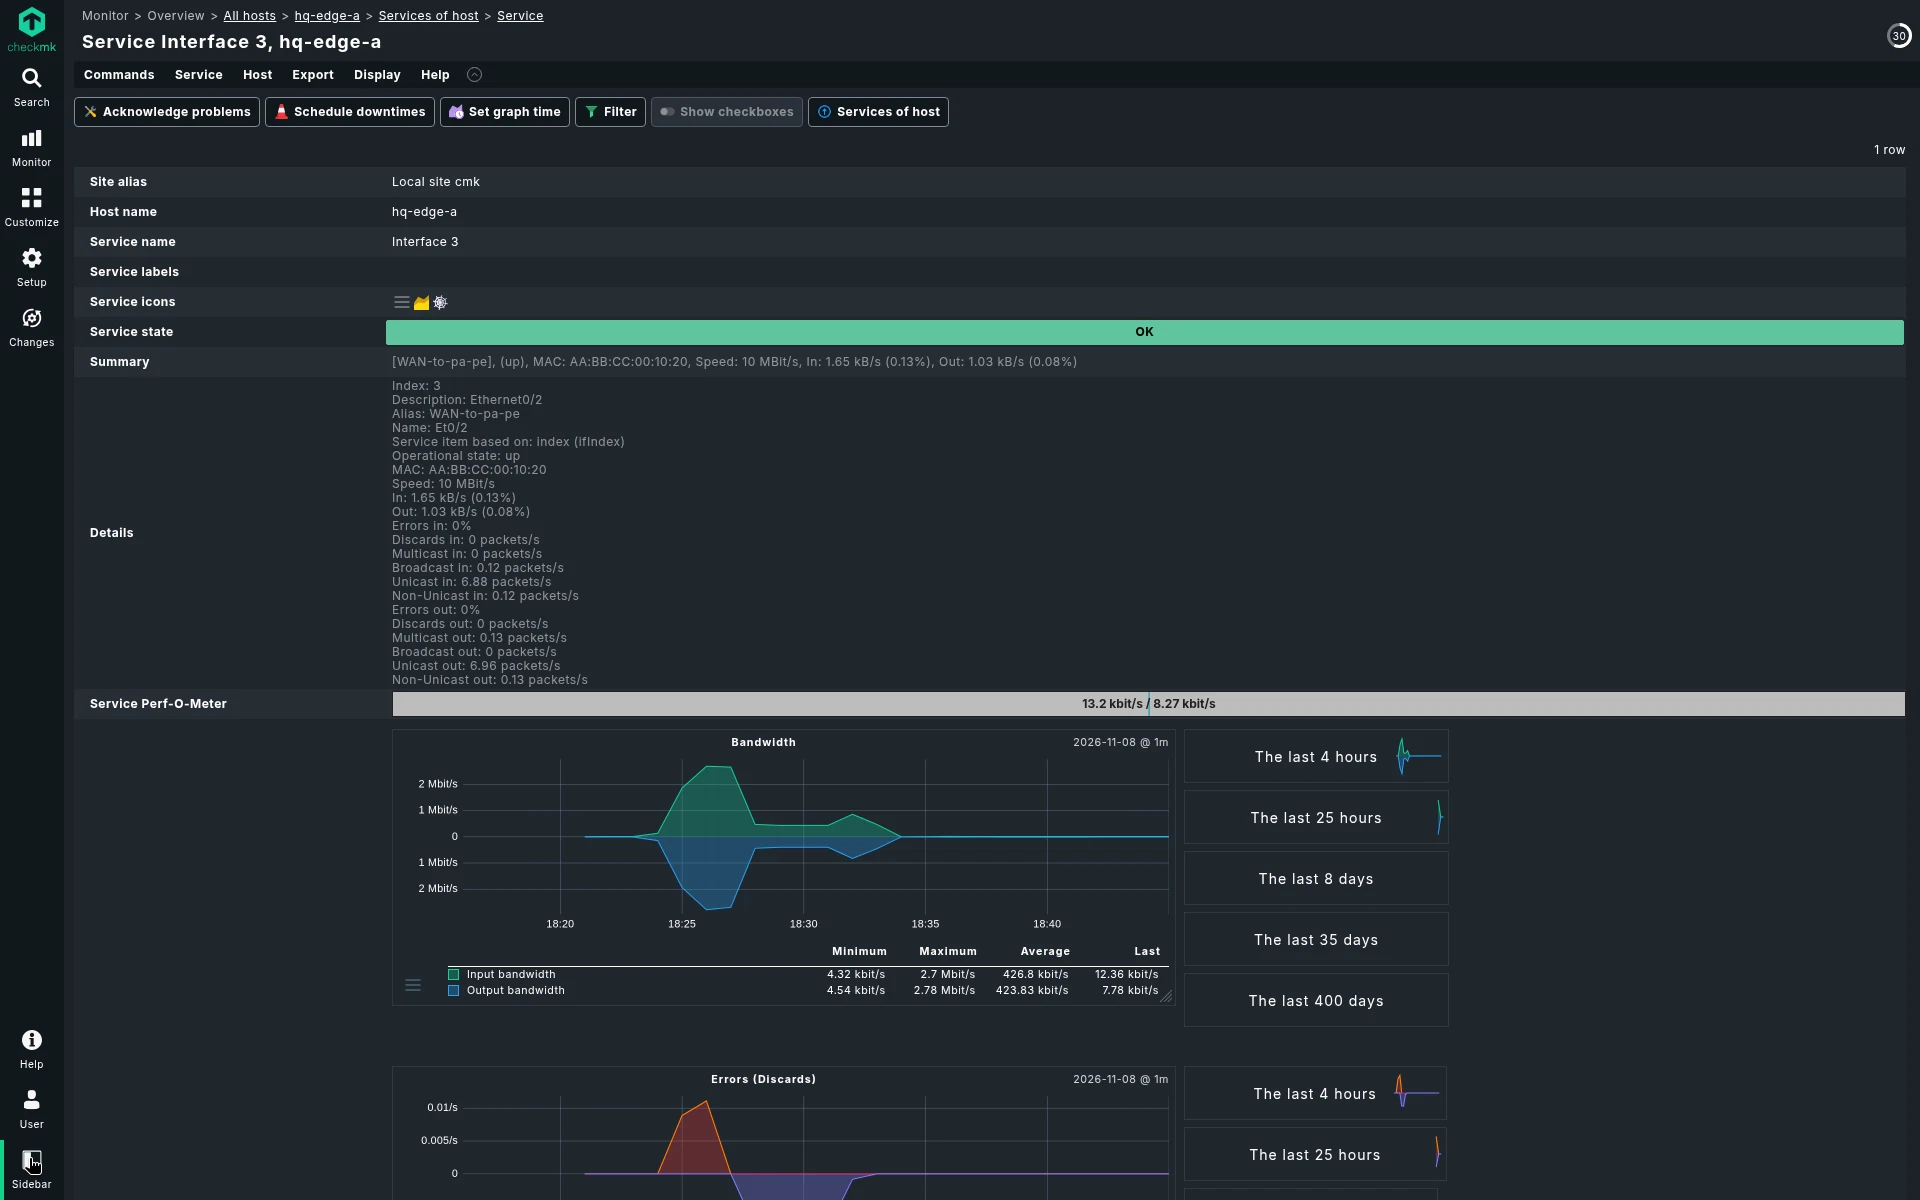
Checkmk's service interval on this site is one minute. To put visible samples on Interface 3 without waiting a day, I sent a bounded ICMP load along a lab path that crosses provider A: from a branch user endpoint to the data-center web endpoint.
The offered load was ping at a 4 ms interval with a 1400-byte payload, about 250 packets per second, or about 2.8 Mbps one way. Echo replies returned on the same path. The discovered interface speed is 10 Mbps, so the offer stayed under the link rate. Traffic stayed on lab endpoints. This is not a 24-hour baseline and not a capacity certification.
Phases, in America/Los_Angeles on November 8, 2026:
- Baseline, no extra traffic: 6:22:12 PM to 6:25:13 PM (three minutes)
- Load: starting 6:25:13 PM
- First provider-A shutdown during that load: 6:28:25 PM, restored 6:31:44 PM
- Load ended around 6:32 PM to 6:34 PM, then idle
Livestatus samples on Interface 3 during or just after the load interval showed about 54.6 kB/s in (4.37% of 10 Mbps) and later about 114 kB/s in (9.09%). After recovery the same service showed 541 B/s (0.04%) at 6:35:36 PM. Read those numbers as a short controlled test.
What broke when provider A went down
I shut interface Ethernet0/2 on the HQ edge router, the same reversible provider-A failure used in the Zabbix article. The router stayed reachable at Loopback0.
The first attempt ran while the ICMP load was still on. IOS immediately showed Ethernet0/2 is administratively down, line protocol is down. Ping to Loopback0 stayed at 0% loss. The branch still reached the data center at 0% loss, and traceroute moved onto provider B. That is the routing lesson: a preferred WAN failure should look like a link down, not a dead site, when you have an alternate provider and you poll a loopback.
Checkmk did not refresh Interface 3 during that first window. The Check_MK helper, the service that fetches SNMP for the host, went CRITICAL at 6:29:36 PM with (Service Check Timed Out) after a 60 second execution. Interface 3's last check stayed at 6:28:00 PM, just before the shutdown. I restored the link at 6:31:44 PM rather than leave the WAN down while the helper was stuck.
After the flood stopped and the helper returned to [snmp] Success, I repeated the shutdown without extra traffic. IOS was administratively down at 6:33:51 PM. Loopback0 and the branch path stayed up, again over provider B.
At 6:34:27 PM, Interface 3 went state 2 (CRITICAL) with [WAN-to-pa-pe], (down)(!!). That is 38 seconds after the shutdown finished at 6:33:49 PM, on the natural one-minute cycle. I did not force a reschedule to create that first detection.
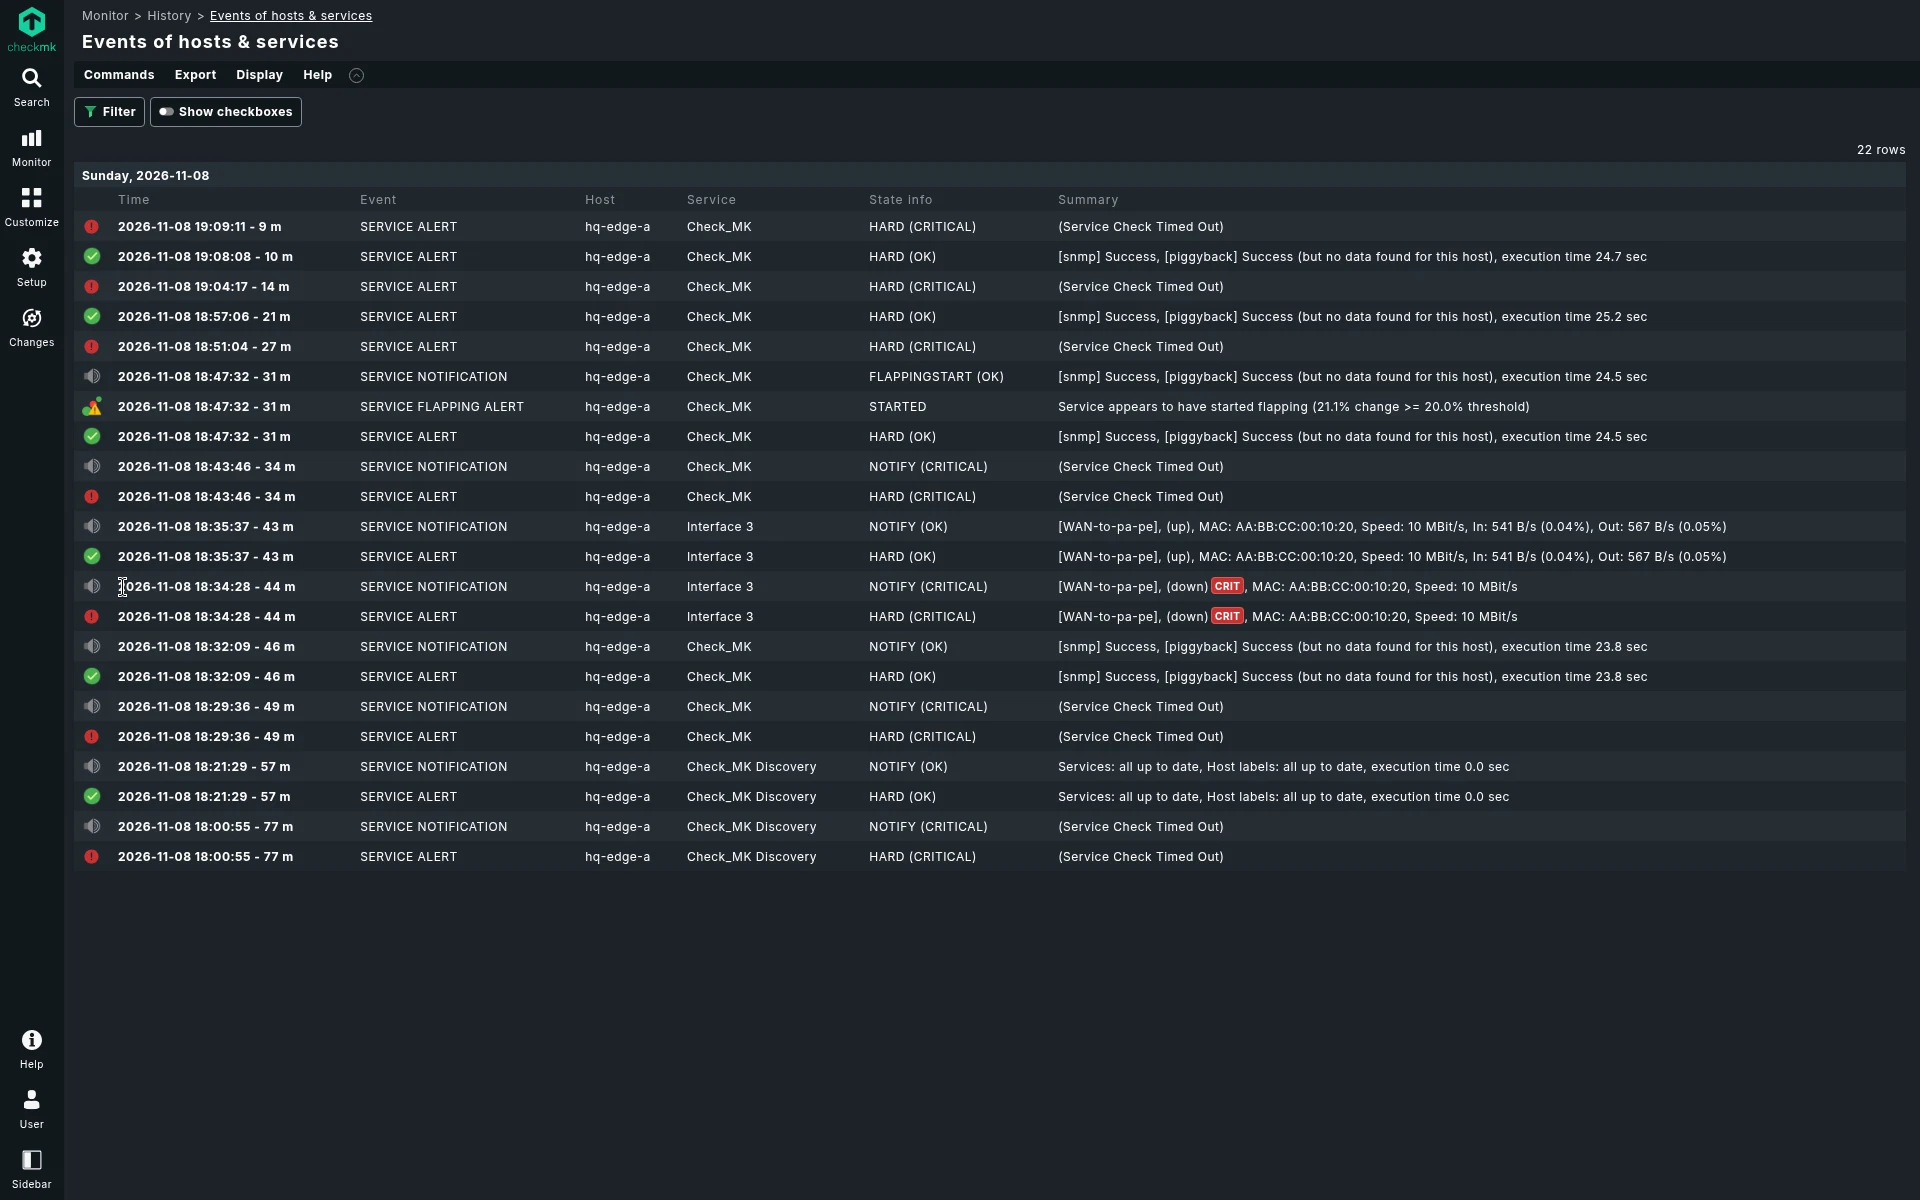
I issued no shutdown at 6:34:33 PM. IOS showed Ethernet0/2 is up, line protocol is up at 6:34:35 PM. Checkmk returned Interface 3 to OK at 6:35:36 PM with [WAN-to-pa-pe], (up) and idle rates around 541 B/s in and 567 B/s out.
Gotchas
HTTP 400 on SNMP protocols. The REST API wants SHA-1-96 and AES-128, not SHA and AES. The error body lists the allowed enums.
Official MCP is not in Community. If a tutorial says "hand over the keys" and then creates an automation user, you are looking at REST. Official MCP is commercial, experimental, and read-only.
Empty discovery after <code>fix_all</code>. If the discovery table is empty, fix_all can persist nothing. Refresh until SNMP services appear, then activate.
Interface 3 is Et0/2. Default inventory used ifIndex. Trust ifAlias WAN-to-pa-pe in the plugin output.
The helper can time out before the interface check moves. Under the ICMP load, Check_MK hit (Service Check Timed Out) and Interface 3 kept a pre-failure last-check time. Livestatus on the helper is the first place to look if a WAN check seems frozen. Polling Loopback0 still proved the router was up.
Factory Nagios limits are tight for SNMPv3 on these IOS-XE boxes. Community uses the Nagios core, so the commercial "maximum concurrent Checkmk fetchers/checkers" sliders are not in this edition. Factory service_check_timeout is 60 seconds and max_concurrent_checks is unlimited (0). Periodic service discovery was already at the default 120 minutes and did not need a change. A serialized Check_MK SNMPv3 fetch here finishes in about 2 to 5 seconds, but overlapping fetches take 21–26 seconds, and a Check_MK Discovery pass can take 45–52 seconds. When every helper starts together they hit the 60 second cap, go CRITICAL with (Service Check Timed Out), and the interface services go stale. I set service_check_timeout=120 in the site's etc/nagios/nagios.d/tuning.cfg and max_concurrent_checks=4 in etc/nagios/nagios.d/timing.cfg, then restarted Nagios. The overview went from 23 unhandled problems and 55 stale services to 0 unhandled and 0 stale (145 services, all Check_MK helpers [snmp] Success). The load-test timeout above is unchanged: extra ICMP on the 10 Mbps handoff still pushed a helper to a 60.07 second execution against that factory 60 second cap at 6:29:36 PM.
Access-switch SNMPv3 may not match the routers. The four access switches run the Layer 2 IOS-XE image. From the same poller, sysDescr over SNMPv3 authPriv timed out (Timeout: No Response). The same walk over authNoPriv succeeded and identified X86_64BI_LINUX_L2-ADVENTERPRISEK9-M, version 17.18.2. The routers are the opposite: authPriv works and authNoPriv returns authorizationError (access denied to that object). I did not weaken the shared device config. The Checkmk host attribute on those four switches was changed from v3_auth_privacy (SHA-1-96 plus AES-128) to v3_auth_no_privacy (SHA-1-96 only). The REST and CLI error text before the fix was Cannot fetch system description OID .1.3.6.1.2.1.1.1.0.
FAQ
Can an AI agent add hosts on the free edition? Yes, through the REST API and an automation user, after you activate changes. That is not official MCP.
Should that user be a full administrator? No. Clone a least-privilege role that can manage hosts, discover services, and activate changes. Keep user administration and global settings off the token an agent holds.
Why poll Loopback0? If you poll a WAN interface address, shutting that WAN also drops management. The first Zabbix run on this fabric made that mistake. Loopback0 stays up so Interface 3 can go down on its own.
Why didn't the first shutdown change Interface 3? The SNMP helper timed out at 60 seconds while extra traffic was on the path. The interface subchecks reuse that helper fetch. After the helper recovered, the next natural check reported (down)(!!) in 38 seconds.
Is the traffic graph a daily baseline? No. It is a few minutes of idle, a capped ICMP offer of about 2.8 Mbps one way, two short shutdowns, and idle again, polled once a minute.
Did the branch go down with provider A? No. ICMP to the data center stayed at 0% loss and traceroute used provider B.
This post does not cover Checkmk Pro or Ultimate, the official MCP server, Slack or ticket notifications, Docker piggyback, and it is not a ranking against Zabbix, Cacti, or Nagios.
What breaks, and what I would do next
A WAN check that depends on a single SNMP helper will go stale if that helper times out, even when the router is reachable on a loopback. Extra traffic on a 10 Mbps lab handoff was enough to push this helper into a 60 second timeout. The interface check itself is sound: once the helper ran on schedule, Interface 3 tracked Et0/2 down and back up on the one-minute cycle.
- Community's useful AI hook is REST plus an automation user, not official MCP.
- Give that user host and discovery rights, then require an explicit activate step.
- Poll loopbacks so a provider failure shows up as Interface 3 (or whatever name maps to Et0/2), not as a dead router.
- If a WAN service looks frozen, check the Check_MK helper for
(Service Check Timed Out)before you distrust SNMP.
The same provider-A Et0/2 test is already documented for Zabbix, Cacti, and Nagios Core. Use those when you want the matching SNMP-graph and service-check views of this fabric.