
If you attach Zabbix to a campus-and-branch network, the first question is not whether a Cisco template exists. It is which items return a real value, and what a WAN failure looks like once you poll an address that survives the failed link.
This write-up is from Zabbix 7.0.32 LTS, built in my home lab on November 7, 2026. I used the official "Cisco IOS by SNMP" template plus ICMP ping and a few HTTP, SMTP, and NTP simple checks. It complements the existing Zabbix for Network Monitoring series instead of repeating the SNMPv3, Agent 2, and trigger walkthroughs there.
Zabbix 8.0.0 LTS shipped on November 5, 2026. I stayed on 7.0.32 so this lab matches the LTS line already used in that series.
The network I monitored
The lab is a small multi-site design: an HQ campus with a redundant core, a data center, two branches, and two WAN providers. Provider A is the preferred path. Provider B is the backup.
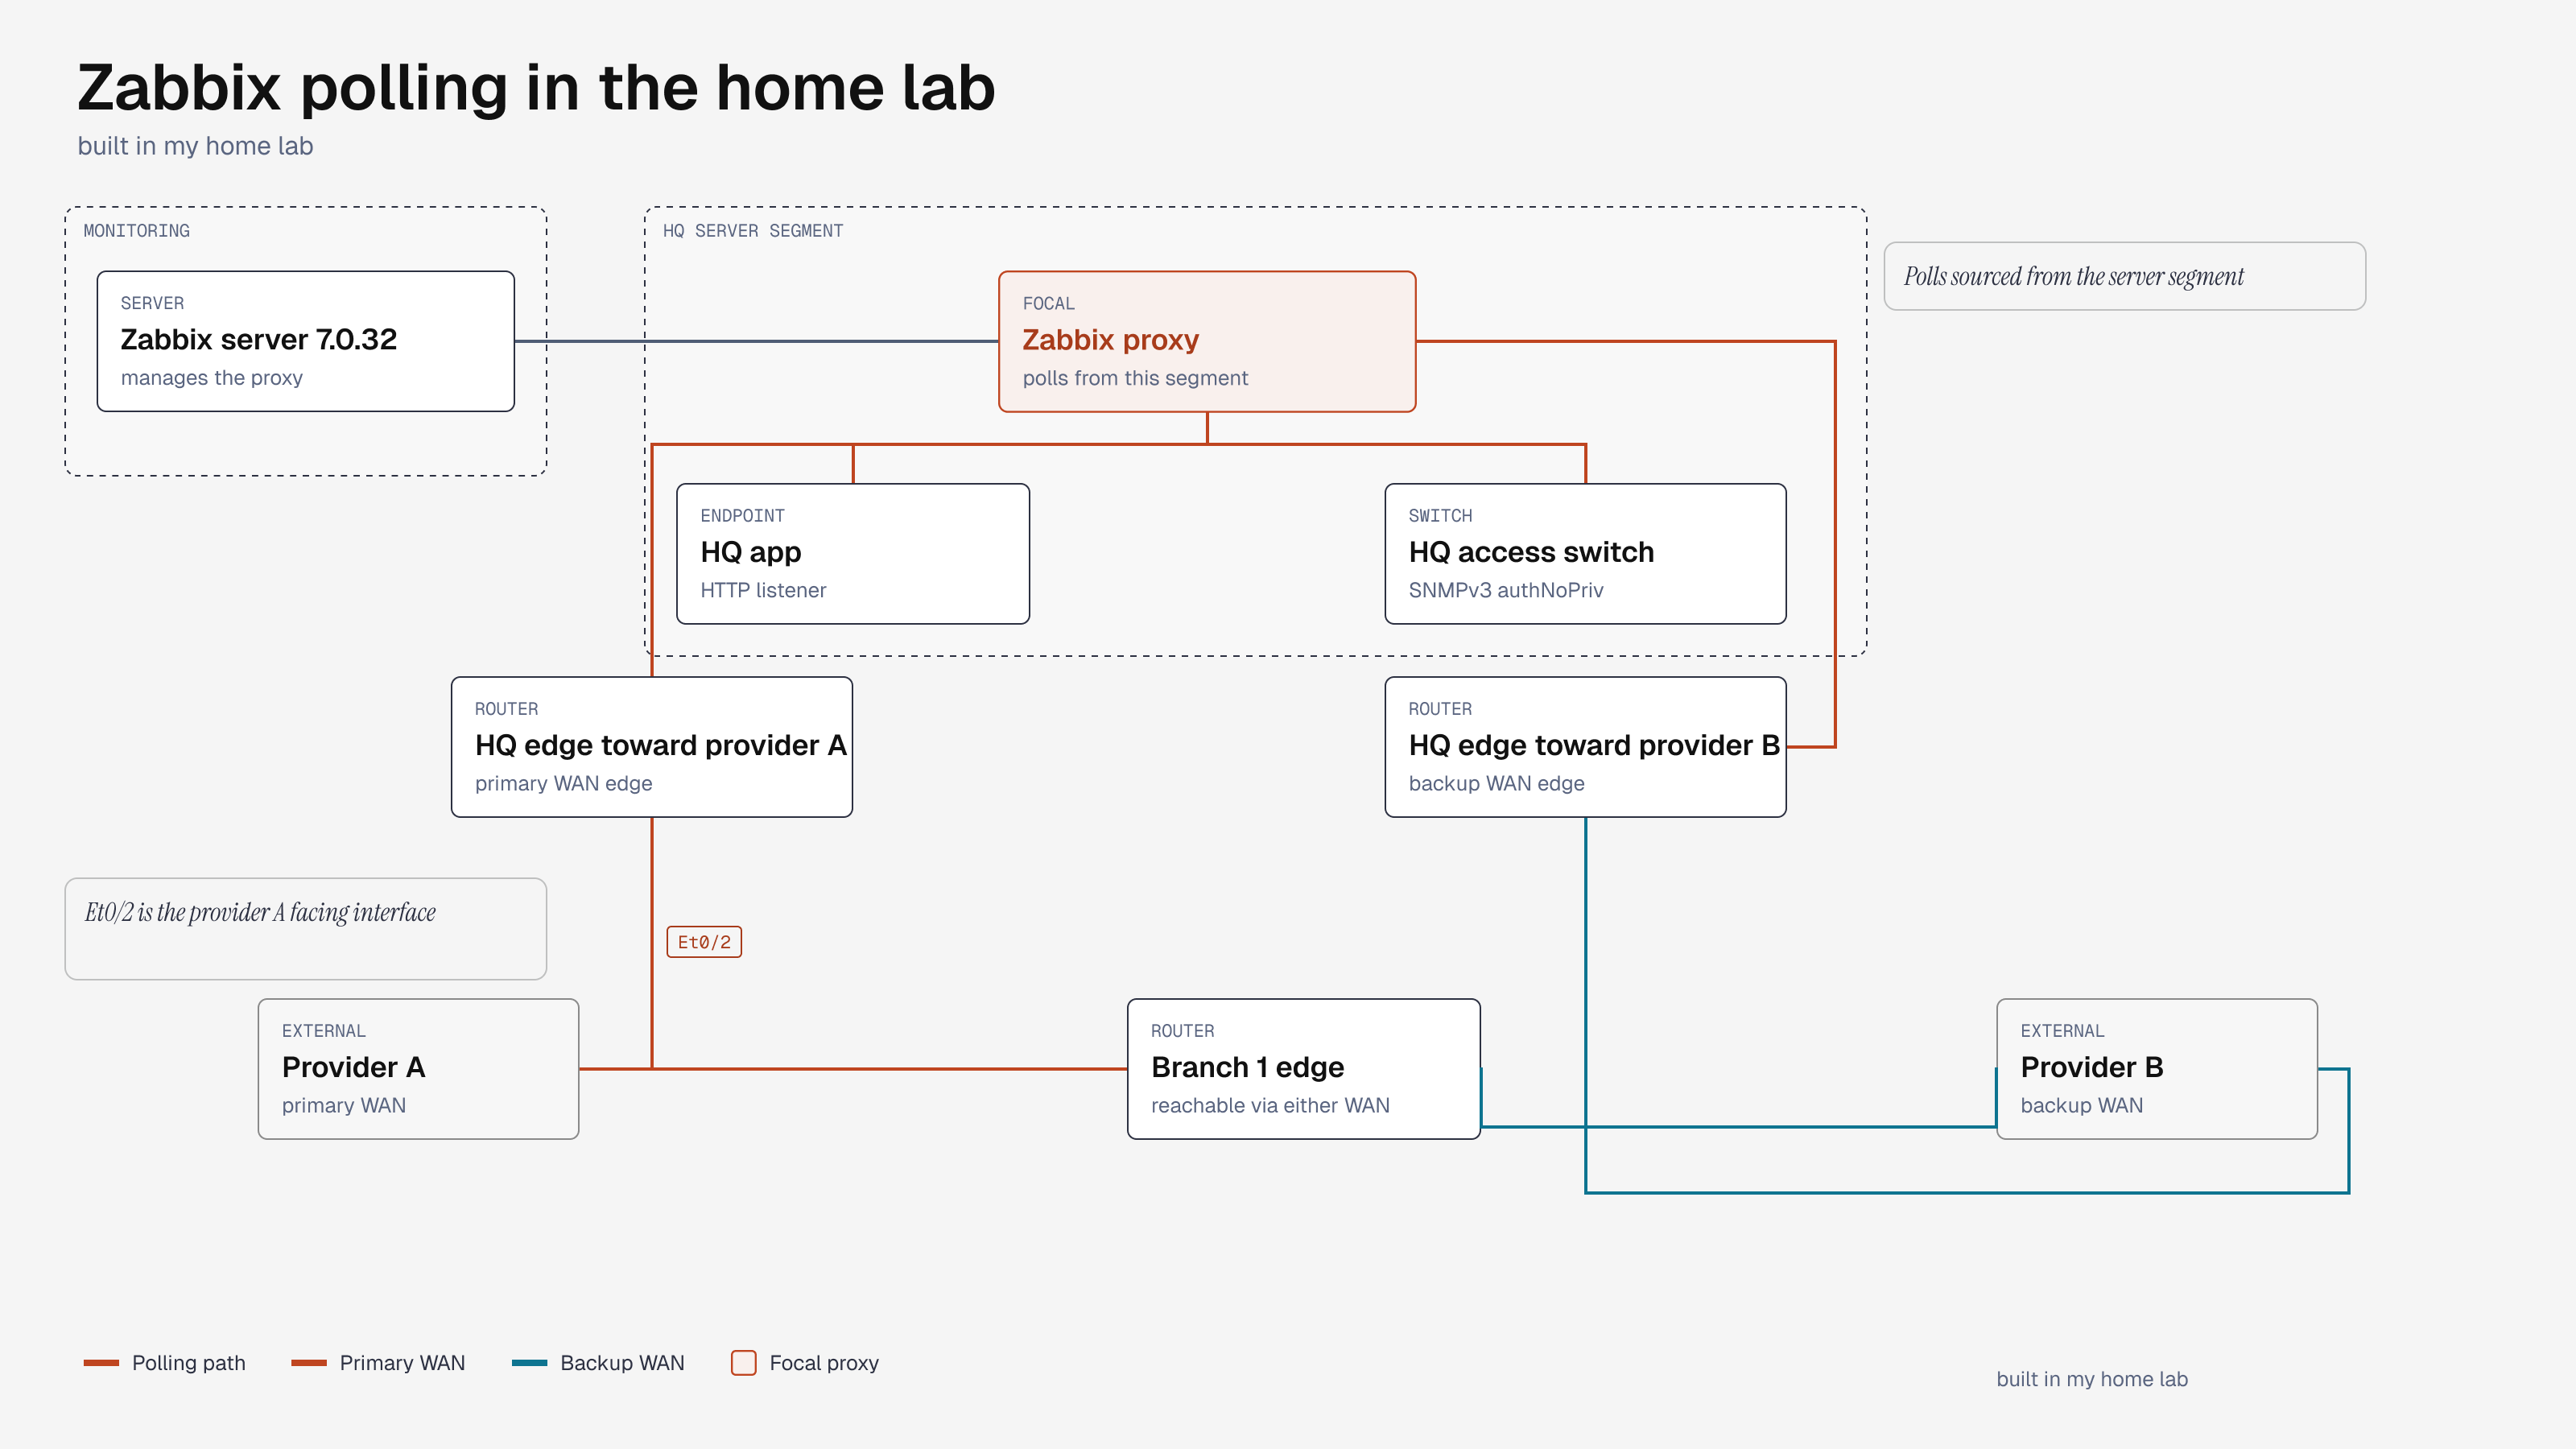
I onboarded 15 Cisco IOS-XE 17.18.2 devices with SNMPv3 and 9 Linux endpoints with ICMP. Three of those endpoints also answer HTTP. One answers SMTP on a local mail sink, and one answers NTP. That is 24 monitored lab hosts. The Data collection Hosts page also listed the default "Zabbix server" host, which I disabled, for 25 rows in the full list.
The poller that talks to the devices runs inside the server segment, so SNMP and ICMP come from a lab data-plane address. I first used a data-plane address on each Layer 3 device's WAN or transit interface. After an early test showed that shutting the provider A link also dropped ICMP and SNMP to that HQ edge router, I pointed every Layer 3 host at its Loopback0 address instead. A ping from the poller to each of those 11 loopbacks succeeded before I changed the Zabbix interfaces.
I set history retention to 7 days and trend retention to 30 days.
The default "Zabbix server" host ships with "Linux by Zabbix agent" and "Zabbix server health." This isolated instance has no agent, so that host raised "Linux: Zabbix agent is not available (for 3m)." I disabled the host and closed that event. It is not an outage on the lab network.
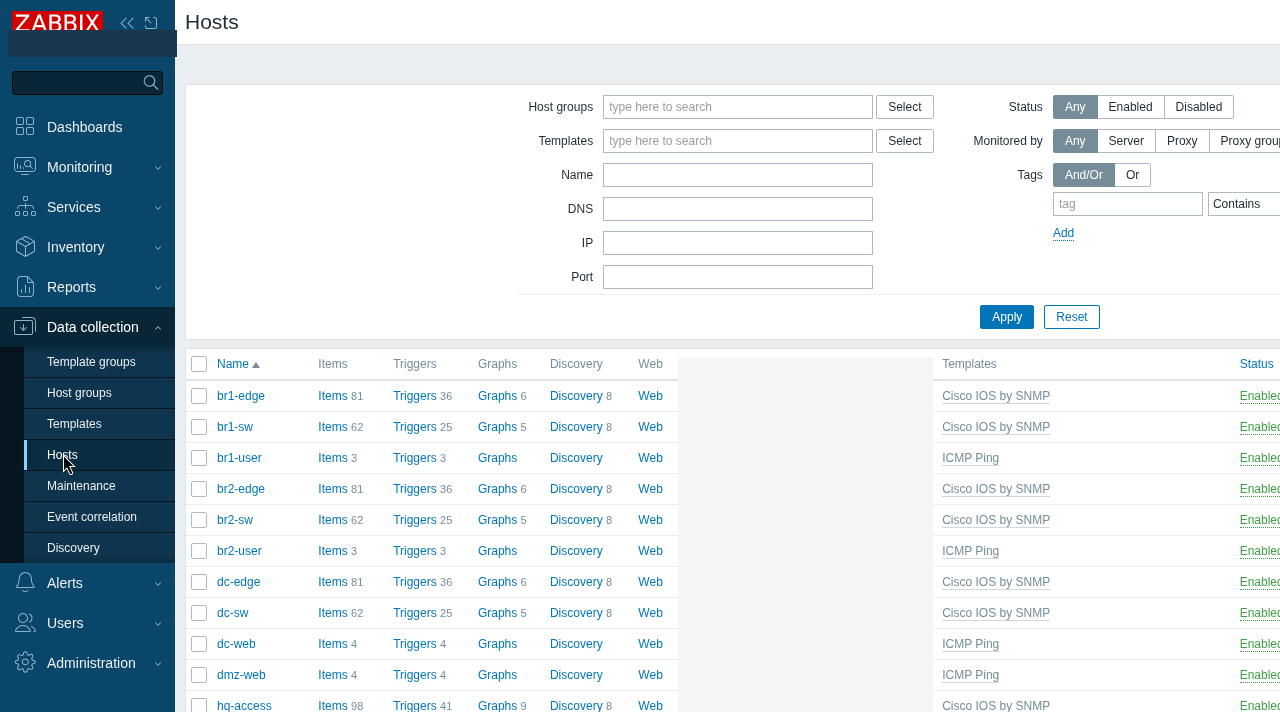
What collected cleanly
After poll cycles and the later fixes, the API showed:
- ICMP
icmpping= 1 on all 24 lab hosts, including a recheck after the loopback change and the link test. - A System description value on all 15 Cisco devices. Each one reported Cisco IOS-XE 17.18.2. The routers identified as the standard IOS-XE software image. The four access switches identified as the Layer 2 IOS-XE image.
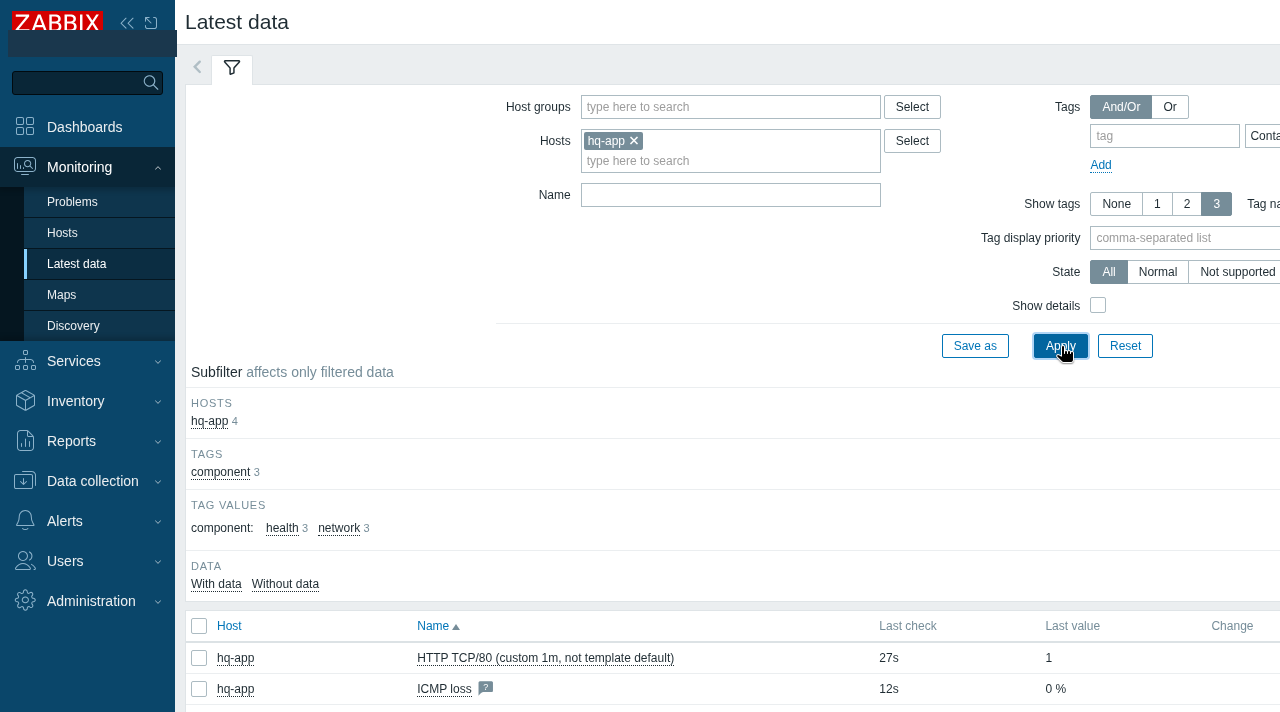
- Simple checks at 1 (service up) for the HQ app HTTP listener, the data-center web listener, the DMZ web listener, the local SMTP sink, and the NTP listener.
- Discovered
ifHCInOctetsand operational-status items on all 15 Cisco devices after the interface-name filter was corrected. The HQ edge router toward provider A has an item named likeInterface Et0/2: Bits receivedwith a nonzero value (7728 at the discovery check). HQ core A showed nonzero inbound octets on its core and distribution links as well.
I used authPriv (SHA and AES-128) for SNMPv3 on the Layer 3 devices. The four access switches in this software image accept an SNMPv3 group at the auth level and reject priv. Those four hosts use authNoPriv. After that change, the earlier "No SNMP data collection" problems on the switches cleared.
What the Cisco template did not give me
Attaching "Cisco IOS by SNMP" does not mean every item in that template works on these devices.
Hardware model name and hardware serial number stayed unsupported on all 15 Cisco devices, with the SNMP error "No Such Object available on this agent at this OID." These are virtual lab devices. I am not treating those items as inventory.
Interface names in SNMP are short, such as Et0/2 and Lo0, not Ethernet0/2 and Loopback0. A host macro set to ^(Ethernet|Loopback) matches none of them. The official template default for {$NET.IF.IFNAME.MATCHES} is ^.*$. The access switches inherited that default and discovered interfaces first. The routers had the stricter host override, so they had no discovered interface items until I changed the host macro to ^(Et|Ethernet|Lo|Loopback).
The master item net.if.walk stores no history (history=0), so its last clock stays 0 even when discovery is working. That empty last value is not proof the walk failed. A direct ifName walk from the poller against the HQ edge loopback returned 6 names in 0.29 seconds.
I also created a labeled non-default item on the HQ edge router toward provider A, demo.ifOperStatus[Et0.2], OID 1.3.6.1.2.1.2.2.1.8.3, with a 30 second interval, so I could test link state before template discovery filled in. After discovery succeeded, the template also created operational-status items for Et0/2.
The template's interface discovery rule includes a "discard unchanged with heartbeat" preprocessor of 1 hour. After I changed interface addresses and the name filter at the same time, a check-now of net.if.walk plus a 90 second wait still showed no Layer 3 interface items. A later check-now, once the loopback addresses and the new macros had been in place for several minutes, created the items on all 11 routers. The first empty result was a timing and config-sync issue, not missing SNMP.
Casebook: the HQ app HTTP listener
The HQ app host has a custom item net.tcp.service[http,<app-address>,80] with a 1 minute update interval and a trigger named "HTTP service down on hq-app (custom 1m item)." The empty-address form of that key was unsupported here. The item needed the address in the key.
I stopped the exact busybox-extras httpd process (PID 130 in this run). A client wget failed before I waited on Zabbix. I then used check-now on the HTTP item, so the times below are not a one-minute natural poll.
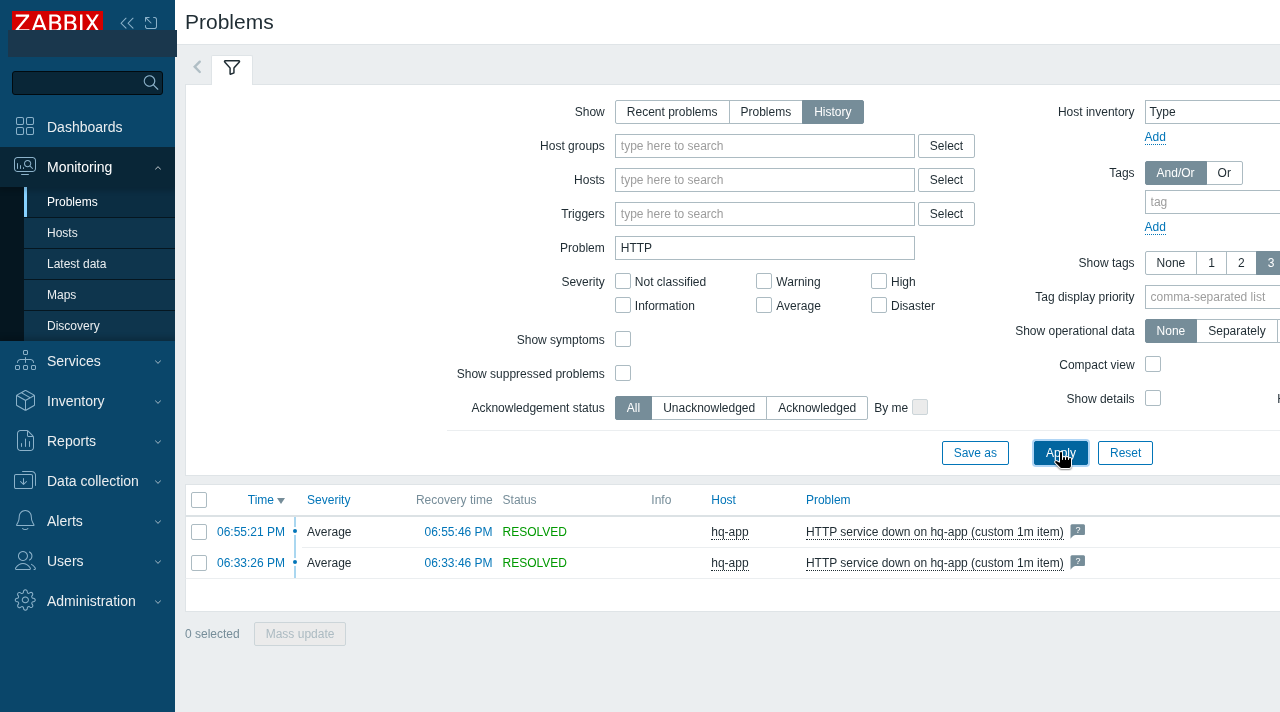
Zabbix stored last value 0 and raised the trigger at 6:55:21 PM Pacific Time on November 7, 2026 (check-now was issued at 6:55:20 PM, after wget had already failed at 6:55:18 PM). The local mail sink received a message at 6:55:22 PM with subject Problem: HTTP service down on hq-app (custom 1m item).
I restarted the same command the host had been running, busybox-extras httpd -p 80 -h /tmp/www. wget succeeded again. After another check-now, Zabbix recovered the problem at 6:55:46 PM. The sink received Resolved in 25s: HTTP service down on hq-app (custom 1m item) at 6:55:47 PM.
Casebook: a provider A link down
An earlier shutdown, while Zabbix still polled the HQ edge router at the address configured on the provider-facing interface, raised "Cisco IOS: Unavailable by ICMP ping" at 6:25:34 PM, about 2 minutes and 4 seconds after the 6:23:30 PM shutdown. Branch 1 stayed reachable (5 of 5 pings). That ICMP problem cleared at 6:27:34 PM, 38 seconds after the 6:26:56 PM restore. The interface operational-status item could not refresh, because SNMP to that same address had no path.
After I moved ICMP and SNMP for all 11 Layer 3 devices to Loopback0, I shut the same provider-facing interface again at 6:53:20 PM.
A client in HQ still reached the branch 1 user endpoint (3 of 3 pings, no loss). The poller still reached the HQ edge loopback (3 of 3 pings). I then waited 70 seconds with no check-now so the 1 minute ICMP item could poll on its own. icmpping stayed 1.
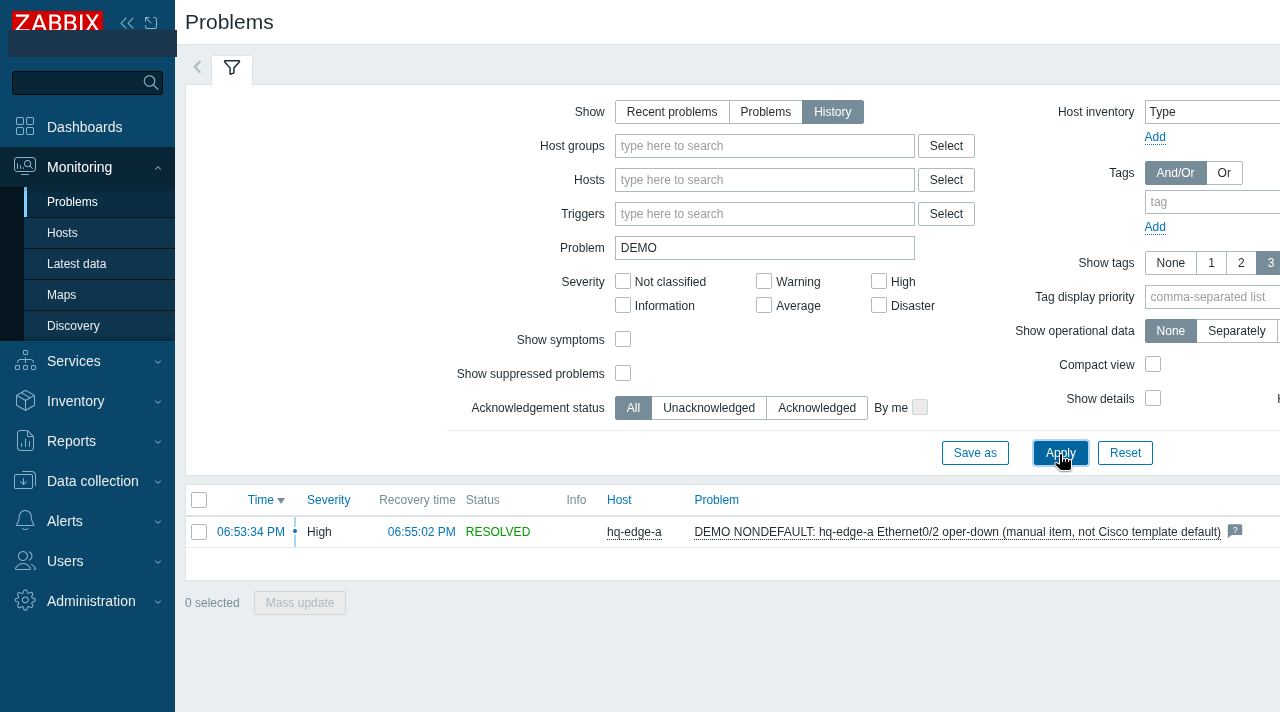
The labeled 30 second ifOperStatus item moved to 2 on its own cycle. Zabbix raised DEMO NONDEFAULT: hq-edge-a Ethernet0/2 oper-down (manual item, not Cisco template default) at 6:53:34 PM, 14 seconds after the shutdown. A later check-now at 6:54:36 PM read the same last value of 2 and is labeled as a forced refresh, not the first detection.
I restored the interface at 6:54:56 PM and issued check-now on the oper-status item. The value returned to 1, and the problem recovered at 6:55:02 PM.
After the tests
What this post does not cover
I did not run Nagios, Cacti, Icinga, OpenNMS, or PRTG on this network for this article, and I am not comparing them here.