
If you already poll a campus-and-branch network in Zabbix, Cacti answers a narrower question: can the same SNMPv3 devices produce long-lived interface traffic and status graphs from the official Cisco package.
This write-up is from Cacti 1.2.31, built in my home lab on November 8, 2026. It complements Zabbix on a multi-site enterprise lab rather than repeating that walkthrough.
The network I graphed
The lab is the same multi-site design: HQ campus, data center, two branches, and two WAN providers. Provider A is preferred. Provider B is the backup.
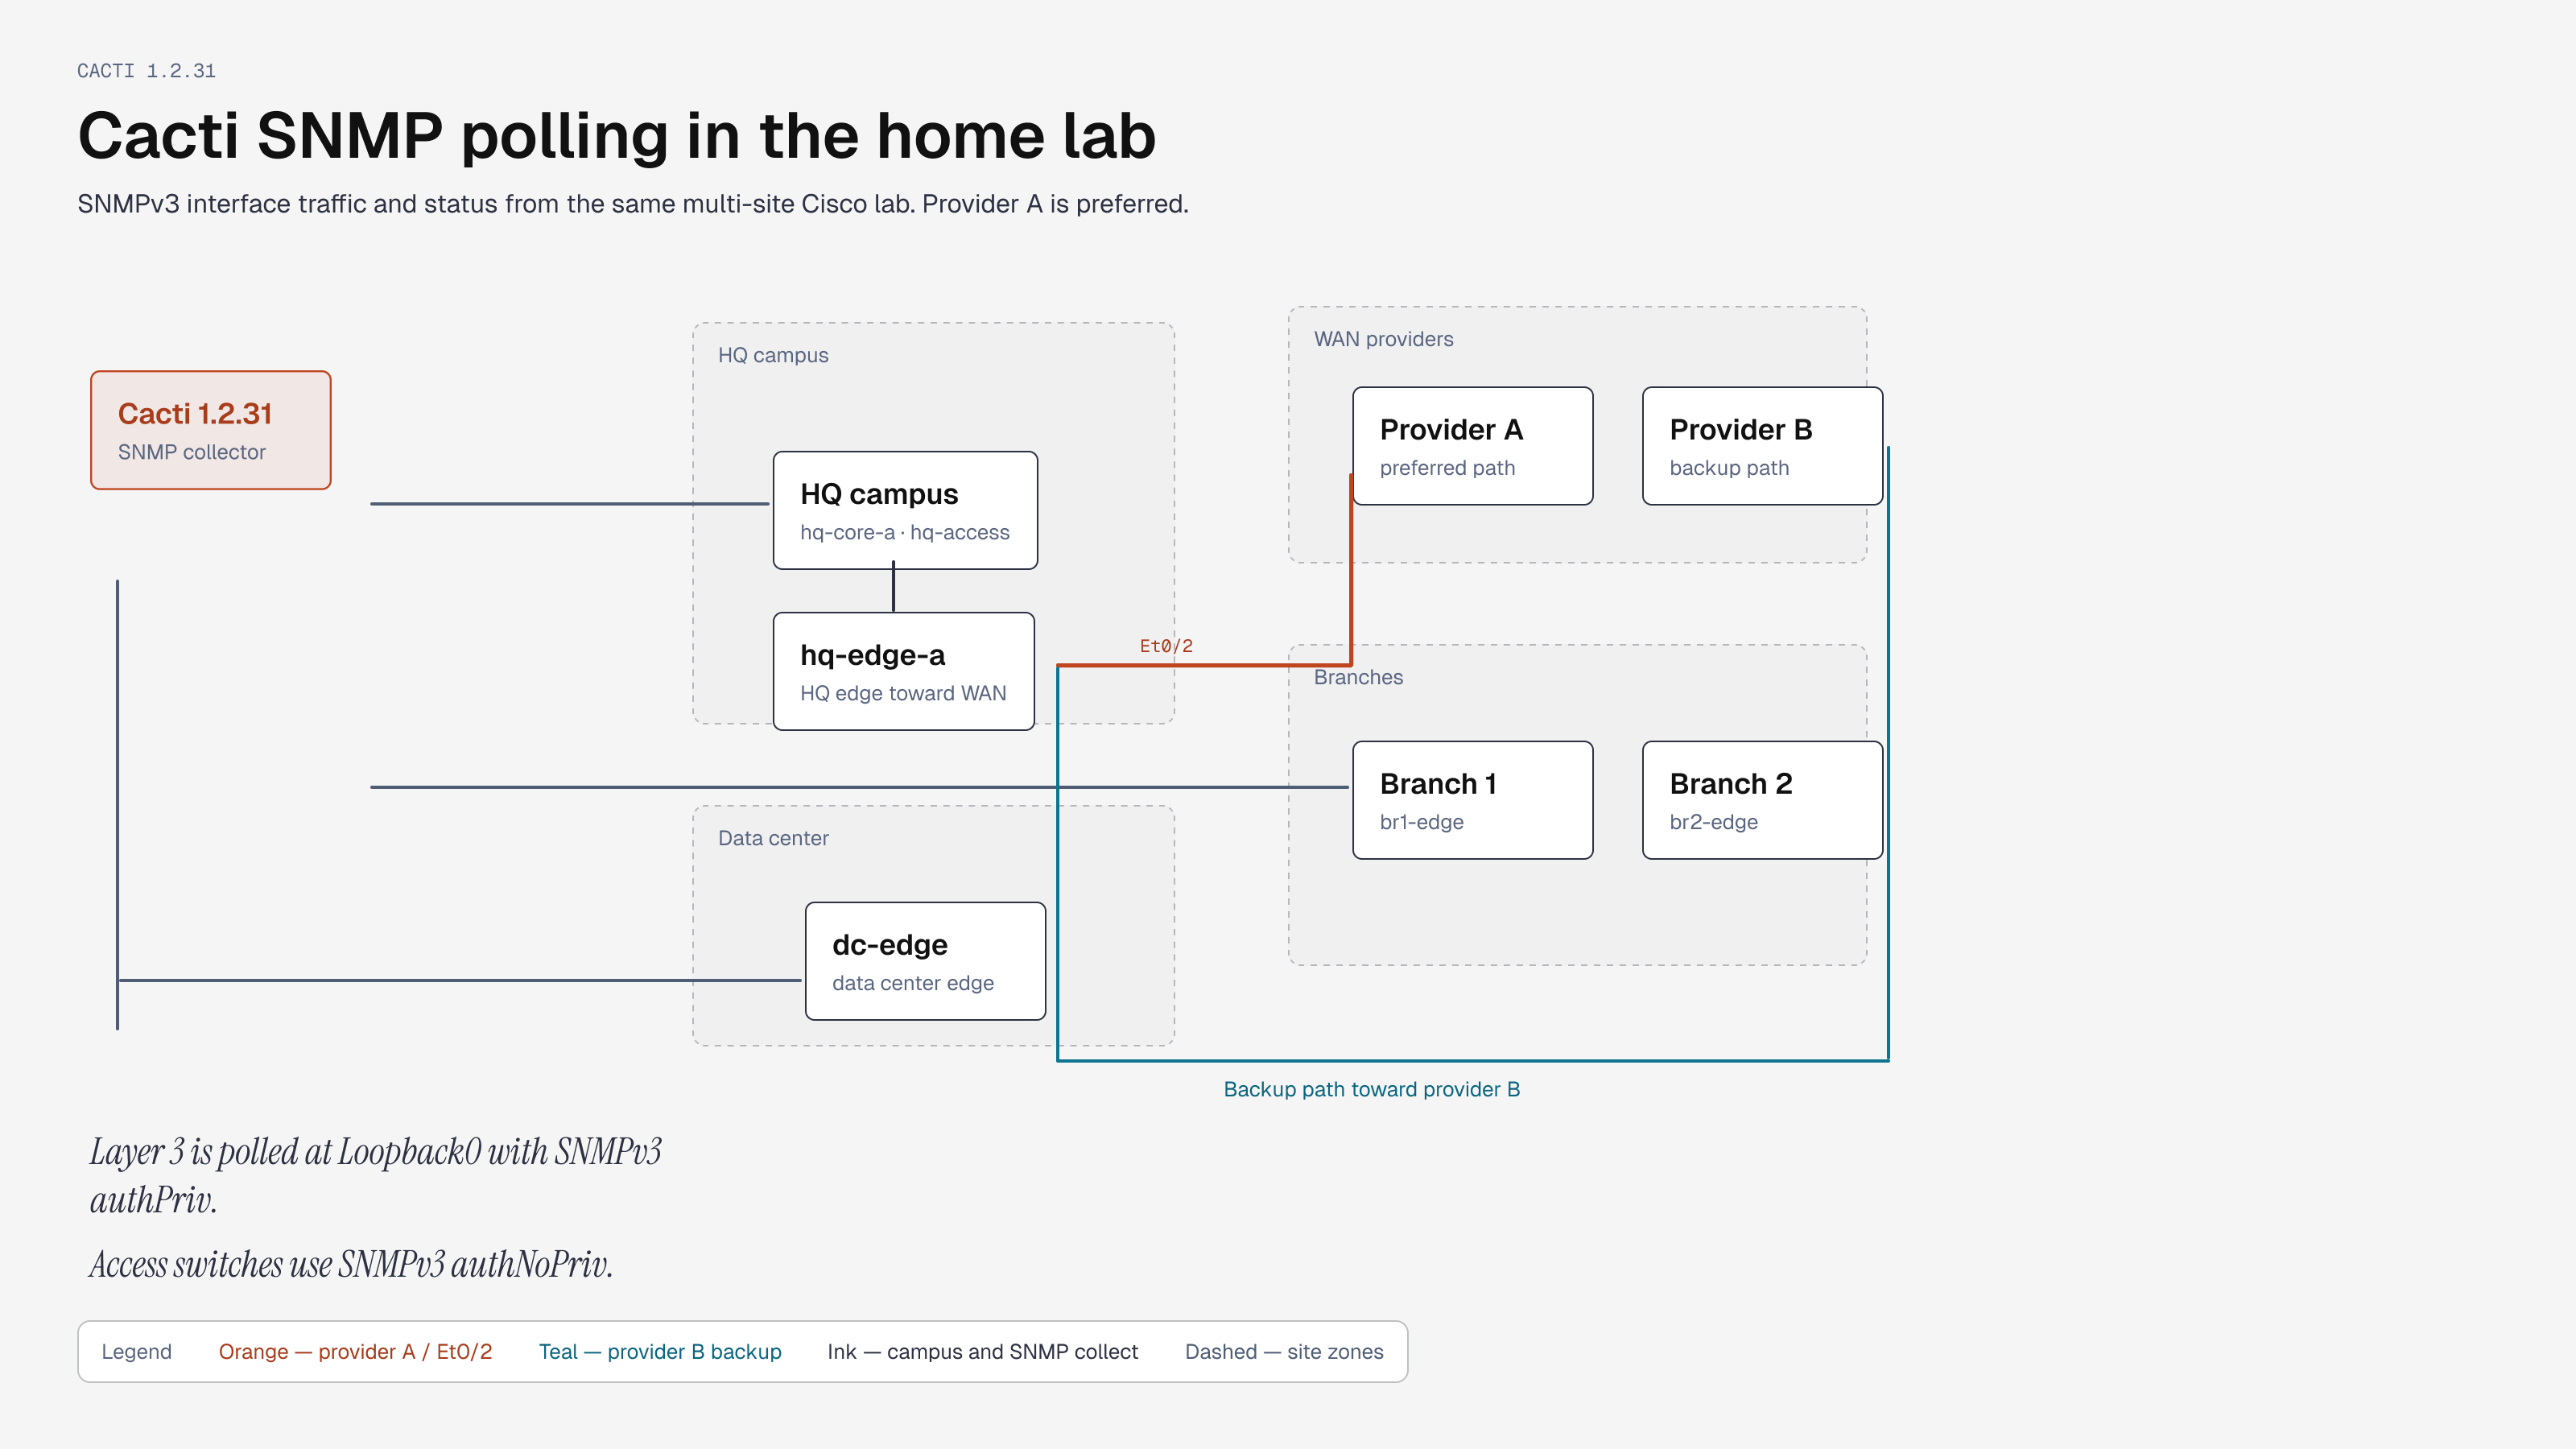
I added the 15 Cisco IOS-XE 17.18.2 devices. The 11 Layer 3 routers are polled at Loopback0 so a WAN link down is not also a management-path down. The four access switches are polled at their in-band management addresses.
Linux endpoints are not in this Cacti instance. This install only graphs SNMP. It does not run the ICMP and HTTP simple checks from the Zabbix article.
What collected
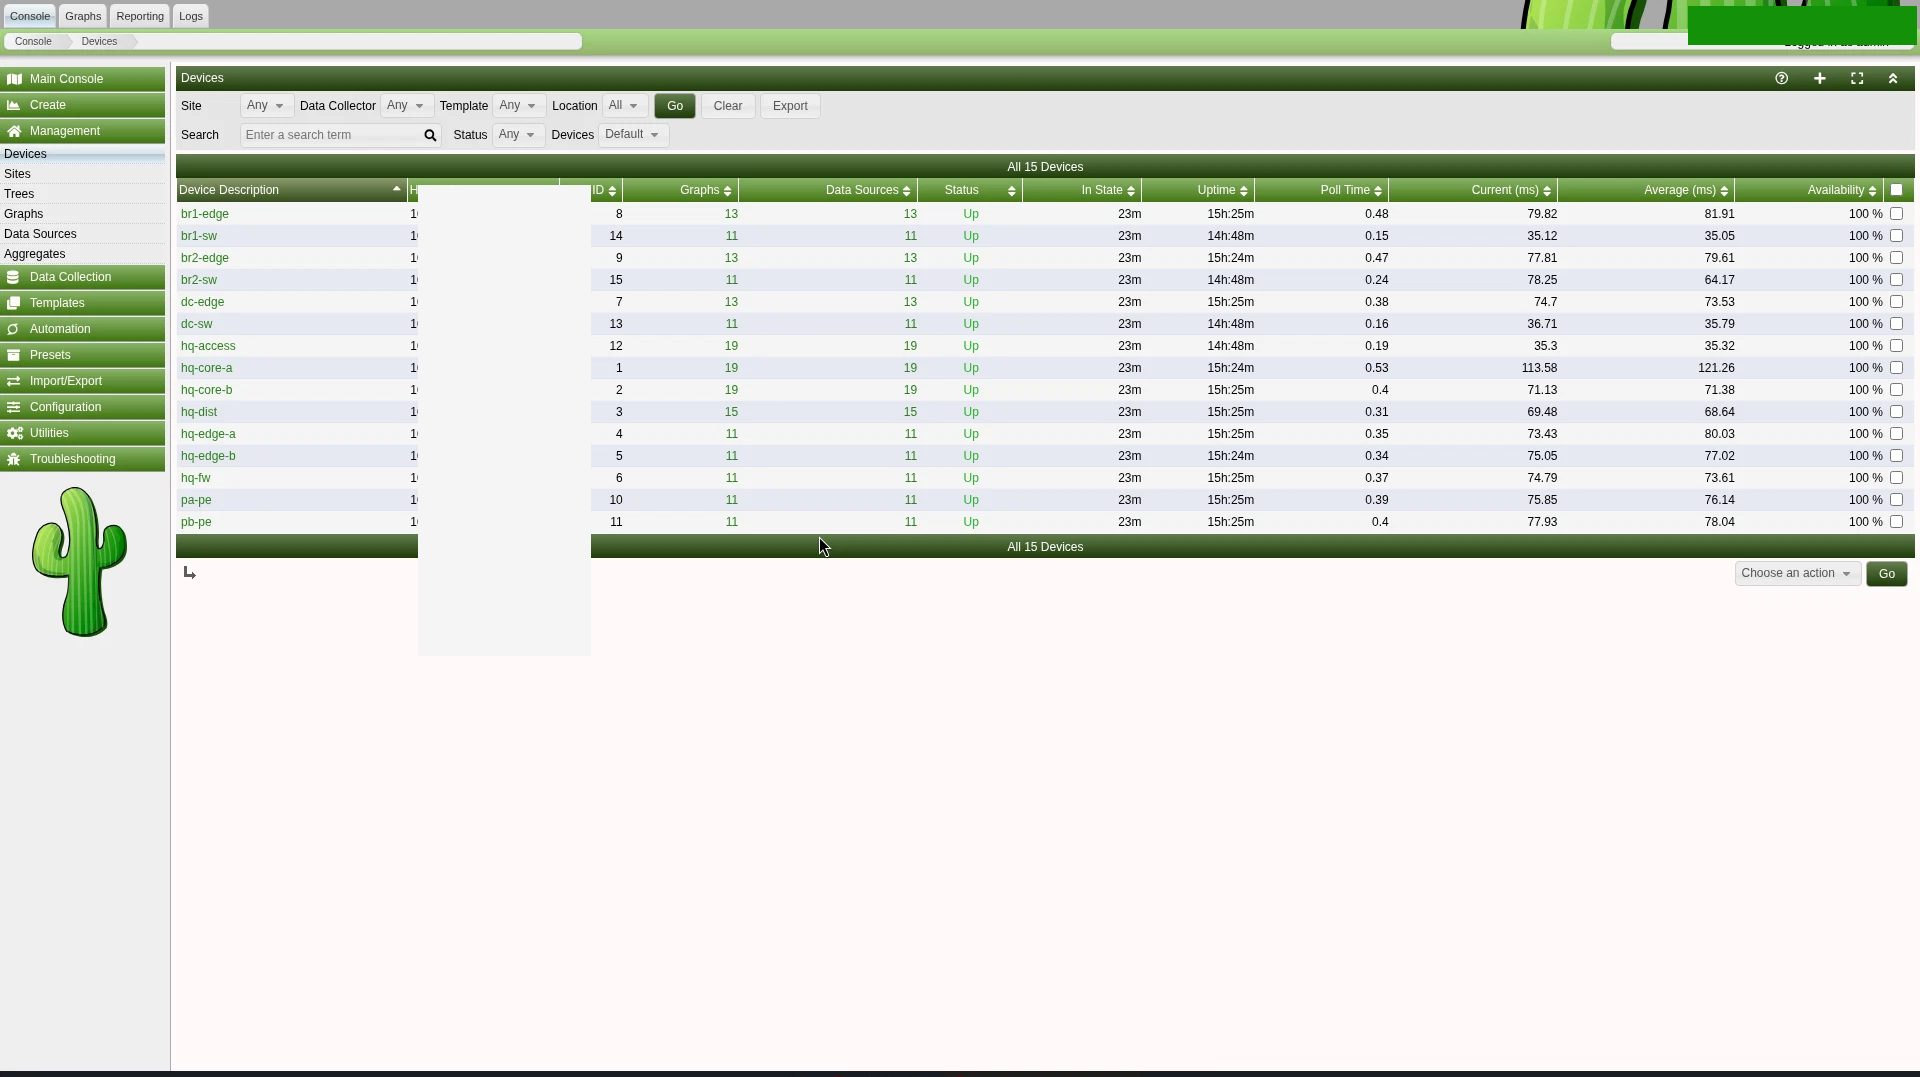
An official CLI install imported the Cacti Stats, Cisco Router, and Generic SNMP Device packages. I used host template "Cisco Router" for all 15 devices.
After interface reindexing, the first poller run at 8:41:43 AM Pacific Time on November 8, 2026 reported 15 hosts up, 276 data sources, and 199 RRDs processed in 6.6 seconds:
- System description on the 11 routers identified IOS-XE enterprise software. The four access switches identified the Layer 2 IOS-XE image.
- SNMPv3 on Layer 3 used authPriv (SHA and AES). The access switches used authNoPriv (SHA). That matches the same image limit recorded in the Zabbix article.
- Interface discovery returned short names such as
Et0/2andLo0. Where Cisco had a description, Cacti used it in the graph title. I cropped those descriptions out of the screenshots below. The HQ edge toward provider A is the Et0/2 traffic and status pair. - I created Interface Traffic (bits/sec) and Interface Status graphs for Ethernet names matching
^Et, plus a Device Uptime graph per host. That is 77 traffic graphs, 77 status graphs, and 15 uptime graphs.
The poller runs that job on a 300 second loop. It is not a one-off command. Later automatic cycles at 8:46:50, 8:51:58, and 8:57:05 AM PT kept the same 15/276/199 counts.
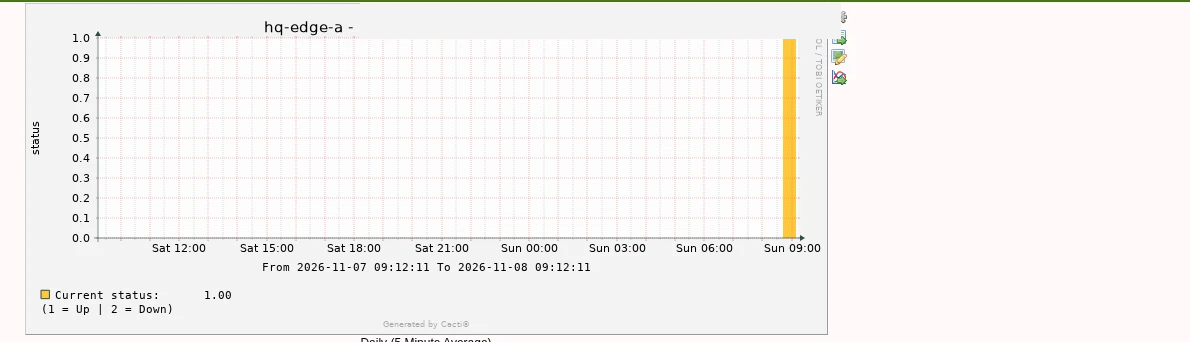
A last-hour graph preview for the HQ edge, from 8:02 to 9:02 AM Pacific Time, stayed blank until about 8:40 AM. That empty left side is the hour before this instance started writing RRDs, not a polling failure.
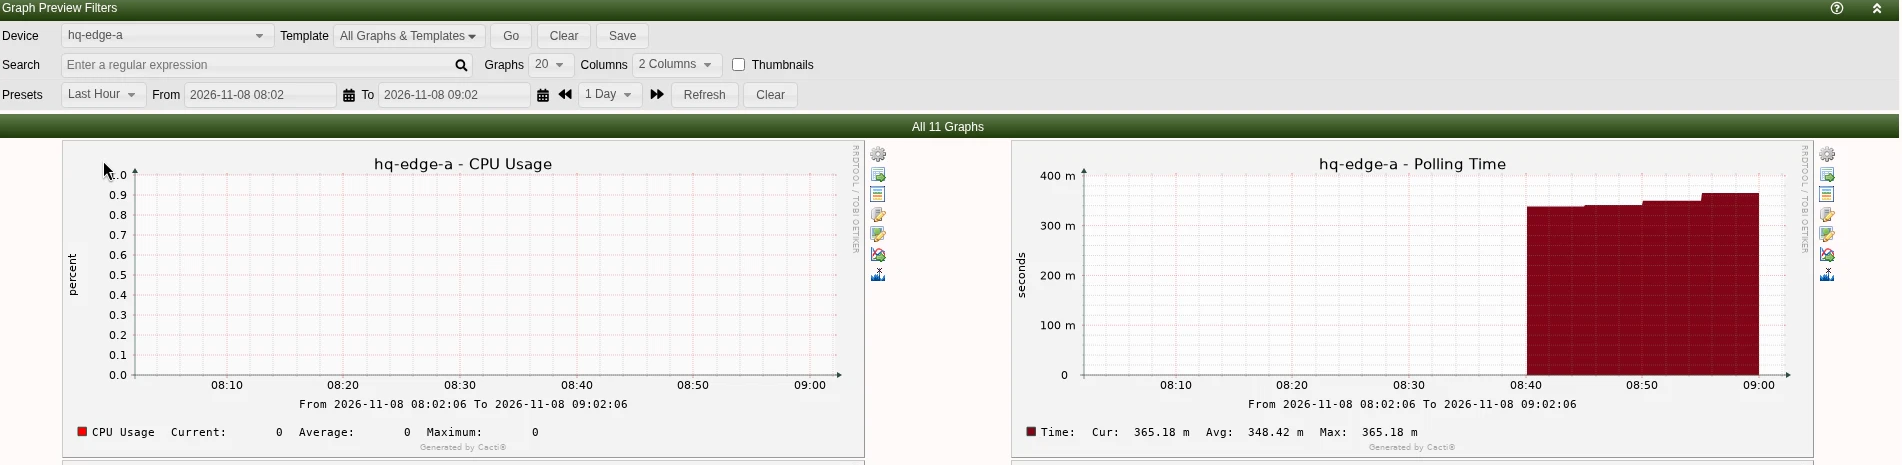
The official Interface - Traffic template stores octet counters. The graph items use Cacti's Turn Bytes into Bits CDEF (CURRENT_DATA_SOURCE * 8), so the UI is bits per second. rrdtool fetch AVERAGE on the HQ edge graph toward provider A (Et0/2) showed three closed five-minute slots: about 1142/766 bytes per second ending 8:45 AM PT, 1085/691 ending 8:50 AM PT, and 1126/650 ending 8:55 AM PT. That is about 9.1, 8.7, and 9.0 kbps inbound after the CDEF. The matching status RRD last value was 1 (up). Those numbers came from the files the poller wrote. I did not edit counters or graph points.
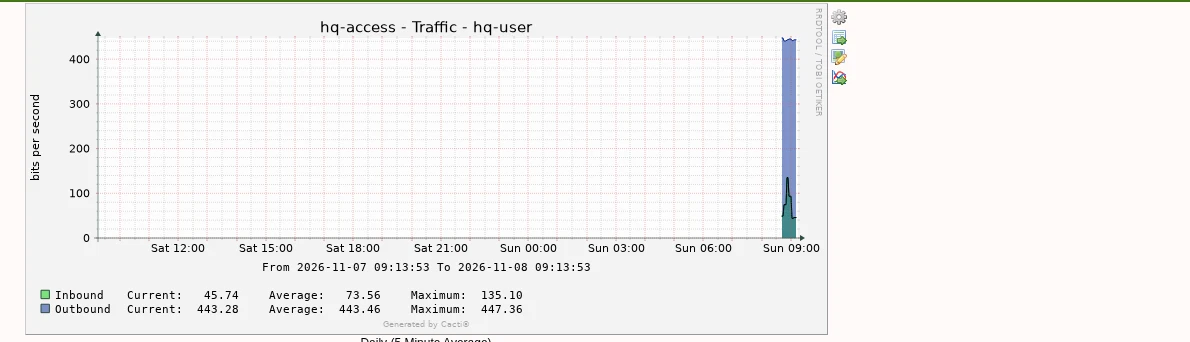
The daily traffic graph matches that recent window. The long blank range to the left is the same honest start of collection. Current inbound on that view is about 8.0 kbps, average 8.7 kbps, maximum 9.1 kbps. Those are background rates from the live poll, not a traffic load I generated and not a failover test.
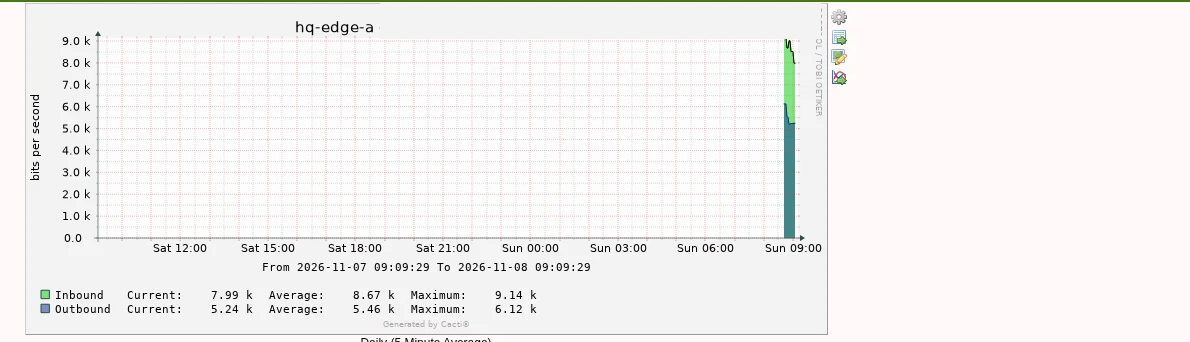
The official Cisco package also created CPU graphs. On the HQ edge and the HQ access switch those RRDs last stored 0. I do not read that as a measured CPU load on these virtual devices.
A short HTTP check from a branch user to the HQ app succeeded at 8:46:43 AM PT, so the data path was alive at that moment. Larger transfers timed out. After that, pings to the app's data-plane address failed while local HTTP on the app host still answered.
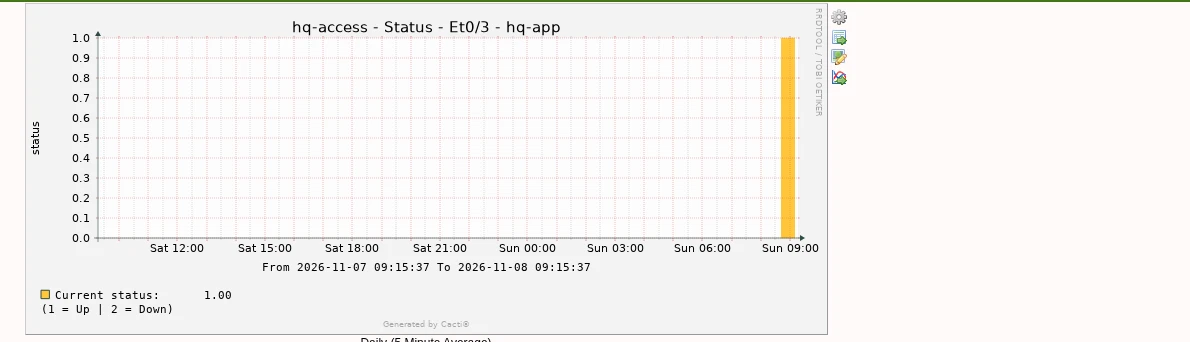
Cacti and the access switch both showed the port toward the HQ app as up, in the server VLAN, and spanning-tree forwarding. The switch had not learned the app's MAC on that port, and the app could not complete ARP for its gateway. Other servers on the same VLAN still answered. An SNMP interface-up reading is not the same as the attached host being reachable. This was not a failover test I planned.
What this post does not cover
I did not run Nagios, Icinga, OpenNMS, or PRTG on this network for this article. Cacti native alerting is not the focus here. This is not a ranking against Zabbix.