
Nmap finishes its scan. Ports 22 and 80 are open, the other probes get closed-port responses, and the target still answers HTTP. Suricata records zero alerts.
In this lab, changing one SPAN source from both to tx caused that result. The mirror still delivered traffic to the sensor: 16 replies from the target. It delivered none of the scanner's 16 SYNs, which were the packets the local rules needed to match.
That makes this a particularly easy fault to miss. A running engine, a nonempty capture, and a reachable server can all look reassuring while the detector is missing the direction that matters.
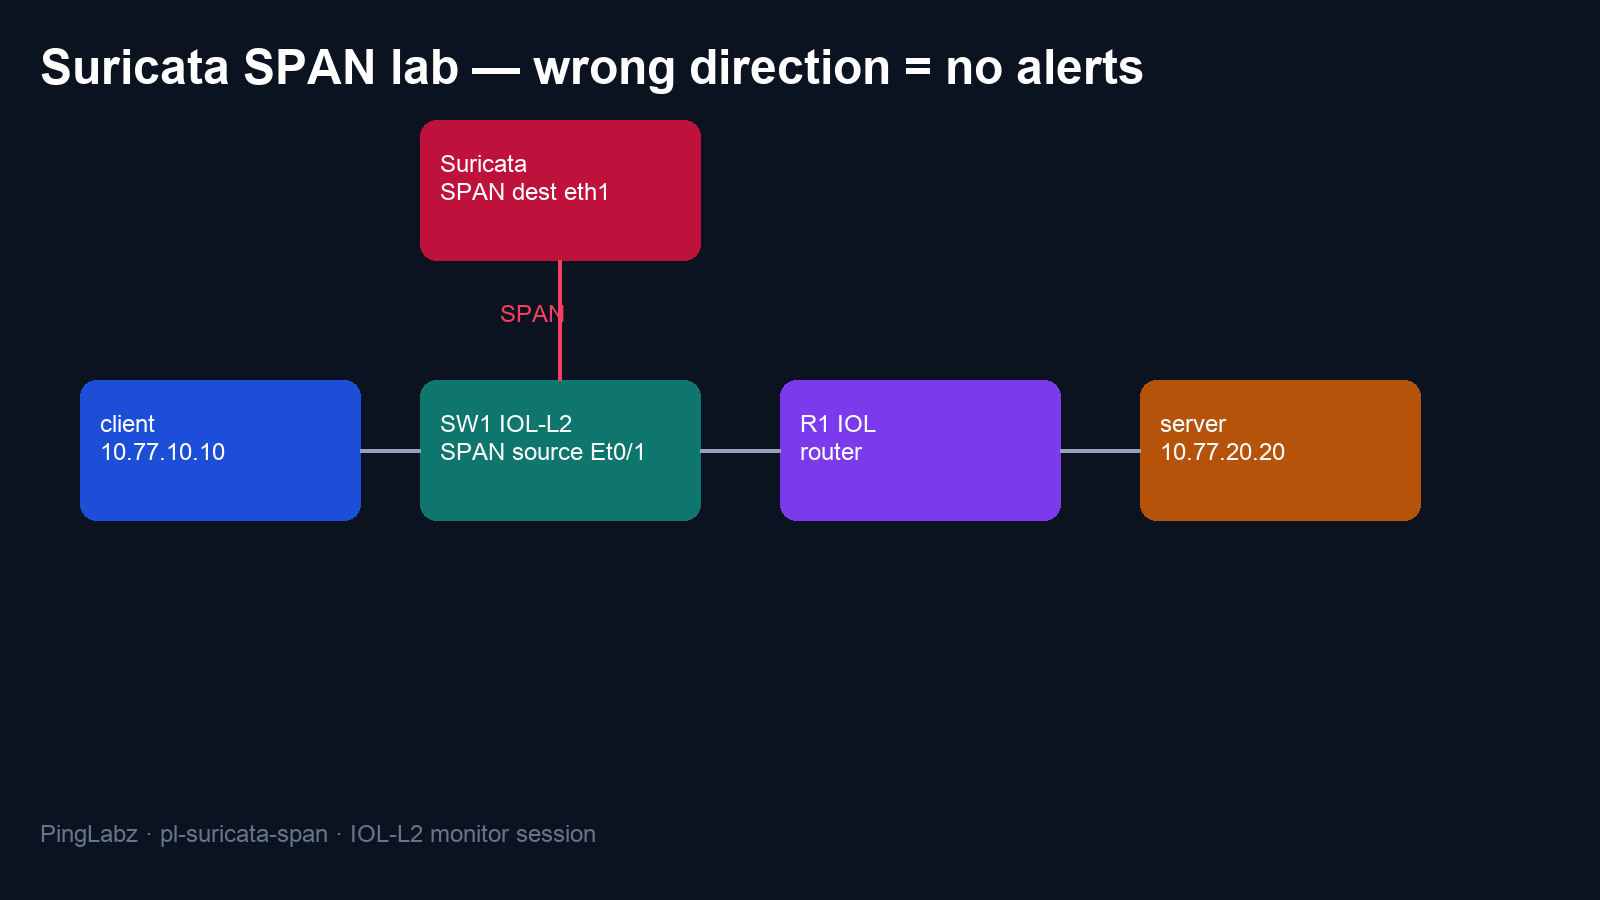
Topology and test conditions
The recorded test ran on October 17, 2026, with five Containerlab nodes. SW1 uses Cisco IOL-L2 17.18.2; R1 uses Cisco IOL 17.18.2. The endpoints use Alpine 3.24.2, with Nmap 7.99 on the client. The passive sensor runs Suricata 8.0.3.
| Connection | Interface and address |
|---|---|
| Scanner to SW1 | Client eth1, 10.77.10.10/24 → SW1 Ethernet0/1, access VLAN 10 |
| SW1 to router | SW1 Ethernet0/2, access VLAN 10 → R1 Ethernet0/1, 10.77.10.1/24 |
| Router to target | R1 Ethernet0/2, 10.77.20.1/24 → server eth1, 10.77.20.20/24 |
| Mirror to IDS | SW1 Ethernet0/3 → sensor eth1, with no IPv4 address |
The client routes the target subnet through 10.77.10.1; the server routes the client subnet through 10.77.20.1. Linux eth0 handles management. The scan and packet captures use the data interfaces, and the scan target is only 10.77.20.20 in this isolated lab.
The target serves HTTP on TCP 80 and has a deliberately fake listener on TCP 22. Nmap's ssh label is a port-name lookup, not proof that an SSH service is running.
For reproduction, prepare the interfaces and routes above, a switch image that implements local SPAN, and a sensor with AF_PACKET access to its mirror NIC. Use a privileged client shell for the SYN scan. On SW1 and R1, enter configuration through their device consoles; shell commands belong on the client or lab host as labeled below. Platform support matters: the IOL router image in this test rejected SPAN commands, so the measured mirror runs use the separate IOL-L2 switch.
Establish a working SPAN session and alerts
On SW1, make Ethernet0/1 the source and Ethernet0/3 the destination. These are the two session lines from the tested switch configuration; enter them in global configuration mode:
monitor session 1 source interface Ethernet0/1 both
monitor session 1 destination interface Ethernet0/3
Run show monitor session 1 in privileged EXEC mode. The baseline output confirms both directions on the scanner-facing source port:
SW1#show monitor session 1
Session 1
---------
Type                     : Local Session
Source Ports             :
    Both                 : Et0/1
Destination Ports        : Et0/3
    Encapsulation        : Native
both is useful here because the sensor needs to see probes and replies. The SPAN, RSPAN, and ERSPAN guide covers the different ways to deliver those copies to an analyzer.
The sensor's tested YAML selects eth1 under af-packet. Its EVE output includes alerts and statistics. This is the relevant output configuration excerpt:
outputs:
  - eve-log:
      enabled: yes
      filetype: regular
      filename: eve.json
      types:
        - alert
        - stats:
            totals: yes
Load the two local rules below as the sensor's rule file. They appear here exactly as recorded during the baseline configuration check:
# Educational signatures, not ET rules and not a general production scan detector.
alert tcp 10.77.10.10 any -> 10.77.20.20 any (msg:"PingLabz LAB repeated SYN probes"; flags:S; flow:stateless; detection_filter:track by_src,count 4,seconds 30; sid:1007701; rev:1;)
alert tcp 10.77.10.10 any -> 10.77.20.20 4444 (msg:"PingLabz LAB SYN to canary port 4444"; flags:S; flow:stateless; sid:1007702; rev:1;)
SID 1007701 tracks matching SYN packets by source. After four in 30 seconds, subsequent matching packets can alert. It counts SYNs, not distinct destination ports, so treat it as an educational signature rather than a general production scan detector. SID 1007702 gives a simpler check: a SYN from this client to the canary port, TCP 4444.
The measured runs used the same YAML, rule file, and launch arguments in each phase. Each phase started a fresh Suricata process and wrote to a separate log directory, resetting threshold and flow state. The lab's phase runner also captured the client and mirror interfaces simultaneously, using the filter tcp and host 10.77.20.20, then stopped tcpdump with SIGINT to flush the files.
If using the supplied lab files, run python3 scripts/phase.py baseline from the lab directory on the lab host after setup. Use that bounded runner with its own sensor; do not run it alongside another detector using the same AF_PACKET cluster. For a manually assembled equivalent, start the sensor and both captures before running the scan.
Inside the client shell, the scan script executes this exact command:
exec nmap -sS -Pn -n --max-retries 0 --scan-delay 100ms -p 22,80,443,4444,8000-8011 10.77.20.20
It sends a SYN scan to 16 selected ports, skips host discovery and DNS lookups, disables retries, and spaces probes 100 ms apart. The command is identical in all three phases; Nmap chooses a different source port and probe order between runs. For the scan options and port states, see Nmap port scanning.
Baseline Nmap output, excerpt:
Nmap scan report for 10.77.20.20
Host is up (0.0017s latency).

PORT     STATE  SERVICE
22/tcp   open   ssh
80/tcp   open   http
443/tcp  closed https
4444/tcp closed krb524
The phase runner's alert count was:
PHASE=baseline ALERT_COUNT=13
Twelve alerts matched the repeated-SYN rule; one matched the canary rule. This is the original, unformatted canary alert line from logs/baseline/eve.json, preserved in the recorded evidence:
{"timestamp":"2026-10-17T13:50:59.178179+0000","flow_id":1046748011911090,"in_iface":"eth1","event_type":"alert","src_ip":"10.77.10.10","src_port":62936,"dest_ip":"10.77.20.20","dest_port":4444,"proto":"TCP","ip_v":4,"pkt_src":"wire/pcap","alert":{"action":"allowed","gid":1,"signature_id":1007702,"rev":1,"signature":"PingLabz LAB SYN to canary port 4444","category":"","severity":3},"direction":"to_server","flow":{"pkts_toserver":1,"pkts_toclient":0,"bytes_toserver":58,"bytes_toclient":0,"start":"2026-10-17T13:50:59.178179+0000","src_ip":"10.77.10.10","dest_ip":"10.77.20.20","src_port":62936,"dest_port":4444}}
The source is 10.77.10.10, the destination is 10.77.20.20:4444, and the event names SID 1007702 on eth1. The action is allowed, as expected for a passive IDS that observes traffic without blocking it. The earlier Suricata EVE controlled-scan lab follows the relationship between packets, rules, and EVE alerts in more detail.
Introduce the fault: transmit-only mirroring
On SW1, replace the source selection with tx. The recorded CLI exchange was:
configure terminal
Enter configuration commands, one per line.  End with CNTL/Z.
SW1(config)#no monitor session 1 source interface Ethernet0/1
SW1(config)#monitor session 1 source interface Ethernet0/1 tx
SW1(config)#end
Check the monitor session again:
SW1#show monitor session 1
Session 1
---------
Type                     : Local Session
Source Ports             :
    TX Only              : Et0/1
Destination Ports        : Et0/3
    Encapsulation        : Native
Repeat the same scan with the same sensor configuration. With the lab files, the bounded measurement is python3 scripts/phase.py fault on the lab host, after changing the direction.
Nmap again reported TCP 22 and 80 open and the other 14 ports closed. The client still received three of three ping replies, and HTTP returned 200. Suricata's phase result was:
PHASE=fault ALERT_COUNT=0
Zero alerts does not mean eve.json is empty: this configuration also writes stats events. The extracted fault alert file was empty.
The mirror capture was not empty. These are its first three decoded packets, from the fault evidence:
2026-10-17 13:51:25.789385 IP 10.77.20.20.443 > 10.77.10.10.57529: Flags [R.], seq 0, ack 3104730059, win 0, length 0
2026-10-17 13:51:25.889129 IP 10.77.20.20.80 > 10.77.10.10.57529: Flags [S.], seq 1205839821, ack 3104730059, win 64240, options [mss 1460], length 0
2026-10-17 13:51:25.989176 IP 10.77.20.20.22 > 10.77.10.10.57529: Flags [S.], seq 4288189735, ack 3104730059, win 64240, options [mss 1460], length 0
Every packet shown travels from the target to the scanner. [R.] is RST/ACK; [S.] is SYN/ACK. There is no initiating client SYN in the entire fault mirror capture. Filtering for those SYNs leaves zero packets, even though the mirror capture contains 16 replies.
The fault phase's tcpdump summaries follow, with the mirror first and client second:
tcpdump: listening on eth1, link-type EN10MB (Ethernet), snapshot length 262144 bytes
16 packets captured
16 packets received by filter
0 packets dropped by kernel
tcpdump: listening on eth1, link-type EN10MB (Ethernet), snapshot length 262144 bytes
34 packets captured
34 packets received by filter
0 packets dropped by kernel
Both captures report zero kernel drops. The client still has 34 packets; the mirror has only 16. A quick check that the capture file has grown would miss the fault.
Diagnose the monitor session direction
Read rx and tx from SW1's source-port perspective. Cisco defines them as traffic received and transmitted by the source interface; see its SPAN configuration reference.
| Traffic at SW1 Ethernet0/1 | Source-port direction | Copied by tx here? |
|---|---|---|
| Client SYN entering SW1 | rx |
No |
| Target SYN/ACK or RST/ACK leaving SW1 toward the client | tx |
Yes |
| Client RST entering SW1 after an open-port response | rx |
No |
The scanner transmits its SYN, but SW1 receives that SYN on Ethernet0/1. Selecting tx on that port copies traffic going back toward the scanner. The sensor can receive those copies perfectly and still miss every packet needed by these rules.
Both signatures require a SYN from 10.77.10.10 toward 10.77.20.20. Target replies have the opposite address direction and different flags. With no scanner SYNs in the mirror, neither rule has a matching packet to inspect. Other rules could detect other traffic in a reply-only capture; the zero-alert result belongs to these rules and this test.
When Suricata produces no alerts, follow the same sequence:
- Confirm that the client actually sent the triggering traffic. Its capture is the control; a successful Nmap report alone does not establish sensor visibility.
- Inspect the sensor-side capture for the exact source, destination, and flags required by the rule. Check both directions, even when packets are arriving.
- Run
show monitor session 1and trace ingress and egress at the selected source port. The direction changes meaning if you move the source to the router-facing port. - Once packet delivery is established, inspect loaded rules, EVE event types, and engine messages. A running process alone cannot prove detection works.
The engine did emit warnings in the successful runs as well: single runmode fell back from TPACKET v3 to v2, and the SYN-only canary rule was disabled for the to-client direction. Those messages did not explain the difference between the three phases. The needed to-server rule matched in the baseline and fixed runs. Checksum validation was disabled for this virtual Ethernet lab; that is a test setting, not a general production recommendation.
One other misleading clue: SW1's SPAN destination showed up/down in show ip interface brief while delivering the measured mirrored packets. On this image, that display alone was not grounds to declare the destination broken.
Fix the source selection
Restore both directions on SW1. The recorded repair and verification were:
configure terminal
Enter configuration commands, one per line.  End with CNTL/Z.
SW1(config)#no monitor session 1 source interface Ethernet0/1
SW1(config)#monitor session 1 source interface Ethernet0/1 both
SW1(config)#end
SW1#show monitor session 1
Session 1
---------
Type                     : Local Session
Source Ports             :
    Both                 : Et0/1
Destination Ports        : Et0/3
    Encapsulation        : Native


SW1#show running-config | include monitor session
monitor session 1 source interface Et0/1
monitor session 1 destination interface Et0/3
Notice that show running-config omits the explicit both keyword after the repair. On this image it is implicit. show monitor session 1 makes the selection clear: Both : Et0/1.
Receive-only mirroring on this scanner-facing port would include the SYNs these signatures need, but that alternative was not measured here. Restoring both reproduces the working baseline and preserves the responses for analysis.
Re-verify packets and port-scan alerts in eve.json
Repeat the scan after restoring the session. With the lab files, use python3 scripts/phase.py fixed on the lab host. The fixed mirror now contains the canary SYN and its reply:
2026-10-17 13:52:13.361904 IP 10.77.10.10.33273 > 10.77.20.20.4444: Flags [S], seq 3240152813, win 1024, options [mss 1460], length 0
2026-10-17 13:52:13.363747 IP 10.77.20.20.4444 > 10.77.10.10.33273: Flags [R.], seq 0, ack 3240152814, win 0, length 0
The original fixed-run canary alert line follows. Its timestamp matches that SYN, and its source port is now 33273:
{"timestamp":"2026-10-17T13:52:13.361904+0000","flow_id":1554368255394846,"in_iface":"eth1","event_type":"alert","src_ip":"10.77.10.10","src_port":33273,"dest_ip":"10.77.20.20","dest_port":4444,"proto":"TCP","ip_v":4,"pkt_src":"wire/pcap","alert":{"action":"allowed","gid":1,"signature_id":1007702,"rev":1,"signature":"PingLabz LAB SYN to canary port 4444","category":"","severity":3},"direction":"to_server","flow":{"pkts_toserver":1,"pkts_toclient":0,"bytes_toserver":58,"bytes_toclient":0,"start":"2026-10-17T13:52:13.361904+0000","src_ip":"10.77.10.10","dest_ip":"10.77.20.20","src_port":33273,"dest_port":4444}}
The phase count returned to:
PHASE=fixed ALERT_COUNT=13
The full comparison is more useful than any one counter:
| Phase | Source direction | Client TCP packets | Mirror TCP packets | Scanner SYNs on mirror | Target replies on mirror | EVE alerts |
|---|---|---|---|---|---|---|
| Baseline | both |
34 | 34 | 16 | 16 | 13 |
| Fault | tx |
34 | 16 | 0 | 16 | 0 |
| Fixed | both |
34 | 34 | 16 | 16 | 13 |
Every client capture contains all 16 SYNs. Each complete 34-packet capture also contains 16 target replies and two client RSTs after the open-port SYN/ACKs. All tcpdump captures report zero kernel drops. Ping was three of three and HTTP was 200 in every phase.
These packet totals use the TCP/target capture filter. Suricata listened to all frames on eth1 and reported 34, 18, and 36 packets across the three phases; ARP or other control frames can make its totals differ from the filtered PCAP counts. Compare the triggering packets rather than demanding that differently scoped counters agree.
An offline Zeek check of the same mirror files also changed with visibility: baseline and fixed each had 14 REJ and two RSTO connections; the fault had 14 OTH and two RSTRH connections with incomplete histories. Zeek warned that these captures contain only TCP control packets. A SYN scan does not complete ordinary application connections, so SF is not the recovery criterion here. For a separate example of joining the two tools' records, see Zeek and Suricata Community ID from one PCAP.
Takeaways
- A healthy client path says nothing about whether the sensor received the required copy of a packet.
monitor sessiondirection belongs to the selected switch source port. Draw the packet entering or leaving that port before choosingrxortx.- A nonempty capture can still be missing the entire triggering direction. In this fault, it contained 16 replies and zero scanner SYNs.
- Verify recovery with the same scan, unchanged rules, packet evidence, and new EVE alerts. Here, restoring
bothreturned all 16 SYNs and the original 13-alert result.