
The series so far: install Zabbix 7.0 LTS alongside Grafana, add Cisco routers and switches over SNMPv3, add Linux servers with agent 2 and build a NOC board. Now the triggers. One cut WAN link should give you one or two problems, not a page full of red.
Built in my home lab on Zabbix 7.0.32, with two Cisco IOS XE 17.18.2 routers (wan-rtr1, AS 65001 and wan-rtr2, AS 65002) running OSPF area 0 and eBGP over one link, Ethernet0/1, plus the Ubuntu server web01. All failures below were real: interface shutdowns and CPU load.
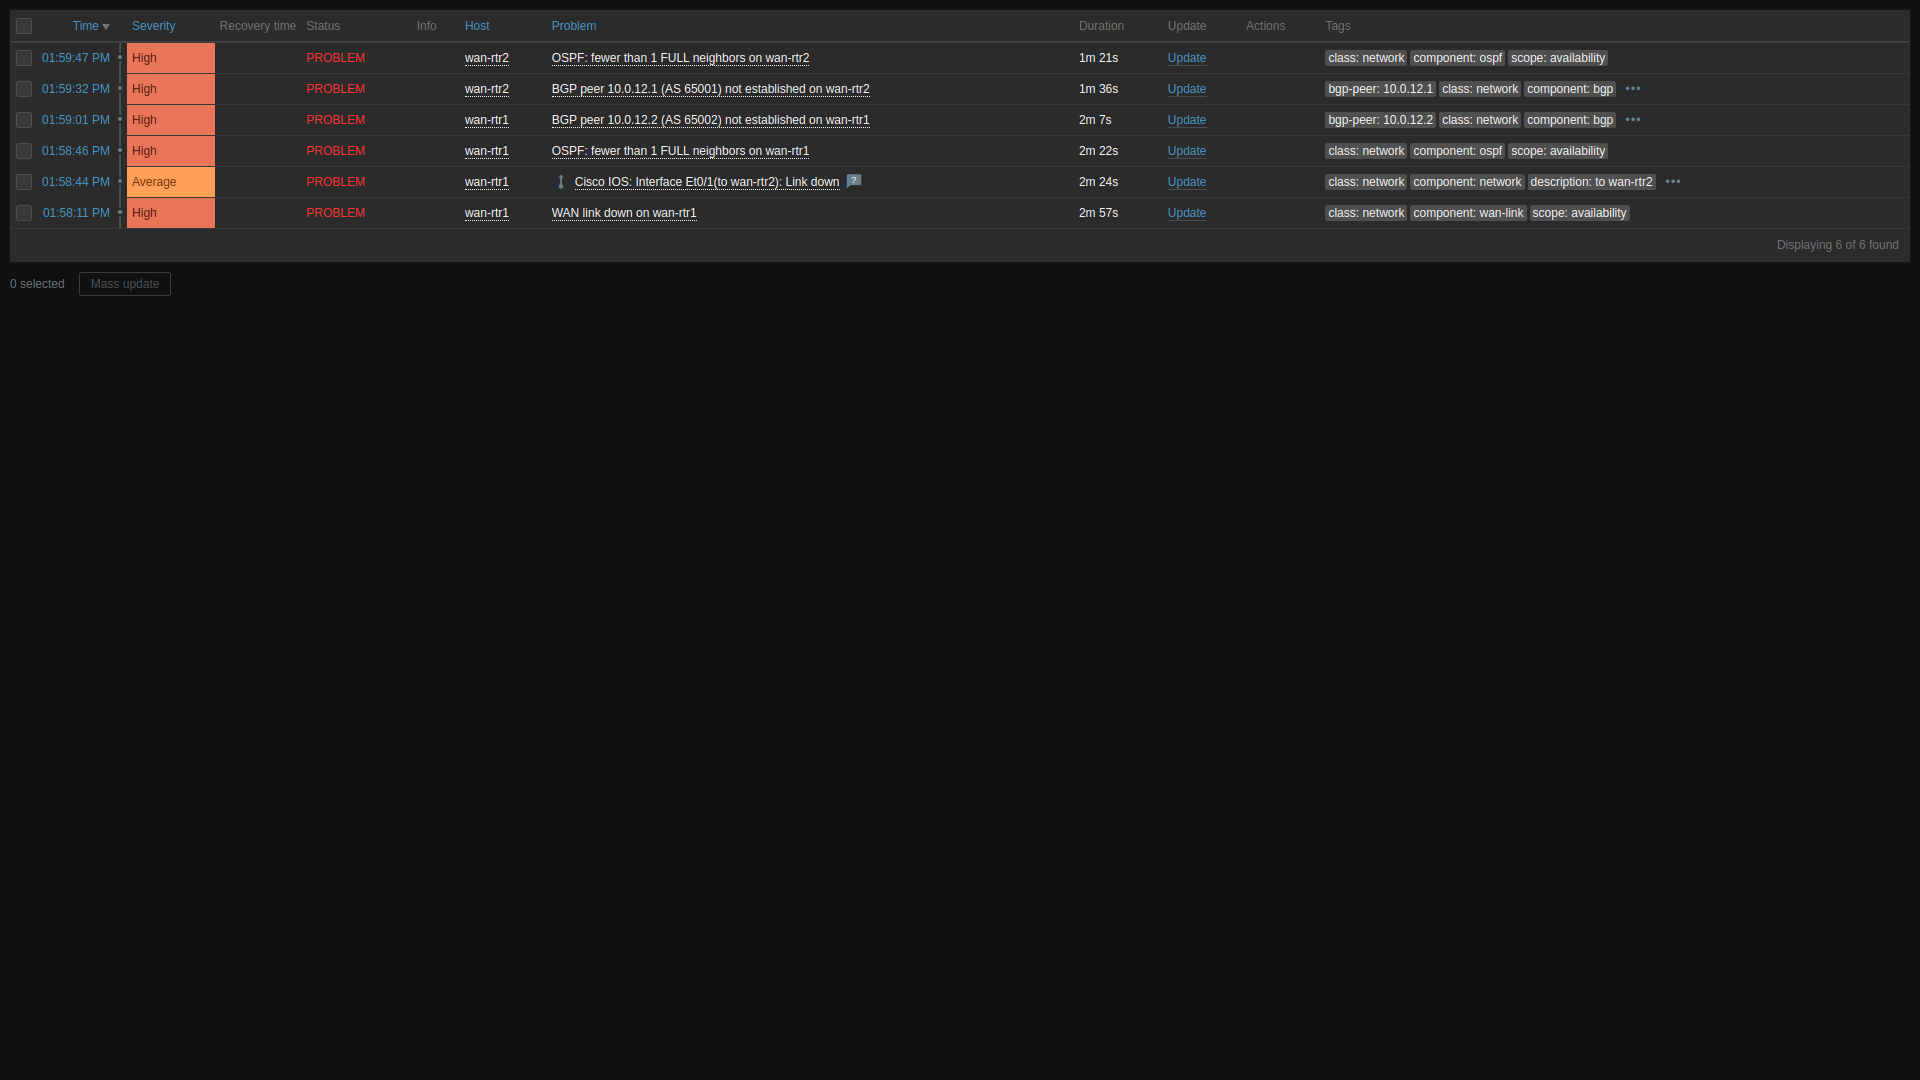
shutdown on wan-rtr1 Et0/1, no dependencies: six problems across two routers.
The items
I put everything in one template, PL WAN routing health by SNMP, linked to both routers next to the stock Cisco IOS by SNMP template. It has three parts.
| Item | Type / key | Interval |
|---|---|---|
| WAN link oper status | SNMP, 1.3.6.1.2.1.2.2.1.8.{$WAN.IFINDEX} (ifOperStatus) | 10s |
| OSPF neighbours in FULL | SNMP walk[1.3.6.1.2.1.14.10.1.6] plus a dependent item counting state 8 | 30s |
| BGP peer state | LLD on bgpPeerRemoteAddr, prototype on 1.3.6.1.2.1.15.3.1.2.{#SNMPINDEX} | 30s |
OSPF and BGP need different shapes, and the reason is how the MIBs behave. When an OSPF neighbour dies, IOS XE removes its row from ospfNbrTable. A per-neighbour item would just go unsupported, and an unsupported item fires nothing. So I count FULL neighbours instead and alert when the count drops below {$OSPF.NBR.MIN}. The dependent item's JavaScript is short:
var n = 0;
value.split("\n").forEach(function (l) {
  if (/INTEGER: 8$/.test(l.trim())) n++;   // 8 = full
});
return n;
BGP peers are configured, so their rows stay in bgpPeerTable when the session drops, with the state going from 6 (established) to idle or active. Discovering peers and watching each one works. A walk from the Zabbix server with the session up:
SNMPv2-SMI::mib-2.14.10.1.6.10.0.12.2.0 = INTEGER: 8
SNMPv2-SMI::mib-2.15.3.1.2.10.0.12.2 = INTEGER: 6
The triggers, with recovery expressions
WAN link down on {HOST.NAME}                         High
  last(/T/wan.link.oper)=2

WAN link flapping on {HOST.NAME}                     Average
  problem:  changecount(/T/wan.link.oper,5m)>=4
  recovery: changecount(/T/wan.link.oper,10m)=0

OSPF: fewer than {$OSPF.NBR.MIN} FULL neighbors     High
  problem:  max(/T/ospf.nbr.full,#2)<{$OSPF.NBR.MIN}
  recovery: last(/T/ospf.nbr.full)>={$OSPF.NBR.MIN}

BGP peer {#PEERIP} (AS {#PEERAS}) not established    High
  problem:  max(/T/bgp.peer.state[{#SNMPINDEX}],#2)<6
recovery: last(/T/bgp.peer.state[{#SNMPINDEX}])=6(T is the template name.) Using max(...,#2) means two bad polls in a row before a problem opens, so one lost SNMP reply doesn't page anyone. The flap trigger is where a recovery expression matters most. Without one it closes the moment fewer than four changes sit in the 5-minute window, often while the link is still bouncing. With recovery: no changes in 10 minutes it stays open until the link has actually settled.
Every trigger has tags: scope:availability or scope:performance, component:wan-link|ospf|bgp|cpu, and the BGP ones carry bgp-peer:{#PEERIP}. Those tags are what you filter on in the Problems view and what alert actions match on in the next post.
The failure without dependencies
wan-rtr1(config)# interface Ethernet0/1
wan-rtr1(config-if)# shutdown
Within two minutes Zabbix had six problems (screenshot at the top): WAN link down and the stock Link down on wan-rtr1, then OSPF and BGP on both routers. Note what didn't fire: anything about wan-rtr2's own interface. In my lab the far end stayed up/up when wan-rtr1 shut its side, the same thing you get with a provider hand-off where carrier doesn't follow the remote end. wan-rtr2 only learns about it from OSPF dead timers and BGP hold timers. Keep that in mind when you plan dependencies.
Adding dependencies
- Template: OSPF fewer than N FULL depends on WAN link down.
- Template: the BGP trigger prototype depends on the OSPF trigger. Zabbix checks the whole chain, so BGP is held back while the link is down too.
- Host level on wan-rtr2: its OSPF trigger also depends on wan-rtr1's WAN link down. Zabbix 7.0 lets you add dependencies to an inherited trigger on a host, so you can point across devices.
A gotcha I hit: the first rerun still opened both BGP problems. Discovered triggers only get a prototype's new dependency on the next LLD run, and mine ran every 10 minutes. After Execute now on the discovery rule the dependency showed up on both discovered triggers. I then ran no shutdown, waited for everything to clear and shut the link again:
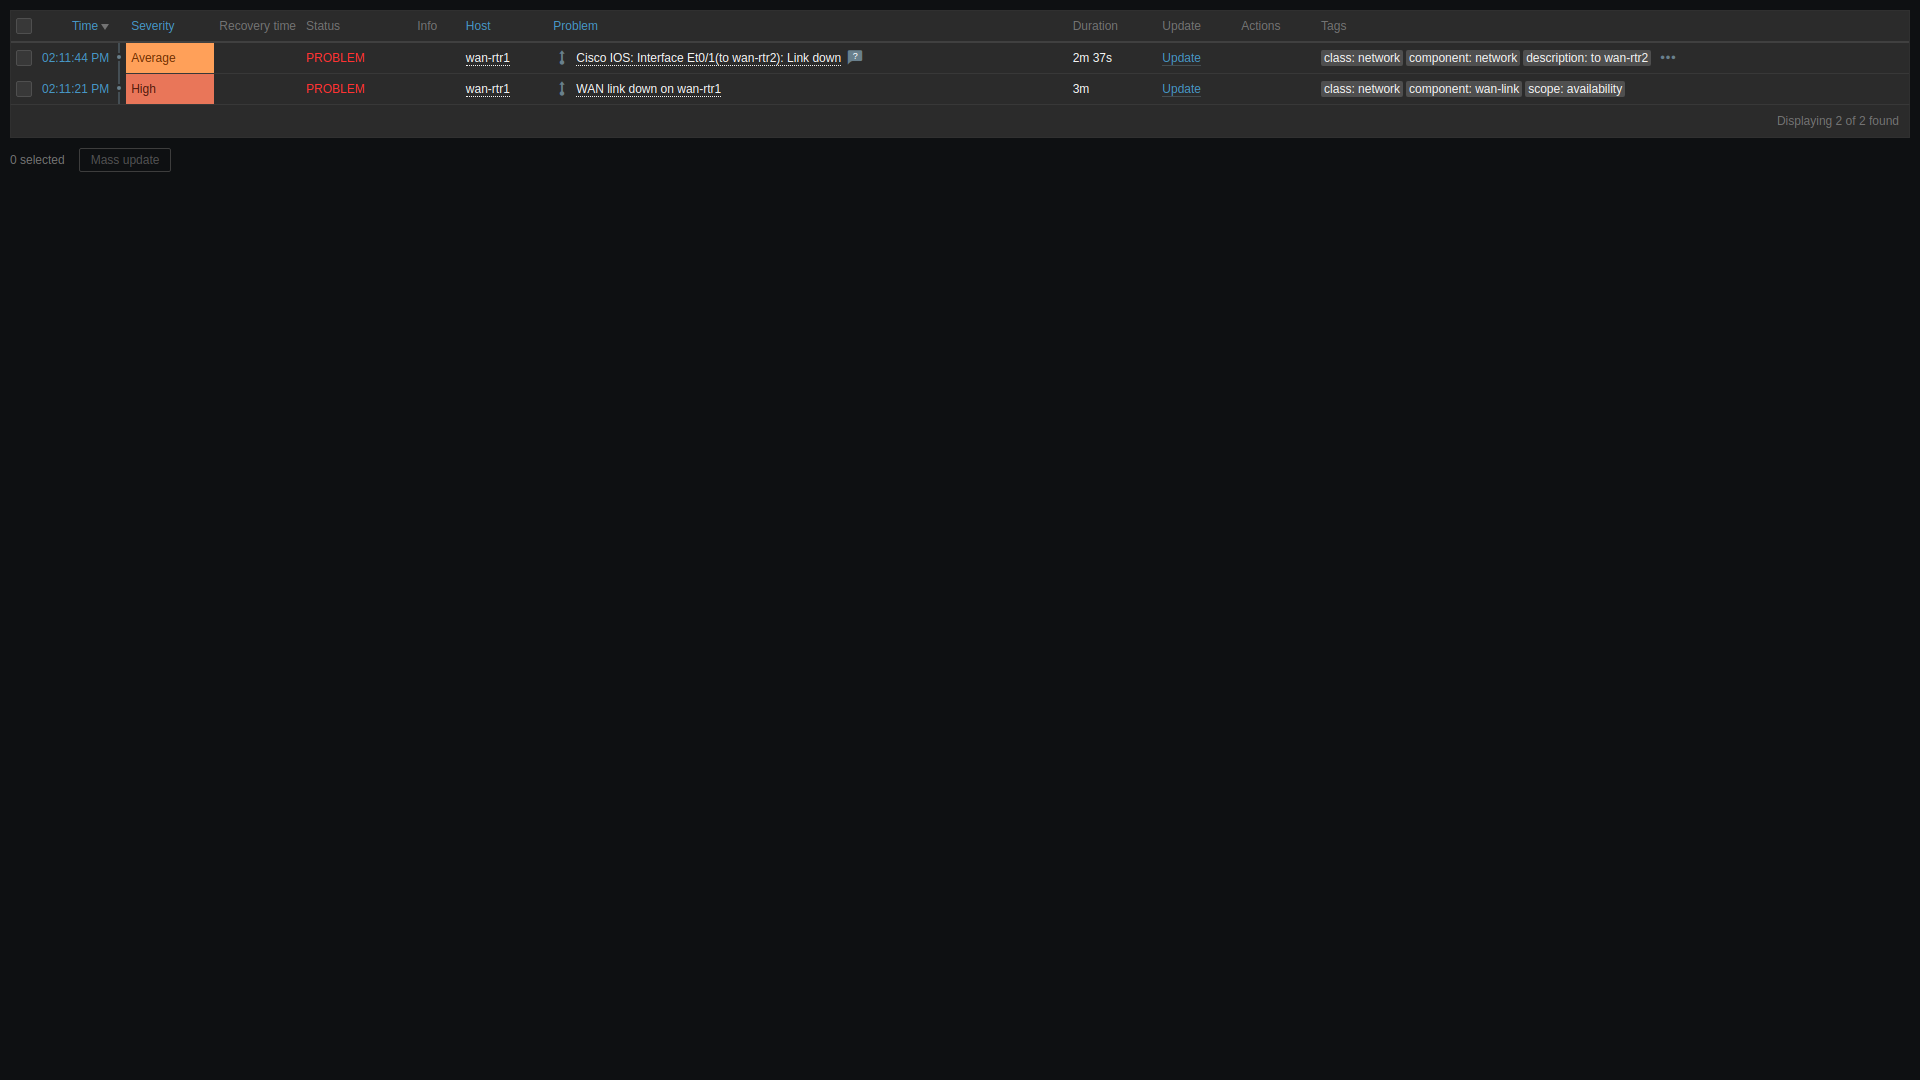
Six problems became two, and both point at Et0/1 on wan-rtr1. The two left are my 10-second WAN link down and the stock 1-minute Link down, so in production I'd keep just one of them.
Flapping, and a hole after recovery
Next, three shut and no-shut cycles about 20 seconds apart. The 10-second item caught every change, and WAN link flapping opened on the fourth change and stayed open until 10 quiet minutes had passed. The stock link-down trigger, polling once a minute, saw only one of the three drops. OSPF and BGP never opened, because their two-poll condition was never met while the link was in problem.
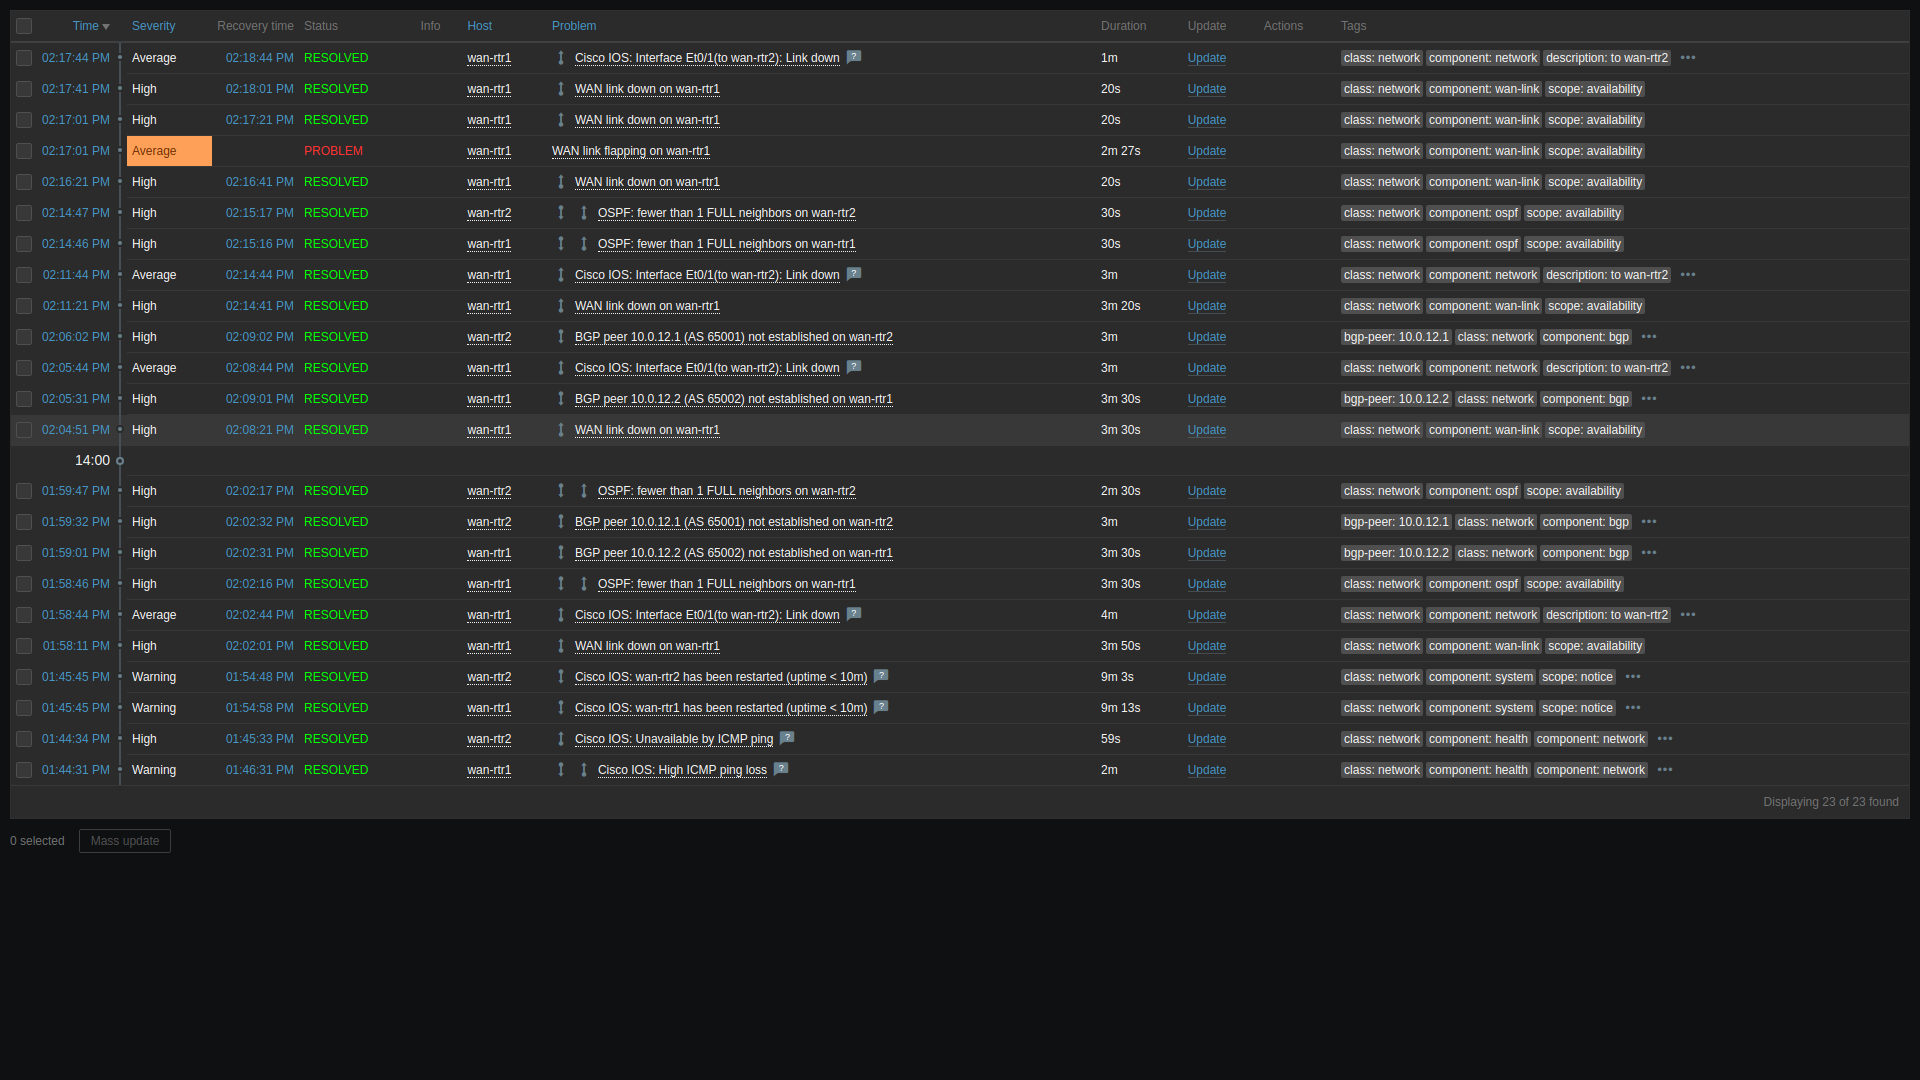
The history also shows a real hole. When the link came back after the dependency test, both OSPF triggers opened for 30 seconds. The link was up, so the dependency stopped holding them back, but the adjacency hadn't reached FULL yet. I didn't rerun with a change, but the obvious fix is a wider window for OSPF, such as max(...,#4) at a 30-second interval, so the adjacency has time to rebuild.
High CPU with hysteresis
The stock Linux template fires when CPU is over 90% for five minutes and clears as soon as it isn't. I added a host trigger on web01 with separate thresholds for raising and clearing:
CPU above {$CPU.HYST.HIGH}% for 3m on {HOST.NAME}    Average
  problem:  min(/web01/system.cpu.util,3m)>{$CPU.HYST.HIGH}   # 80
  recovery: max(/web01/system.cpu.util,3m)<{$CPU.HYST.LOW}    # 60
Then I loaded the box: 100% for 7 minutes, about 70% for 6 minutes, then idle.
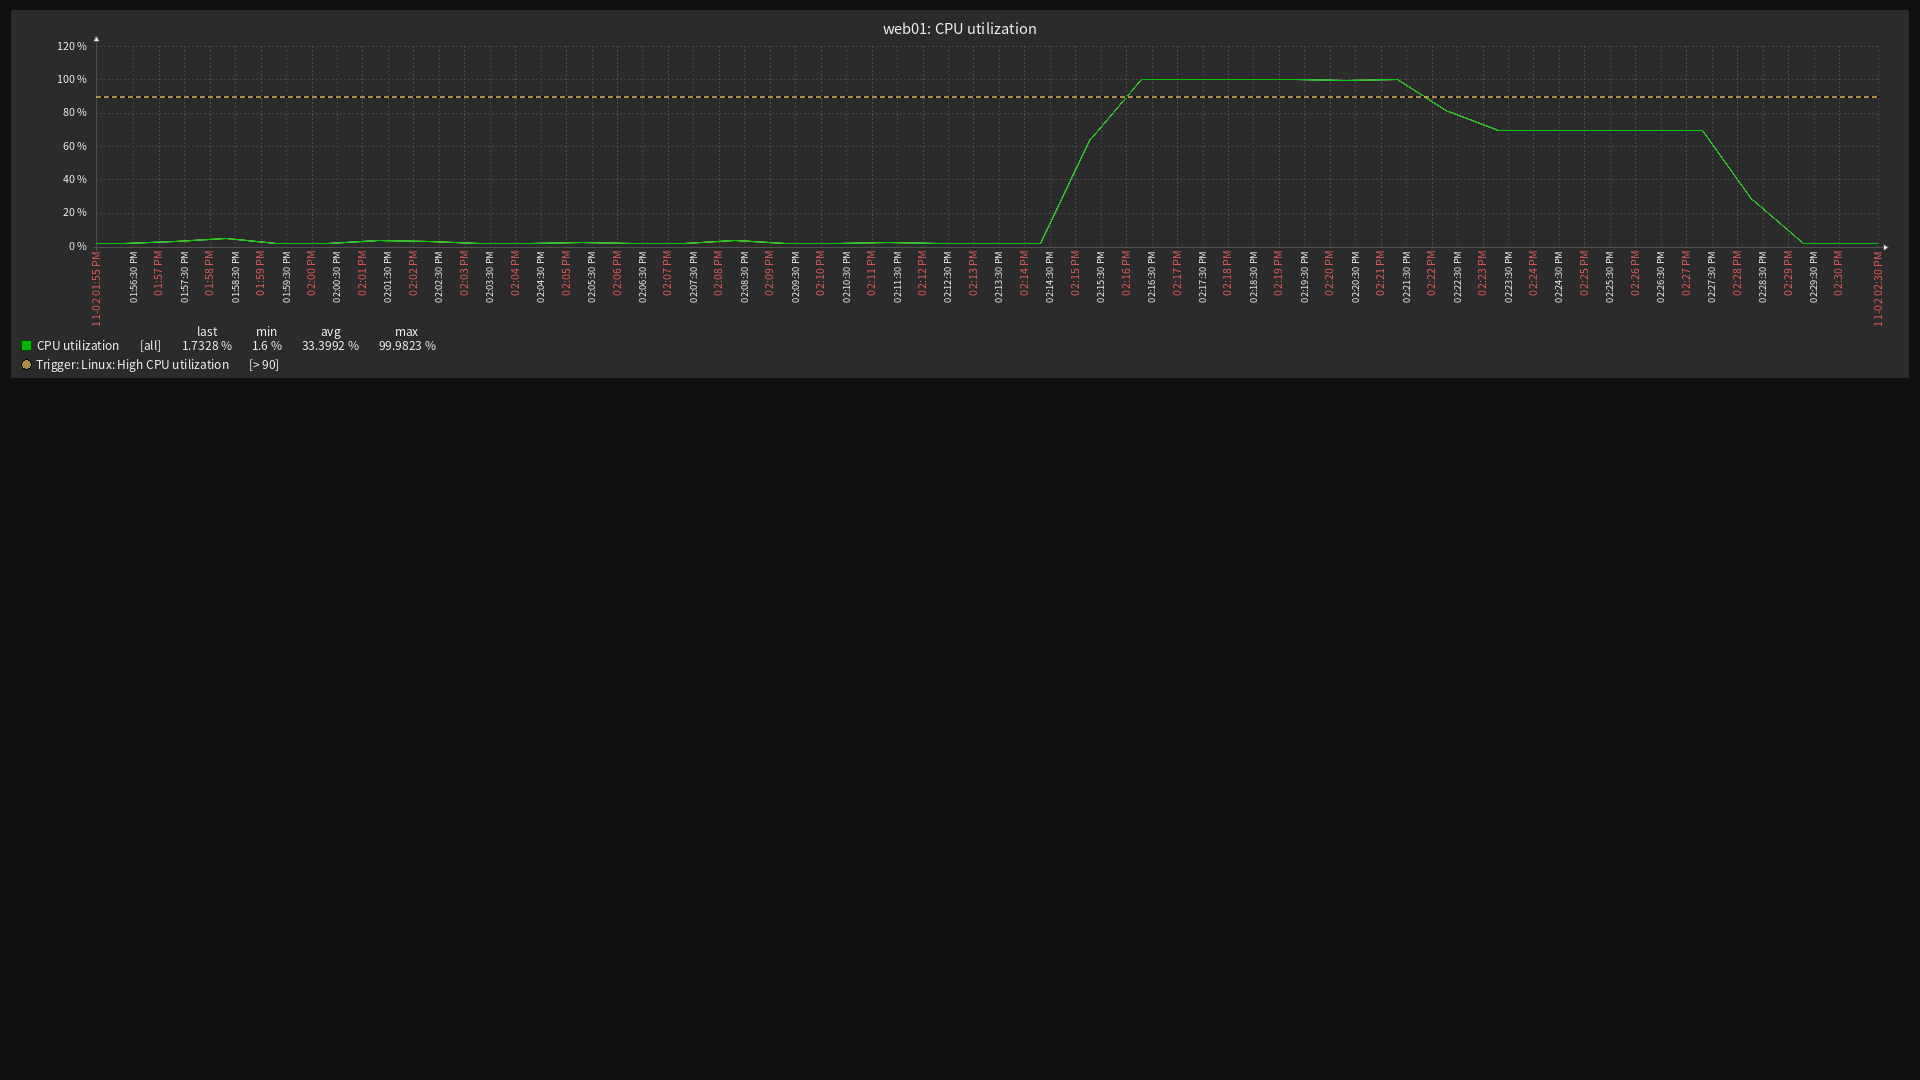
| Time (PST) | CPU | Stock (>90%, 5m) | Hysteresis (80/60) |
|---|---|---|---|
| 14:19 | 100% | OK | PROBLEM |
| 14:21 | 100% | PROBLEM | PROBLEM |
| 14:22 | 81%, then 70% | RESOLVED | still PROBLEM |
| 14:30 | idle | OK | RESOLVED |
The stock trigger called it fixed at 14:22 while the box was still at 70%. A load that moves between 85% and 95% would open and close it over and over. The hysteresis trigger stayed open through the plateau and closed only once CPU was well clear. The same pattern works for the router CPU items in the Cisco template.
Checklist
- Poll the important links fast (10s) on a single item, and leave the discovered interfaces at their defaults.
- Count OSPF neighbours, because their rows vanish. Discover BGP peers, because theirs stay.
- Use
#2or more for routing triggers, and allow for the time adjacencies take to come back. - Give flap and CPU triggers a recovery expression.
- Make routing depend on the link, and the far end depend on the near end's link.
- After changing a prototype, run the discovery rule.
- Tag everything with
scopeandcomponent.
Next in the series
Fewer, better problems are worth nothing if nobody hears about them. Next: email alert actions with escalation steps, recovery and acknowledgement messages.
Now live: Zabbix email alerts with escalation, tested against a real failure.