
Grafana draws pictures. It does not go out and poll anything. If you want a system that actually walks SNMP tables, runs agent checks, evaluates triggers and sends you an alert at two in the morning, you want Zabbix underneath it. This guide puts Zabbix 7.0 LTS on an Ubuntu Server box that is already running Grafana, using the official Docker images, with both platforms coexisting on the same host and neither one stepping on the other.
Everything here came off the same lab machine used in the Grafana Enterprise install guide: an Ubuntu 26.04 LTS VM at 192.168.88.157 with 15 GB RAM and 6 vCPU. Grafana 13.2.0 was already live on port 3000 before any of this started, and it stayed live throughout.
Why Docker and not apt
This deserves an honest answer rather than a hand-wave, because the obvious move is to add Zabbix's APT repository the same way you added Grafana's.
I tried that first. On Ubuntu 26.04, whose codename is resolute, the official Zabbix release repository contains no compiled binaries at all:
j@ubnt:~$ curl -s https://repo.zabbix.com/zabbix/8.0/release/ubuntu/dists/resolute/Release | grep -E '^(Architectures|Components)'
Architectures: all
Components: main
Architectures: all with no amd64 means architecture-independent metadata only. The zabbix-release package installs three sources, and the only one carrying real server packages is the unstable channel:
j@ubnt:~$ apt-cache policy zabbix-server-mysql
zabbix-server-mysql:
  Candidate: 2:8.0.0~beta2-1+ubuntu26.04
        500 https://repo.zabbix.com/zabbix/8.0/unstable/ubuntu resolute/main amd64 Packages
Beta software is not what you want under a monitoring platform. Borrowing the Ubuntu 24.04 packages does not rescue it either, because 26.04 ships PHP 8.5 while the 24.04 Zabbix frontend targets PHP 8.3:
j@ubnt:~$ apt-cache policy php-fpm | head -3
php-fpm:
  Installed: (none)
  Candidate: 2:8.5+99ubuntu1
The containers sidestep all of it. The official images bundle their own PHP and their own dependency tree, so the host OS version stops mattering. If your host is Ubuntu 22.04 or 24.04 and you would rather use apt, Zabbix's own documentation covers that path and it works fine. On a release this new, containers are the pragmatic answer.
Pick 7.0, not 7.4 or 8.0
Zabbix runs two release tracks and the numbering does not make it obvious which is which:
Standard releases arrive every six months and are supported for twelve. LTS releases arrive every eighteen months and are supported for five years. A 7.x number tells you nothing about which track you are on, so check the lifecycle page rather than assuming the highest number is the safest.
Planning the ports so Grafana keeps working
Two monitoring platforms on one host is fine, but only if you decide who owns which port before you start. Here is the allocation used:
Port 80 is left empty on purpose. The moment you want a real hostname and a certificate, you put one reverse proxy on 80 and 443 and have it front both 3000 and 8080. If you had let the Zabbix frontend grab port 80 you would be unpicking that later.
MySQL is not published to the host at all. Nothing outside the compose network needs to reach it, so it only listens on the stack's internal bridge.
Step 0: Give yourself disk before the database arrives
Check this before anything else. The Ubuntu Server installer, left on defaults, allocates only about half your volume group to the root logical volume:
j@ubnt:~$ sudo vgs
  VG        #PV #LV #SN Attr   VSize   VFree
  ubuntu-vg   1   1   0 wz--n- <48.00g 24.00g
24 GB sitting unallocated. A Zabbix database grows with hosts multiplied by items multiplied by how long you keep history, and it is the least predictable thing on the box. Claim the space now, while the filesystem is empty and the operation is trivial:
sudo lvextend -l +100%FREE /dev/ubuntu-vg/ubuntu-lv
sudo resize2fs /dev/ubuntu-vg/ubuntu-lv
Size of logical volume ubuntu-vg/ubuntu-lv changed from <24.00 GiB (6143 extents) to <48.00 GiB (12287 extents).
Logical volume ubuntu-vg/ubuntu-lv successfully resized.
j@ubnt:~$ df -h /
Filesystem Size Used Avail Use% Mounted on
/dev/mapper/ubuntu--vg-ubuntu--lv 48G 9.9G 36G 22% /Both commands are online operations. Nothing unmounts, nothing reboots.
Step 1: Install Docker
Use Docker's own repository rather than Ubuntu's docker.io package, because you want the compose plugin and a current engine. Same keyring pattern as the Grafana install:
sudo install -m 0755 -d /etc/apt/keyrings
sudo curl -fsSL https://download.docker.com/linux/ubuntu/gpg -o /etc/apt/keyrings/docker.asc
sudo chmod a+r /etc/apt/keyrings/docker.asc

. /etc/os-release
echo "deb [arch=amd64 signed-by=/etc/apt/keyrings/docker.asc] https://download.docker.com/linux/ubuntu $VERSION_CODENAME stable" \
  | sudo tee /etc/apt/sources.list.d/docker.list

sudo apt-get update
sudo apt-get install -y docker-ce docker-ce-cli containerd.io docker-buildx-plugin docker-compose-plugin
Sourcing /etc/os-release saves you hardcoding the codename. Unlike Zabbix, Docker does publish native packages for 26.04:
j@ubnt:~$ apt-cache policy docker-ce | head -3
docker-ce:
  Installed: (none)
  Candidate: 5:29.7.2-1~ubuntu.26.04~resolute

j@ubnt:~$ docker --version
Docker version 29.7.2, build a7dcaa6
j@ubnt:~$ docker compose version
Docker Compose version v5.5.0
Add yourself to the docker group so you are not typing sudo all day. It takes effect on your next login:
sudo usermod -aG docker $USERStep 2: Write the compose file
Four services: the database, the Zabbix server, the web frontend, and an agent so the box monitors itself. Create /opt/zabbix/docker-compose.yml:
name: zabbix

services:
  mysql:
    image: mysql:8.4
    container_name: zabbix-mysql
    restart: unless-stopped
    command:
      - --character-set-server=utf8mb4
      - --collation-server=utf8mb4_bin
      - --log_bin_trust_function_creators=1
    environment:
      MYSQL_DATABASE: zabbix
      MYSQL_USER: zabbix
      MYSQL_PASSWORD: ${MYSQL_PASSWORD}
      MYSQL_ROOT_PASSWORD: ${MYSQL_ROOT_PASSWORD}
    volumes:
      - mysql-data:/var/lib/mysql

  zabbix-server:
    image: zabbix/zabbix-server-mysql:7.0-ubuntu-latest
    container_name: zabbix-server
    restart: unless-stopped
    depends_on:
      - mysql
    environment:
      DB_SERVER_HOST: mysql
      MYSQL_DATABASE: zabbix
      MYSQL_USER: zabbix
      MYSQL_PASSWORD: ${MYSQL_PASSWORD}
      MYSQL_ROOT_PASSWORD: ${MYSQL_ROOT_PASSWORD}
    ports:
      - '10051:10051'

  zabbix-web:
    image: zabbix/zabbix-web-nginx-mysql:7.0-ubuntu-latest
    container_name: zabbix-web
    restart: unless-stopped
    depends_on:
      - mysql
      - zabbix-server
    environment:
      ZBX_SERVER_HOST: zabbix-server
      DB_SERVER_HOST: mysql
      MYSQL_DATABASE: zabbix
      MYSQL_USER: zabbix
      MYSQL_PASSWORD: ${MYSQL_PASSWORD}
      PHP_TZ: America/Los_Angeles
    ports:
      - '8080:8080'

  zabbix-agent:
    image: zabbix/zabbix-agent2:7.0-ubuntu-latest
    container_name: zabbix-agent
    restart: unless-stopped
    environment:
      ZBX_HOSTNAME: Zabbix server
      ZBX_SERVER_HOST: zabbix-server
    ports:
      - '10050:10050'

volumes:
  mysql-data:
Several choices in there are worth explaining rather than copying blindly.
The three MySQL flags are not optional. Zabbix requires utf8mb4 with the utf8mb4_bin collation, and the schema import creates stored functions, which MySQL refuses under binary logging unless log_bin_trust_function_creators is on. Miss any of them and the schema import fails in a way that is tedious to diagnose.
Services reach each other by service name. DB_SERVER_HOST: mysql and ZBX_SERVER_HOST: zabbix-server work because compose puts everything on one network with DNS. This matters again in a moment, in the gotcha section.
restart: unless-stopped on all four is what makes the stack come back after a host reboot. It is the container equivalent of systemctl enable.
The named mysql-data volume is your database. Everything else in this stack is disposable. That volume is not.
Passwords go in /opt/zabbix/.env beside the compose file, so they are not sitting in a file you might paste into a ticket:
MYSQL_PASSWORD=YourZabbixDbPassword
MYSQL_ROOT_PASSWORD=YourRootPassword
sudo chmod 600 /opt/zabbix/.envValidate before you launch. config --quiet prints nothing and exits zero when the file is sound:
cd /opt/zabbix
docker compose config --quiet && echo 'COMPOSE VALID'
Step 3: Bring it up
cd /opt/zabbix
docker compose up -d
First run pulls roughly a gigabyte of images. When it settles:
j@ubnt:~$ docker ps --format 'table {{.Names}}\t{{.Status}}\t{{.Ports}}'
NAMES           STATUS                    PORTS
zabbix-web      Up 33 seconds (healthy)   0.0.0.0:8080->8080/tcp, [::]:8080->8080/tcp, 8443/tcp
zabbix-server   Up 33 seconds             0.0.0.0:10051->10051/tcp, [::]:10051->10051/tcp
zabbix-agent    Up 34 seconds             0.0.0.0:10050->10050/tcp, [::]:10050->10050/tcp, 31999/tcp
zabbix-mysql    Up 34 seconds             3306/tcp, 33060/tcp
Note zabbix-mysql shows 3306/tcp with no 0.0.0.0-> prefix. The port is exposed inside the stack but not published to the host, which is exactly what you want.
The schema import runs by itself on first start. Watch it:
j@ubnt:~$ docker logs zabbix-server
2026-08-19T20:49:13Z [info]: * DB_SERVER_HOST: mysql
2026-08-19T20:49:13Z [info]: * DB_SERVER_PORT: 3306
2026-08-19T20:49:13Z [info]: * DB_SERVER_DBNAME: zabbix
2026-08-19T20:49:13Z [info]: **** MySQL server is not available. Waiting 5 seconds...
2026-08-19T20:49:18Z [info]: **** MySQL server is not available. Waiting 5 seconds...
2026-08-19T20:49:39Z [info]: ** Creating 'zabbix' user in MySQL database
2026-08-19T20:49:39Z [info]: ** Creating 'zabbix' schema in MySQL
Those "MySQL server is not available" lines are normal and self-resolving. depends_on waits for the container to start, not for mysqld to finish initializing and accept connections, so the Zabbix entrypoint polls until it can connect. It retried for about 26 seconds here. Only worry if it is still looping after a couple of minutes.
Confirm the schema landed. Zabbix 7.0 creates a little over 200 tables:
j@ubnt:~$ docker exec zabbix-mysql mysql -uzabbix -p'YourZabbixDbPassword' \
    -e 'select count(*) as tables_created from information_schema.tables where table_schema="zabbix";'
tables_created
203
Step 4: Verify, including that Grafana is untouched
Both web interfaces should answer:
j@ubnt:~$ curl -s -o /dev/null -w 'zabbix web  HTTP %{http_code}\n' http://192.168.88.157:8080/
zabbix web  HTTP 200
j@ubnt:~$ curl -s -o /dev/null -w 'grafana     HTTP %{http_code}\n' http://192.168.88.157:3000/login
grafana     HTTP 200
The Zabbix API will tell you the exact version without opening a browser:
j@ubnt:~$ curl -s -X POST -H 'Content-Type: application/json-rpc' \
    -d '{"jsonrpc":"2.0","method":"apiinfo.version","params":{},"id":1}' \
    http://192.168.88.157:8080/api_jsonrpc.php
{"jsonrpc":"2.0","result":"7.0.29","id":1}
And the listener table shows the two platforms side by side with no overlap:
j@ubnt:~$ sudo ss -ltnp | grep -E '3000|8080|10050|10051'
LISTEN 0 4096   0.0.0.0:8080    0.0.0.0:*  users:(("docker-proxy",pid=7782,fd=8))
LISTEN 0 4096   0.0.0.0:10051   0.0.0.0:*  users:(("docker-proxy",pid=7622,fd=8))
LISTEN 0 4096   0.0.0.0:10050   0.0.0.0:*  users:(("docker-proxy",pid=7489,fd=8))
LISTEN 0 4096         *:3000          *:*  users:(("grafana",pid=3365,fd=86))
Grafana holds 3000 as a native process, Docker holds the rest through docker-proxy. Nothing had to move.
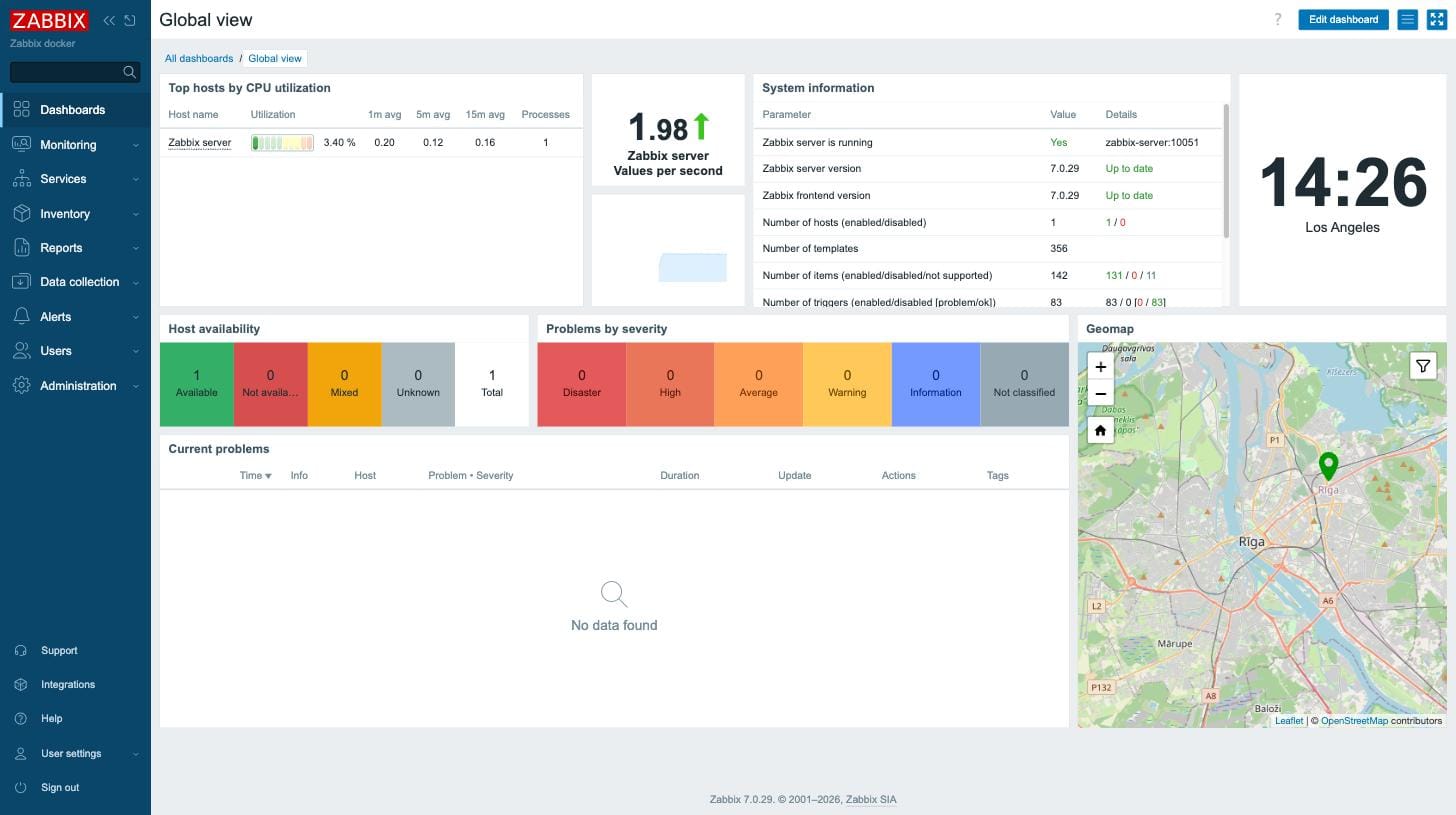
zabbix-server:10051, version 7.0.29 on both server and frontend, and one host Available.Logging in to Zabbix
Browse to http://<your-server-ip>:8080, which was http://192.168.88.157:8080 here.
Two things catch people. The username is Admin with a capital A and it is case sensitive, so admin fails. And unlike Grafana, Zabbix does not force a password change at first login. It will happily leave Admin / zabbix in place forever. Change it immediately under User settings, then Profile, then Change password.
You can prove the credentials work from the command line before you ever open a browser. A successful user.login returns a session token:
j@ubnt:~$ curl -s -X POST -H 'Content-Type: application/json-rpc' \
    -d '{"jsonrpc":"2.0","method":"user.login","params":{"username":"Admin","password":"zabbix"},"id":1}' \
    http://192.168.88.157:8080/api_jsonrpc.php
{"jsonrpc":"2.0","result":"ae84e83c11d4fe2400164547852f5327","id":1}
Admin with a capital A, password zabbix, and no prompt to change it.The gotcha: the built-in host cannot reach its agent
This one will bite you within minutes of logging in, and the error message does not point at the cause.
Zabbix ships with a host called "Zabbix server" that monitors the Zabbix installation itself, and its agent interface is preconfigured as 127.0.0.1. That is correct for a traditional install where server and agent are on the same machine. In a compose stack the agent is a separate container, so 127.0.0.1 is the server container's own loopback, where nothing is listening. The log fills up:
429:20260819:205049.443 Zabbix agent item "system.swap.size[,free]" on host "Zabbix server" failed: first network error, wait for 15 seconds
429:20260819:205104.444 Zabbix agent item "system.users.num" on host "Zabbix server" failed: another network error, wait for 15 seconds
429:20260819:205134.448 temporarily disabling Zabbix agent checks on host "Zabbix server": interface unavailable
The fix is to point that interface at the agent's service name and switch it from IP to DNS. In the UI: Data collection, then Hosts, then Zabbix server, then the Interfaces section. Set "Connect to" to DNS and the DNS name to zabbix-agent, matching the service name in your compose file.
Before and after, via the API:
BEFORE: [{"interfaceid":"1","ip":"127.0.0.1","dns":"","useip":"1","port":"10050"}]
AFTER:  [{"interfaceid":"1","ip":"","dns":"zabbix-agent","useip":"0","port":"10050"}]
Zabbix re-tests a failed interface on a timer, so give it up to a minute. You are looking for this line:
429:20260819:205234.448 enabling Zabbix agent checks on host "Zabbix server": interface became availableAfter which real data starts landing:
system.cpu.load[all,avg1]          state=0 last=0.434082
system.cpu.load[all,avg5]          state=0 last=0.773926
system.cpu.load[all,avg15]         state=0 last=0.474609
system.cpu.num                     state=0 last=6
state=0 means supported and collecting. Six CPUs, which matches the host, so the agent really is reporting the machine and not something imaginary.
The other log noise, which is not a problem
You will also see a run of these and they are harmless:
item "Zabbix server:zabbix[process,vmware collector,avg,busy]" became not supported: No "vmware collector" processes started.
item "Zabbix server:zabbix[process,ipmi manager,avg,busy]" became not supported: No "ipmi manager" processes started.
item "Zabbix server:zabbix[process,report writer,avg,busy]" became not supported: No "report writer" processes started.
The bundled template monitors internal Zabbix processes, including ones that only spawn when you enable VMware collection, IPMI polling or scheduled reports. You have not enabled those, so the processes do not exist, so the items report unsupported. Ignore them, or disable those items on the template if the noise bothers you.
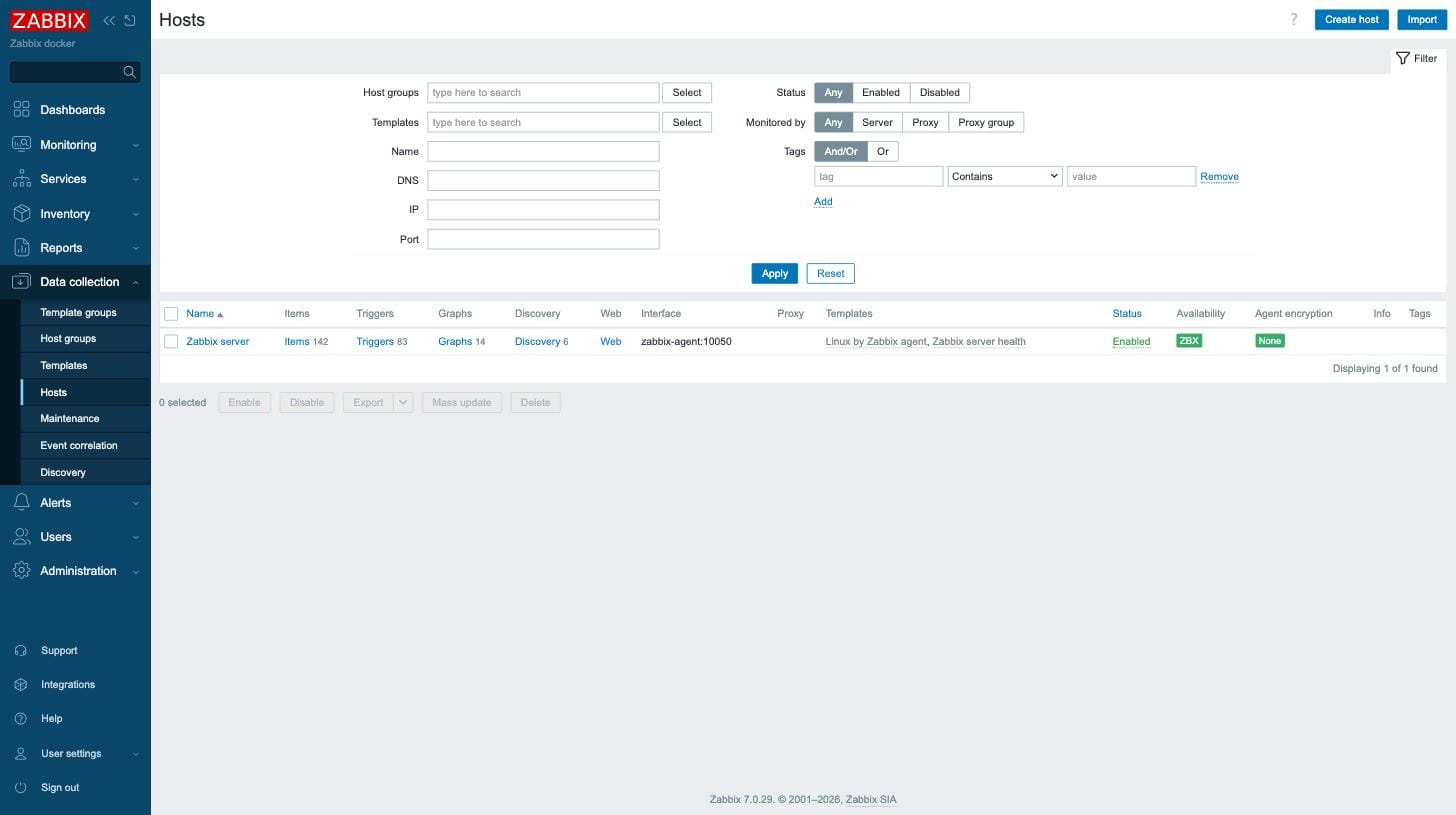
zabbix-agent:10050 rather than 127.0.0.1, and the ZBX availability tag is green.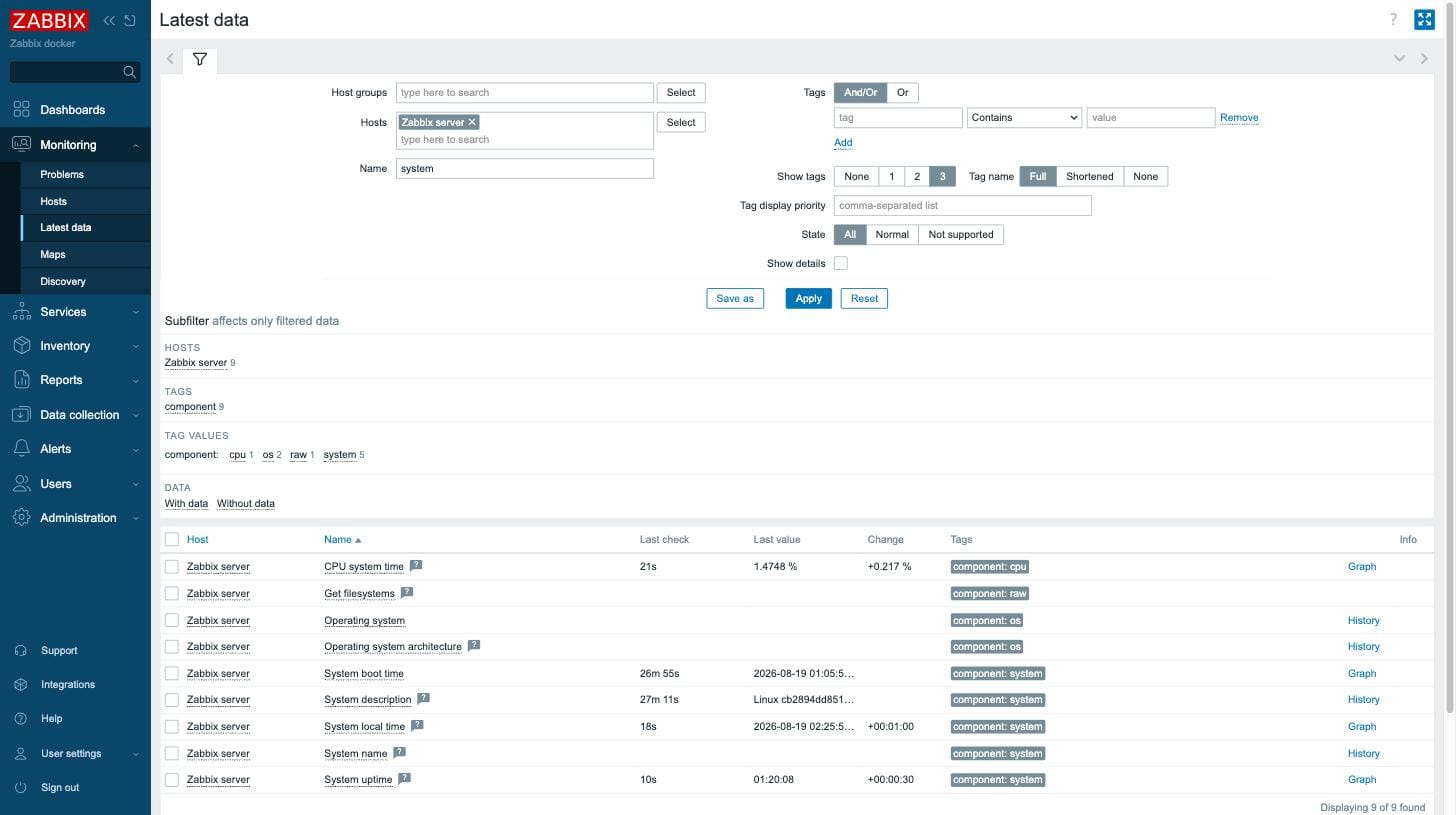
What it actually costs to run both
The interesting question when you stack two monitoring platforms on one box. With Grafana and the full Zabbix stack running:
j@ubnt:~$ free -h
               total        used        free      shared  buff/cache   available
Mem:            15Gi       1.9Gi       7.4Gi        19Mi       6.2Gi        13Gi

j@ubnt:~$ docker stats --no-stream --format 'table {{.Name}}\t{{.MemUsage}}\t{{.CPUPerc}}'
NAME            MEM USAGE / LIMIT     CPU %
zabbix-web      49.46MiB / 15.11GiB   0.01%
zabbix-server   112MiB / 15.11GiB     1.02%
zabbix-agent    11.11MiB / 15.11GiB   0.51%
zabbix-mysql    733.2MiB / 15.11GiB   3.65%
The whole Zabbix stack is about 900 MB, and MySQL is 80 percent of that. Grafana adds roughly 100 MB. Total footprint under 1.1 GB, leaving 13 GB available on a 15 GB box. Two monitoring platforms is not the resource problem people expect it to be, at least until you are polling thousands of items.
j@ubnt:~$ df -h /
Filesystem                         Size  Used Avail Use% Mounted on
/dev/mapper/ubuntu--vg-ubuntu--lv   48G   14G   32G  30% /
Day-two commands
All of these run from /opt/zabbix, because compose looks for the file in your working directory:
The distinction between the last two is worth internalizing before you are tired and troubleshooting at midnight. -v is not a verbose flag here.
Because the images are pinned to 7.0-ubuntu-latest rather than latest, a pull gets you patch releases within the 7.0 LTS line and will never silently jump you to 7.4 or 8.0. Major upgrades stay a deliberate act, which is the whole point of running LTS.
What to back up
Two things, and only two things:
- The
zabbix_mysql-datavolume. Every host, template, trigger and item of history you have. Compose prefixes volume names with the project name, somysql-databecomeszabbix_mysql-dataon disk. - The
/opt/zabbix/directory. Your compose file and your.env. Small, and it is the recipe for rebuilding the rest.
A logical dump is easier to restore across versions than copying the volume:
docker exec zabbix-mysql mysqldump -uroot -p'YourRootPassword' \
  --single-transaction zabbix | gzip > zabbix-$(date +%F).sql.gz
What to do next
You now have polling and dashboards on the same host, which is the point of doing it this way:
- Wire Zabbix into Grafana. The
alexanderzobnin-zabbix-appplugin lets Grafana query Zabbix directly, so Zabbix does collection, triggers and alerting while Grafana does the visualization. That is the payoff for running both. - Put a reverse proxy on 80 and 443 fronting 3000 and 8080, which is why you kept port 80 free.
- Add real devices. SNMP against switches and routers is what Zabbix is best at, and the bundled network device templates cover most vendors out of the box.
- Change the Admin password if you skipped past it earlier. Zabbix will not remind you.
Key takeaways
- Check whether your distro actually has GA Zabbix packages before committing to apt. On Ubuntu 26.04 the release repo is
Architectures: alland the only binaries are beta. - Zabbix 7.0 is LTS and supported to 2029. 7.4 is a Standard release with a twelve month life. The bigger number is not the safer one.
- Decide port ownership before you install anything. Grafana on 3000, Zabbix frontend on 8080, port 80 kept free for a future reverse proxy.
- Extend the root logical volume first. The Ubuntu installer leaves about half your volume group unallocated, and a monitoring database is the wrong thing to run out of disk on.
- MySQL needs
utf8mb4,utf8mb4_binandlog_bin_trust_function_creators=1or the schema import fails. - Log in as
Adminwith a capital A, passwordzabbix, and change it yourself because Zabbix will not make you. - Repoint the built-in "Zabbix server" host's agent interface from
127.0.0.1to the DNS namezabbix-agent, or every agent check on it fails. - Both platforms together use about 1.1 GB of RAM. Running them on one host is entirely reasonable.