
Grafana is the dashboard layer for almost every monitoring stack you are likely to build: Prometheus for metrics, Loki for logs, InfluxDB for time series, SNMP pollers for network gear. Before any of that is useful you need a Grafana server running somewhere you can reach it. This guide walks through installing Grafana Enterprise on a stock Ubuntu Server box from the official APT repository, starting it under systemd, proving it is actually up, and logging in for the first time.
Every command and every block of output below came off a real machine: a freshly built Ubuntu 26.04 LTS VM in the PingLabz lab at 192.168.88.157, 15 GB RAM, nothing else installed on it. Grafana 13.2.0 was the current stable release at the time of writing. If you are on Ubuntu 22.04 or 24.04, or on Debian, the steps are identical.
Enterprise or OSS? Install Enterprise
This trips people up, so get it out of the way first. Grafana ships two Debian packages from the same repository:
Installing grafana-enterprise does not start a trial, does not phone home for a license, and does not nag you. Without a license key it behaves exactly like the OSS build. That is why Grafana themselves call it the recommended edition, and it is what this guide installs.
What you need before you start
- An Ubuntu Server host (22.04, 24.04 or 26.04) or Debian, with a user who has sudo
- Outbound HTTPS to
apt.grafana.com - Roughly 2 GB of free disk. The package pulls 398 MB and expands to about 1.45 GB
- TCP 3000 reachable from wherever you plan to browse from
Grafana itself is light on RAM once it settles (this install idles at roughly 76 MB), so a 2 GB VM is plenty for a lab. Here is the box used throughout:
j@ubnt:~$ hostname; . /etc/os-release; echo $PRETTY_NAME; uname -r
ubnt
Ubuntu 26.04 LTS
7.0.0-30-generic

j@ubnt:~$ ip -br addr
lo               UNKNOWN        127.0.0.1/8 ::1/128
ens160           UP             192.168.88.157/24 metric 100 fe80::20c:29ff:fe24:20a3/64
ens192           UP             fe80::20c:29ff:fe24:20ad/64

j@ubnt:~$ free -h | head -2
               total        used        free      shared  buff/cache   available
Mem:            15Gi       596Mi        14Gi       1.2Mi       291Mi        14Gi
Step 1: Install the prerequisites
You need wget to pull the signing key and gnupg to handle it. On a minimal install these may not be present.
sudo apt-get install -y apt-transport-https software-properties-common wget gnupgOn a current Ubuntu release most of this is already installed and apt will tell you so. That is fine, the command is idempotent.
Step 2: Import Grafana's GPG signing key
Modern APT wants repository keys in /etc/apt/keyrings/ and referenced explicitly by the repo line, not dumped into the global trusted keyring with the long-deprecated apt-key add. Do it the current way:
sudo mkdir -p /etc/apt/keyrings
sudo wget -q -O /etc/apt/keyrings/grafana.asc https://apt.grafana.com/gpg-full.key
sudo chmod 644 /etc/apt/keyrings/grafana.asc
Confirm it landed and is world-readable (APT runs unprivileged helpers, so mode 644 matters):
j@ubnt:~$ ls -l /etc/apt/keyrings/grafana.asc
-rw-r--r-- 1 root root 7881 Aug 22  2025 /etc/apt/keyrings/grafana.asc
If that file is zero bytes, your wget failed silently behind a proxy. Re-run it without -q and read the error before moving on.
Step 3: Add the Grafana repository
One line, pointing at the key you just saved:
echo "deb [signed-by=/etc/apt/keyrings/grafana.asc] https://apt.grafana.com stable main" \
  | sudo tee /etc/apt/sources.list.d/grafana.list
A note on tee versus tee -a: Grafana's own documentation uses -a to append. If you run the command twice with -a you end up with a duplicate entry and apt will warn about it on every update. Plain tee overwrites, which is what you want on a first install.
Now refresh the package lists:
j@ubnt:~$ sudo apt-get update
...
Get:2 https://apt.grafana.com stable InRelease [7,661 B]
Get:4 https://apt.grafana.com stable/main amd64 Packages [454 kB]
Check what version you are about to get. Pipe this one, because the repo carries every release back to 5.4.0 and the full list is about 400 lines:
j@ubnt:~$ apt-cache policy grafana-enterprise | head -8
grafana-enterprise:
  Installed: (none)
  Candidate: 13.2.0
  Version table:
     13.2.0 500
        500 https://apt.grafana.com stable/main amd64 Packages
     13.1.4 500
        500 https://apt.grafana.com stable/main amd64 Packages
Because every old release is in the repo, pinning a specific version is easy if you need to match an existing environment: sudo apt-get install grafana-enterprise=12.4.9.
Step 4: Install Grafana Enterprise
sudo apt-get install -y grafana-enterpriseThis is the slow step. The package is 398 MB on the wire and 1.45 GB unpacked, because it bundles the frontend build plus every core data source plugin:
The following NEW packages will be installed:
  grafana-enterprise
0 upgraded, 1 newly installed, 0 to remove and 0 not upgraded.
Need to get 398 MB of archives.
After this operation, 1,446 MB of additional disk space will be used.
Get:1 https://apt.grafana.com stable/main amd64 grafana-enterprise amd64 13.2.0 [398 MB]
Fetched 398 MB in 16s (24.8 MB/s)
Selecting previously unselected package grafana-enterprise.
Preparing to unpack .../grafana-enterprise_13.2.0_amd64.deb ...
Unpacking grafana-enterprise (13.2.0) ...
When it finishes, the postinstall script tells you exactly what it did not do:
### NOT starting on installation, please execute the following statements to
### configure grafana to start automatically using systemd
 sudo /bin/systemctl daemon-reload
 sudo /bin/systemctl enable grafana-server
### You can start grafana-server by executing
 sudo /bin/systemctl start grafana-server
That is deliberate. The Debian package installs Grafana and creates the grafana system user, but leaves the service stopped and disabled so you can edit grafana.ini before anything binds a port. If you browse to port 3000 right now you will get connection refused, and nothing is wrong.
Step 5: Enable and start the service
enable --now does both halves in one command: sets it to start at boot and starts it immediately.
sudo systemctl daemon-reload
sudo systemctl enable --now grafana-server
Created symlink '/etc/systemd/system/multi-user.target.wants/grafana-server.service'
-> '/usr/lib/systemd/system/grafana-server.service'.That symlink is the part that matters for surviving a reboot. Check the service:
j@ubnt:~$ systemctl status grafana-server --no-pager | head -12
* grafana-server.service - Grafana instance
     Loaded: loaded (/usr/lib/systemd/system/grafana-server.service; enabled; preset: enabled)
     Active: active (running) since Wed 2026-08-19 20:18:32 UTC; 12s ago
       Docs: http://docs.grafana.org
   Main PID: 2889 (grafana)
      Tasks: 10 (limit: 15235)
     Memory: 76.2M (peak: 78M)
        CPU: 7.463s
     CGroup: /system.slice/grafana-server.service
             └─2889 /usr/share/grafana/bin/grafana server --config=/etc/grafana/grafana.ini ...
Two things to read there. Loaded: ... enabled confirms it will come back after a reboot, and Active: active (running) confirms the process is alive right now. Those are separate claims and you want both.
Step 6: Verify it is actually serving
Here is the one gotcha that catches everybody, and it cost me a few confused minutes on this very install. systemd reports active (running) well before Grafana is listening on port 3000. The process forks, then spends 15 to 25 seconds initializing its SQLite database and installing the bundled plugins before it binds anything.
My first health check, run seconds after the service started, returned nothing at all. The service was fine. I was just early. Wait, then check the listener:
j@ubnt:~$ sudo ss -ltnp | grep 3000
LISTEN 0      4096               *:3000            *:*    users:(("grafana",pid=2889,fd=30))
*:3000 means it is bound to all interfaces, not just loopback, which is the default and what you want for a lab server you browse to from your desktop. Now hit the health endpoint, which needs no authentication:
j@ubnt:~$ curl -s http://localhost:3000/api/health
{
  "database": "ok",
  "version": "13.2.0",
  "commit": "f681b1359f6a0b8ecb9f2c49a88ac72b75bde73b",
  "enterpriseCommit": "50fa642a9129991374ed6a19ad771b6f72dbc5c1"
}
Three useful facts in five lines. "database": "ok" means the SQLite backend initialized. "version" confirms what you installed. And enterpriseCommit only appears on the Enterprise binary, so its presence is your proof you got the right package (if you accidentally installed grafana instead, that field is simply absent).
Finally, confirm it answers from off-box, using the server's LAN address rather than localhost:
j@ubnt:~$ curl -s -o /dev/null -w 'HTTP %{http_code}\n' http://192.168.88.157:3000/login
HTTP 200
Logging in for the first time
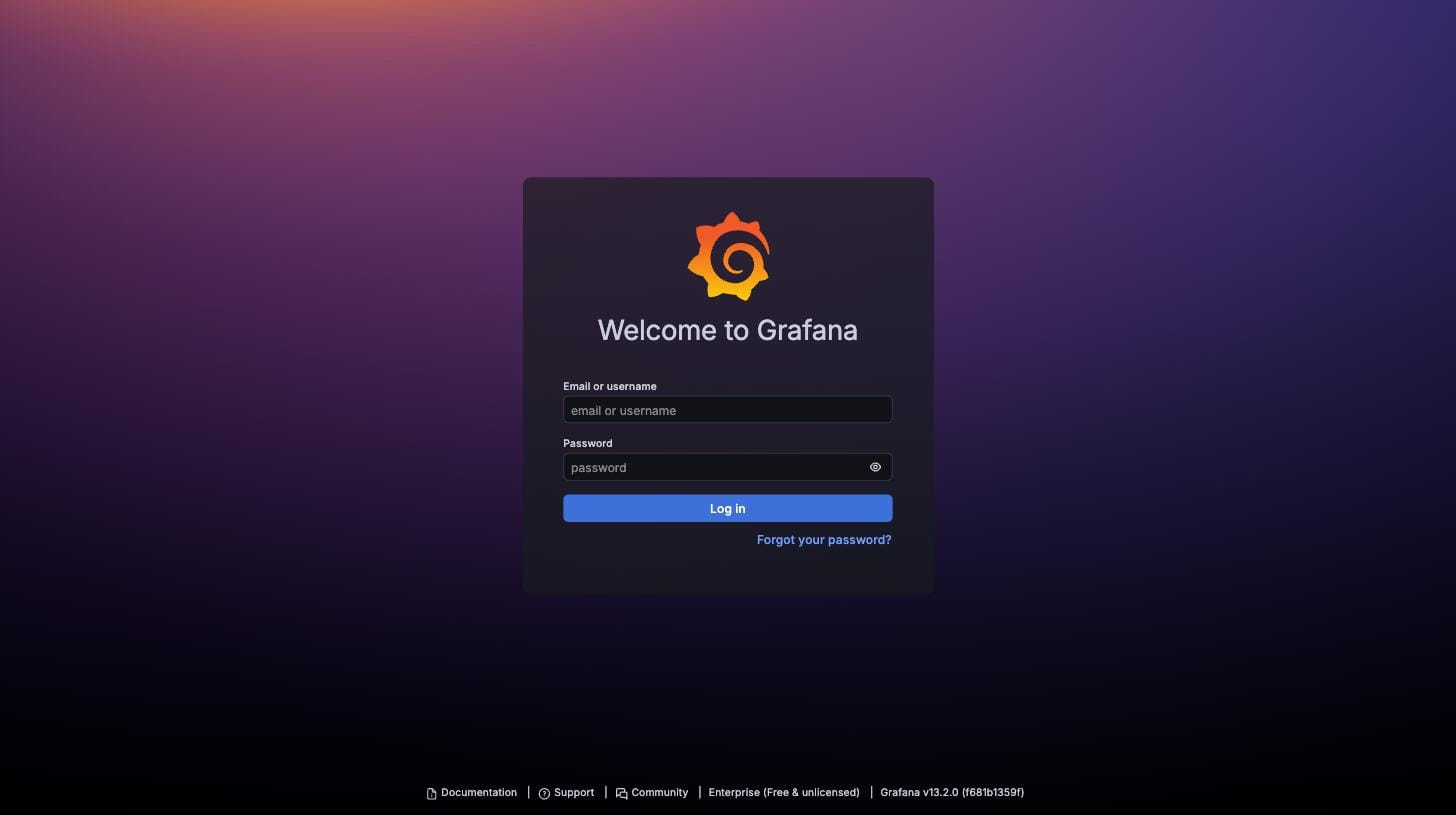
Open a browser and go to:
http://<your-server-ip>:3000For this build that is http://192.168.88.157:3000. Note it is plain HTTP on port 3000, not HTTPS and not port 80. There is no TLS certificate yet and no reverse proxy, so your browser will not show a padlock. That is expected for a fresh install.
The credentials are the same on every new Grafana install:
Log in with admin / admin and Grafana immediately presents a "Update your password" screen. You can click past it, but do not: an admin account with the password admin on a box listening on all interfaces is exactly the kind of thing that gets found by a scanner. Set a real password now.
You can watch the account exist before you ever open a browser. The admin user is created by the first service start, and basic auth against the API works immediately:
j@ubnt:~$ curl -s -u admin:admin http://192.168.88.157:3000/api/users
[{"id":1,"uid":"cfvoo01d8bp4wa","login":"admin","email":"admin@localhost",
  "isAdmin":true,"isDisabled":false,"isProvisioned":false,
  "lastSeenAt":"2026-08-19T20:19:06Z","created":"2026-08-19T20:18:41Z"}]

j@ubnt:~$ curl -s -u admin:admin http://192.168.88.157:3000/api/org
{"id":1,"name":"Main Org.","address":{...}}
That single admin user in "Main Org." is the whole of your Grafana tenancy at this point. Everything you build later, data sources, dashboards, folders, alert rules, hangs off that org.
If you are locked out: reset the admin password from the CLI
Forgotten admin passwords are the most common way people get stuck with a self-hosted Grafana. There is a first-party fix that does not involve editing the database:
sudo grafana cli admin reset-admin-password 'YourNewPassword'Note the syntax. Older guides tell you to run grafana-cli, and it still works in 13.x, but it warns you off:
Deprecation warning: 'grafana-cli' is deprecated and will be removed in a
future release. Use the 'grafana cli' subcommand instead.
So use grafana cli (space, not hyphen) on anything current. If the command complains it cannot find its configuration, point it at the install root explicitly with --homepath /usr/share/grafana.
Setting a different default password before first boot
If you are building this box with Ansible or a cloud-init template and never want admin/admin to exist at all, set the password in /etc/grafana/grafana.ini before the first systemctl start:
[security]
admin_user = admin
admin_password = SomethingBetter
Grafana only reads that on the very first start, when it seeds the database. Changing it afterwards does nothing, because from then on the password lives in SQLite.
Where everything lives
Worth knowing before you start breaking things:
If you only back up one thing, back up /var/lib/grafana/grafana.db. Losing it means losing every dashboard you have built.
Firewall and network access
A default Ubuntu Server install ships with ufw present but switched off, which is why port 3000 was reachable from my desktop with no extra configuration:
j@ubnt:~$ sudo ufw status
Status: inactive
If your build hardens ufw (and on anything but a lab it should), open the port explicitly:
sudo ufw allow 3000/tcp
sudo ufw reload
Better still, restrict it to the subnet you actually browse from:
sudo ufw allow from 192.168.88.0/24 to any port 3000 proto tcpChanging the port or binding to one interface
Both live in the [server] block of /etc/grafana/grafana.ini. The defaults are commented out with semicolons, so uncomment the line as well as changing the value:
[server]
http_addr = 192.168.88.157
http_port = 3000
Setting http_addr pins Grafana to a single interface instead of the *:3000 wildcard you saw earlier. Useful on a multi-homed box where you do not want the dashboard exposed on every network it touches. Restart after any edit:
sudo systemctl restart grafana-serverOne caveat: binding to a port below 1024 (say, running directly on 80) will fail, because the service runs as the unprivileged grafana user. The usual answer is a reverse proxy in front rather than granting the binary extra capabilities.
Troubleshooting the three things that go wrong
Connection refused, but systemd says the service is running
You are almost certainly too early. Grafana needs 15 to 25 seconds after start before it binds port 3000, and on a restart of this install the health endpoint was still silent at 15 seconds and answering by 35. Confirm with sudo ss -ltnp | grep 3000 rather than guessing, and watch what it is doing in the meantime:
sudo journalctl -u grafana-server -fYou will see it downloading and registering bundled plugins during that window, which is exactly where the time goes.
"database is locked (5) (SQLITE_BUSY)" in the log
Alarming, harmless. It shows up only on the very first start while several routines seed the fresh SQLite database at once:
logger=sqlstore.transactions level=info msg="Database locked, sleeping then retrying"
  error="database is locked (5) (SQLITE_BUSY)" retry=1 sleep=369.286us
Note level=info, not error. Grafana retries and moves on. If you see it constantly during normal operation, that is a different problem and a sign you have outgrown SQLite and should move the backend to PostgreSQL or MySQL.
Permission denied reading grafana.ini
/etc/grafana/grafana.ini is mode 0640 owned by root:grafana, so a plain grep as your normal user fails. Use sudo, or add yourself to the grafana group. This is intentional: the file can hold database passwords and SMTP credentials.
Confirming it survives a reboot
The whole point of enable is that the service comes back on its own. Verify both halves rather than trusting one:
j@ubnt:~$ systemctl is-enabled grafana-server; systemctl is-active grafana-server
enabled
active
And after a restart, give it that half a minute and re-check health:
j@ubnt:~$ sudo systemctl restart grafana-server
j@ubnt:~$ sleep 35; curl -s http://localhost:3000/api/health
{
  "database": "ok",
  "version": "13.2.0",
  "commit": "f681b1359f6a0b8ecb9f2c49a88ac72b75bde73b",
  "enterpriseCommit": "50fa642a9129991374ed6a19ad771b6f72dbc5c1"
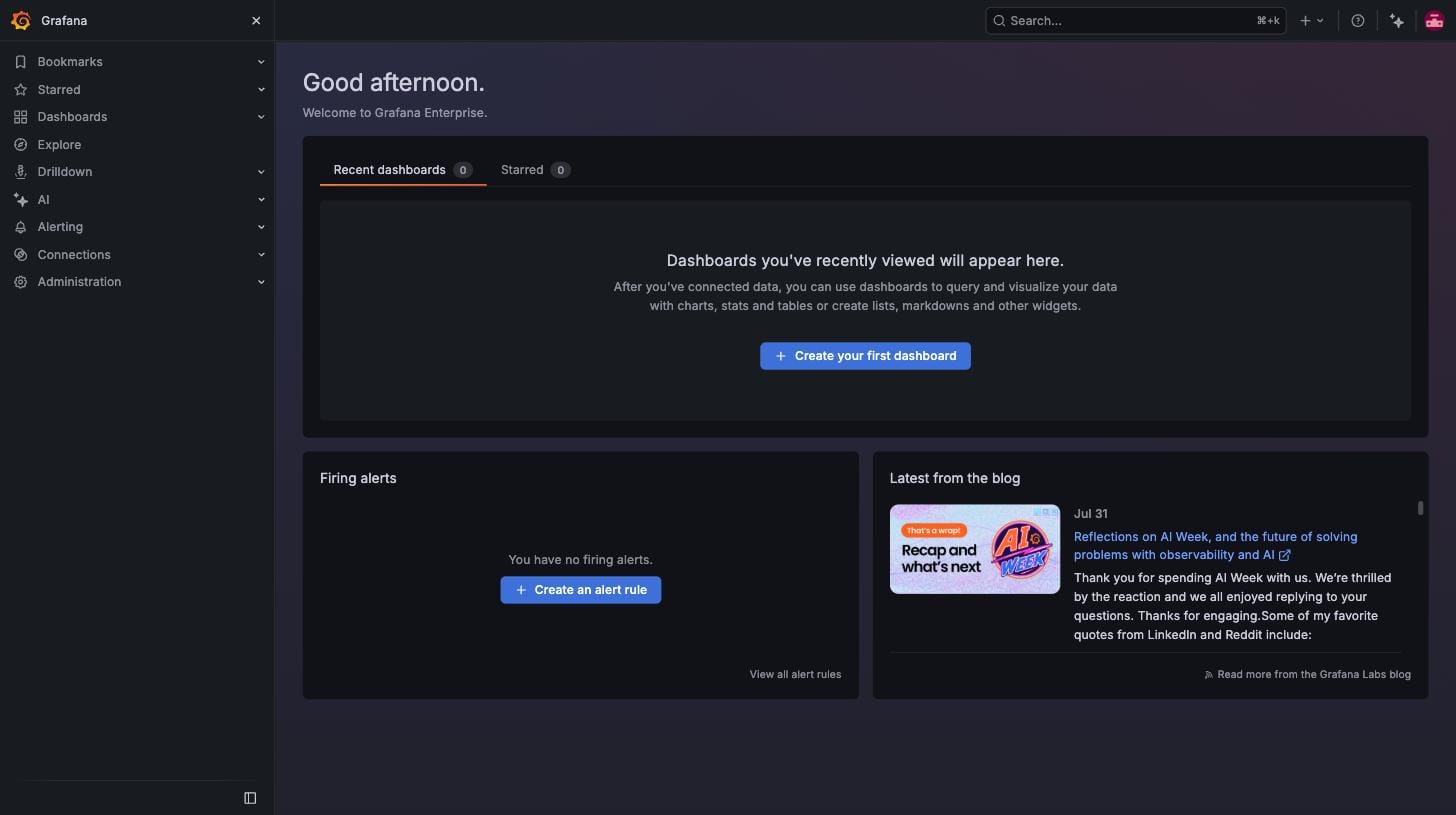
}
What to do next
You now have a working Grafana platform with nothing plugged into it. The natural next steps, roughly in order of usefulness for a network or systems lab:
- Give it something to poll. Grafana visualizes, it does not collect. Running Zabbix 7.0 LTS in Docker on this same server adds SNMP polling, triggers and alerting underneath it.
- Add a data source. Prometheus with node_exporter is the standard starting point for host metrics, and InfluxDB is common for network telemetry.
- Put a reverse proxy in front. Nginx or Caddy on 443 with a certificate gets you off plain HTTP on port 3000 and gives you a hostname instead of an IP.
- Move off SQLite if this will ever be more than a lab. PostgreSQL as the backend is a config change in
[database], and it is much easier to do before you have dashboards to migrate. - Provision as code. YAML files in
/etc/grafana/provisioninglet you define data sources and dashboards in Git rather than clicking them in, which means you can rebuild the box from scratch and get everything back.
Key takeaways
- Install
grafana-enterprise, notgrafana. It is free, needs no license, and is Grafana's recommended default. - Put the signing key in
/etc/apt/keyrings/and reference it withsigned-by=. Do not useapt-key add. - The package deliberately leaves the service stopped and disabled.
systemctl enable --now grafana-serverhandles both. - Give it 15 to 25 seconds after starting before you decide it is broken.
active (running)arrives long before the port is bound. curl -s http://localhost:3000/api/healthis the fastest proof of life, and theenterpriseCommitfield in it confirms you got the Enterprise build.- Log in at
http://<server-ip>:3000withadmin/adminand change the password when prompted. If you get locked out,sudo grafana cli admin reset-admin-passwordfixes it. - Back up
/var/lib/grafana/grafana.db. That single file is every dashboard you will ever build.