
The previous post added Cisco routers and switches to Zabbix over SNMPv3. Now for servers. For Linux, the right tool is Zabbix agent 2. In this post I install it on an Ubuntu 24.04 server, cover passive and active checks, attach the Linux by Zabbix agent template, and break it the two ways everyone breaks it first.
All of this was built in my home lab on Zabbix 7.0.32 (server and agent 2), using the server from the Docker install post. The Zabbix server is 10.66.20.2 and the Linux host, web01, is 10.66.20.31.

Install agent 2
Use Zabbix's own repo, not the distro package, so the agent version matches the server:
wget https://repo.zabbix.com/zabbix/7.0/ubuntu/pool/main/z/zabbix-release/zabbix-release_latest_7.0+ubuntu24.04_all.deb
sudo dpkg -i zabbix-release_latest_7.0+ubuntu24.04_all.deb
sudo apt update
sudo apt install zabbix-agent2
zabbix_agent2 -V | head -1
zabbix_agent2 (Zabbix) 7.0.32Out of the box, /etc/zabbix/zabbix_agent2.conf points at localhost:
Server=127.0.0.1
ServerActive=127.0.0.1
Hostname=Zabbix server
Change all three:
Server=10.66.20.2
ServerActive=10.66.20.2
Hostname=web01
sudo systemctl enable --now zabbix-agent2
sudo systemctl restart zabbix-agent2Passive vs active
These three lines control two separate conversations:
- Passive: the server connects to the agent on TCP 10050 and asks for one value at a time.
Server=is the allow-list of who may ask. - Active: the agent connects to the server on TCP 10051, downloads its list of checks, then pushes results on its own schedule.
ServerActive=is where it connects, andHostname=is how it identifies itself.
Passive is easy to test and gives you the green ZBX badge. Active scales better, works through NAT or when the server can't reach the host, and is the only mode for log monitoring. Agent 2 does both by default. The template you pick decides which checks are used.
Create the host
In Data collection → Hosts → Create host: host name web01 (it must match Hostname= exactly), group Linux servers, template Linux by Zabbix agent, and an Agent interface at 10.66.20.31 port 10050. Or through the API:
{
  "jsonrpc": "2.0", "method": "host.create", "id": 1,
  "params": {
    "host": "web01",
    "groups": [{"groupid": "2"}],
    "templates": [{"templateid": "10001"}],
    "interfaces": [{"type": 1, "main": 1, "useip": 1, "ip": "10.66.20.31", "dns": "", "port": "10050"}]
  }
}
From the server, prove the passive path before you wait on the UI:
zabbix_get -s 10.66.20.31 -k agent.version7.0.32What shows up
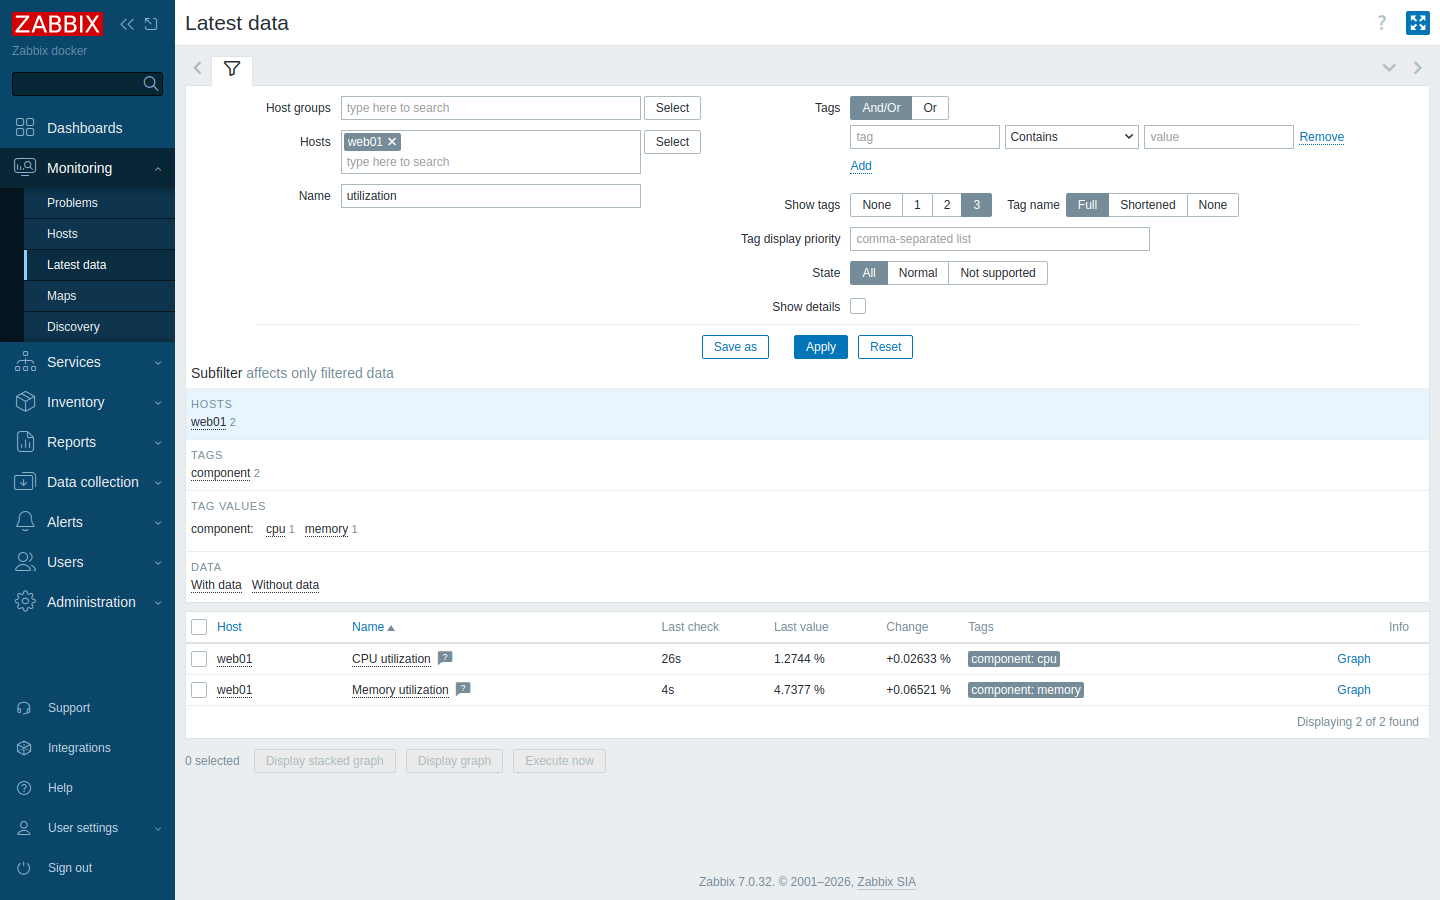
Within a few minutes the template had 73 working items on web01. It discovered network interfaces, block devices and mounted filesystems, and added CPU, memory, swap, load, processes, uptime and the agent's own health. You also get the triggers you'd expect: high CPU, low memory, filesystem space and inodes, the host restarting, and the agent being unreachable.
Switching to active
To run the same monitoring in active mode, replace the template with Linux by Zabbix agent active (unlink and clear the old one, or you'll end up with duplicate keys). I did that on web01. A minute later the host reported active availability, and CPU utilization was arriving every few seconds with no passive polling involved. The agent interface can stay for the availability badge, but active checks don't need it.
Which should you use? Use passive for a handful of hosts on a flat network. Use active when there are many hosts, a firewall or NAT sits between them, or you want log monitoring. Whichever you choose, keep Hostname= right.
What about Linux over SNMP?
Zabbix also ships Linux by SNMP, which polls net-snmp the same way the Cisco post did. It's fine for appliances where you can't install anything. On a server you control, the agent wins:
- It reports per-filesystem usage and inodes, processes, services, and logs that SNMP doesn't expose cleanly.
- No SNMPv3 users or MIB views to manage on every host.
- Active mode means the host can sit behind NAT and still report.
- Agent 2 plugins cover Docker, MySQL, PostgreSQL, Redis and more without extra scripts.
The cost is a package on every host and two ports to open, which brings us to the faults.
When it doesn't work
Firewall on 10050 (passive)
I dropped inbound 10050 on web01:
sudo iptables -A INPUT -p tcp --dport 10050 -j DROPWithin a couple of minutes the ZBX badge went red, and the interface error read:
Get value from agent failed: cannot establish TCP connection to [[10.66.20.31]:10050]: timed outThe server log shows it giving up on the host:
Zabbix agent item "vm.memory.size[pavailable]" on host "web01" failed: another network error, wait for 15 seconds
temporarily disabling Zabbix agent checks on host "web01": interface unavailable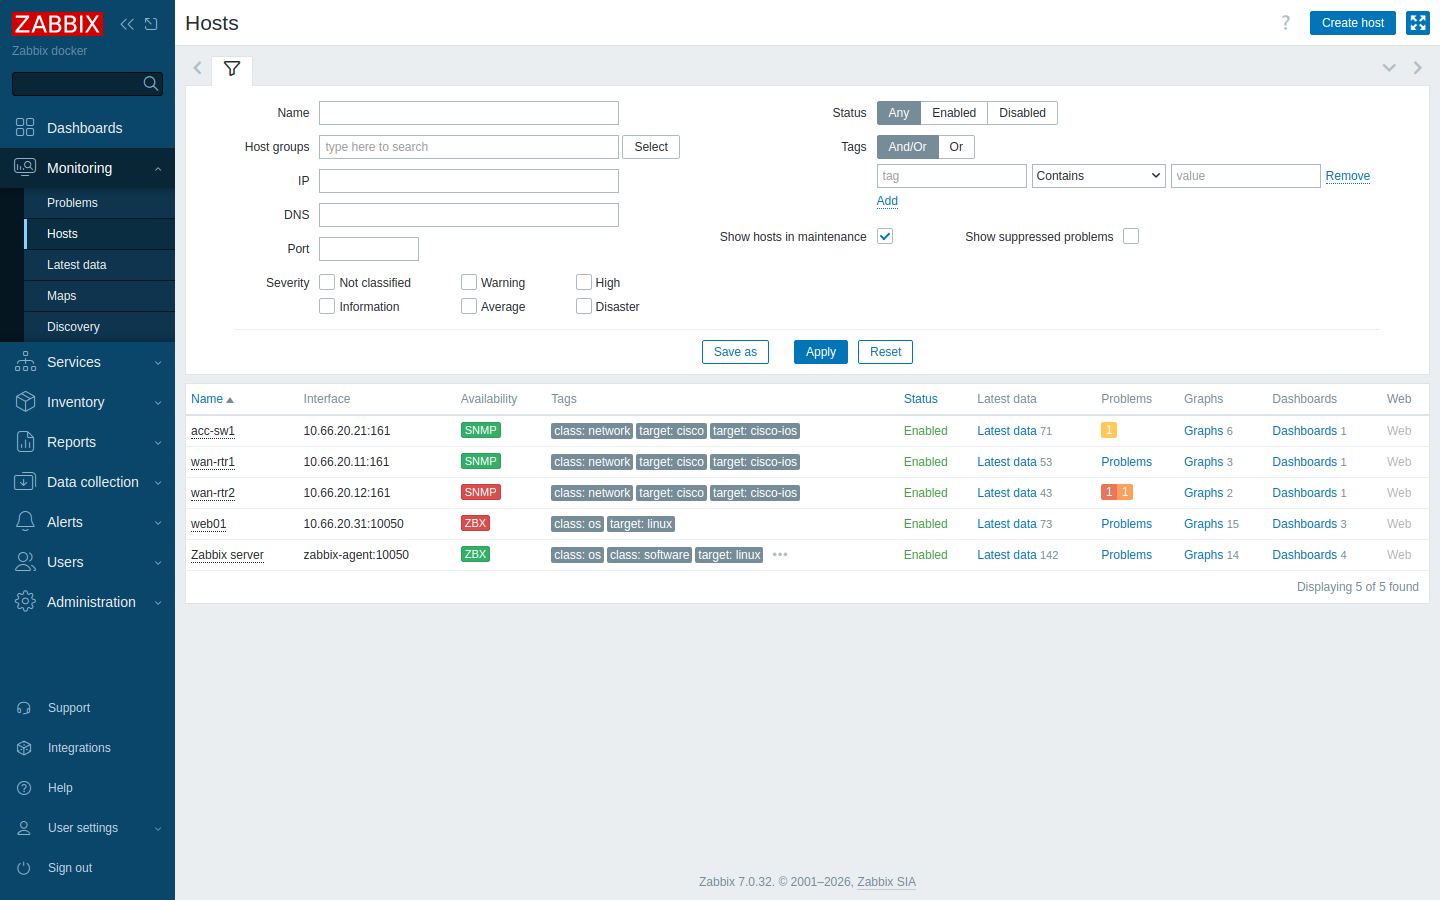
"Timed out" means a packet filter (host firewall, cloud security group, or something in the path). "Connection refused" means the agent isn't running or isn't listening on that address. If the error mentions the connection being rejected by the agent, check Server=: the agent only answers the IPs listed there, and a Zabbix server behind NAT or Docker may come from an address you didn't expect.
The fix is sudo ufw allow from 10.66.20.2 to any port 10050 proto tcp, or the equivalent rule in whatever firewall you use. Allow it only from the Zabbix server.
Firewall on 10051 (active)
Active checks fail in the other direction. With outbound 10051 blocked, the agent log said:
[101] cannot connect to [10.66.20.2:10051]: dial tcp :0->10.66.20.2:10051: i/o timeout
[101] active check configuration update from host [web01] started to fail
The Zabbix UI is quiet about this at first. Active items just stop updating until the "no data" style triggers fire, so check the agent's log, /var/log/zabbix/zabbix_agent2.log. Port 10051 also has to be published on the server. In the Docker install it is.
Hostname mismatch
This one is sneaky because passive keeps working. I first set Hostname=web01.lab while the host in Zabbix was called web01. The ZBX badge was green and passive items flowed, but the agent log said:
Zabbix Agent2 hostname: [web01.lab]
[101] no active checks on server [10.66.20.2:10051]: host [web01.lab] not found
[101] active checks on server started to fail
And the server log:
cannot process heartbeat from host "web01.lab": host not found
cannot send list of active checks to "10.66.20.31": host [web01.lab] not found
Active checks match on the host name field (not the visible name, and not DNS), and the match is case-sensitive. Make Hostname= and the host name identical, then restart the agent. If you're rolling agents out with automation, setting HostnameItem=system.hostname and naming hosts after the OS hostname avoids the problem entirely.
Quick checklist
- Install
zabbix-agent2from the Zabbix 7.0 repo so versions match. - Set
Server=,ServerActive=andHostname=, then restart. - Run
zabbix_get -s <host> -k agent.versionfrom the server. - Create the host with the exact same name, plus
Linux by Zabbix agent(passive) or... active. - Allow inbound 10050 from the server only, and make sure the agent can reach the server on 10051.
- Red badge: check the server side. Missing active data: check the agent log.
To push the agent and config to a fleet, an Ansible role with the repo, the package and a templated config file is all you need.
Next in the series
With routers, switches and a Linux box reporting, the next step is making the data useful: dashboards in Grafana with the Zabbix data source, and alert actions that reach you somewhere other than the Problems page.
Dashboards are live too: Zabbix dashboards with the Grafana plugin: a NOC board you'd actually put on a screen.