
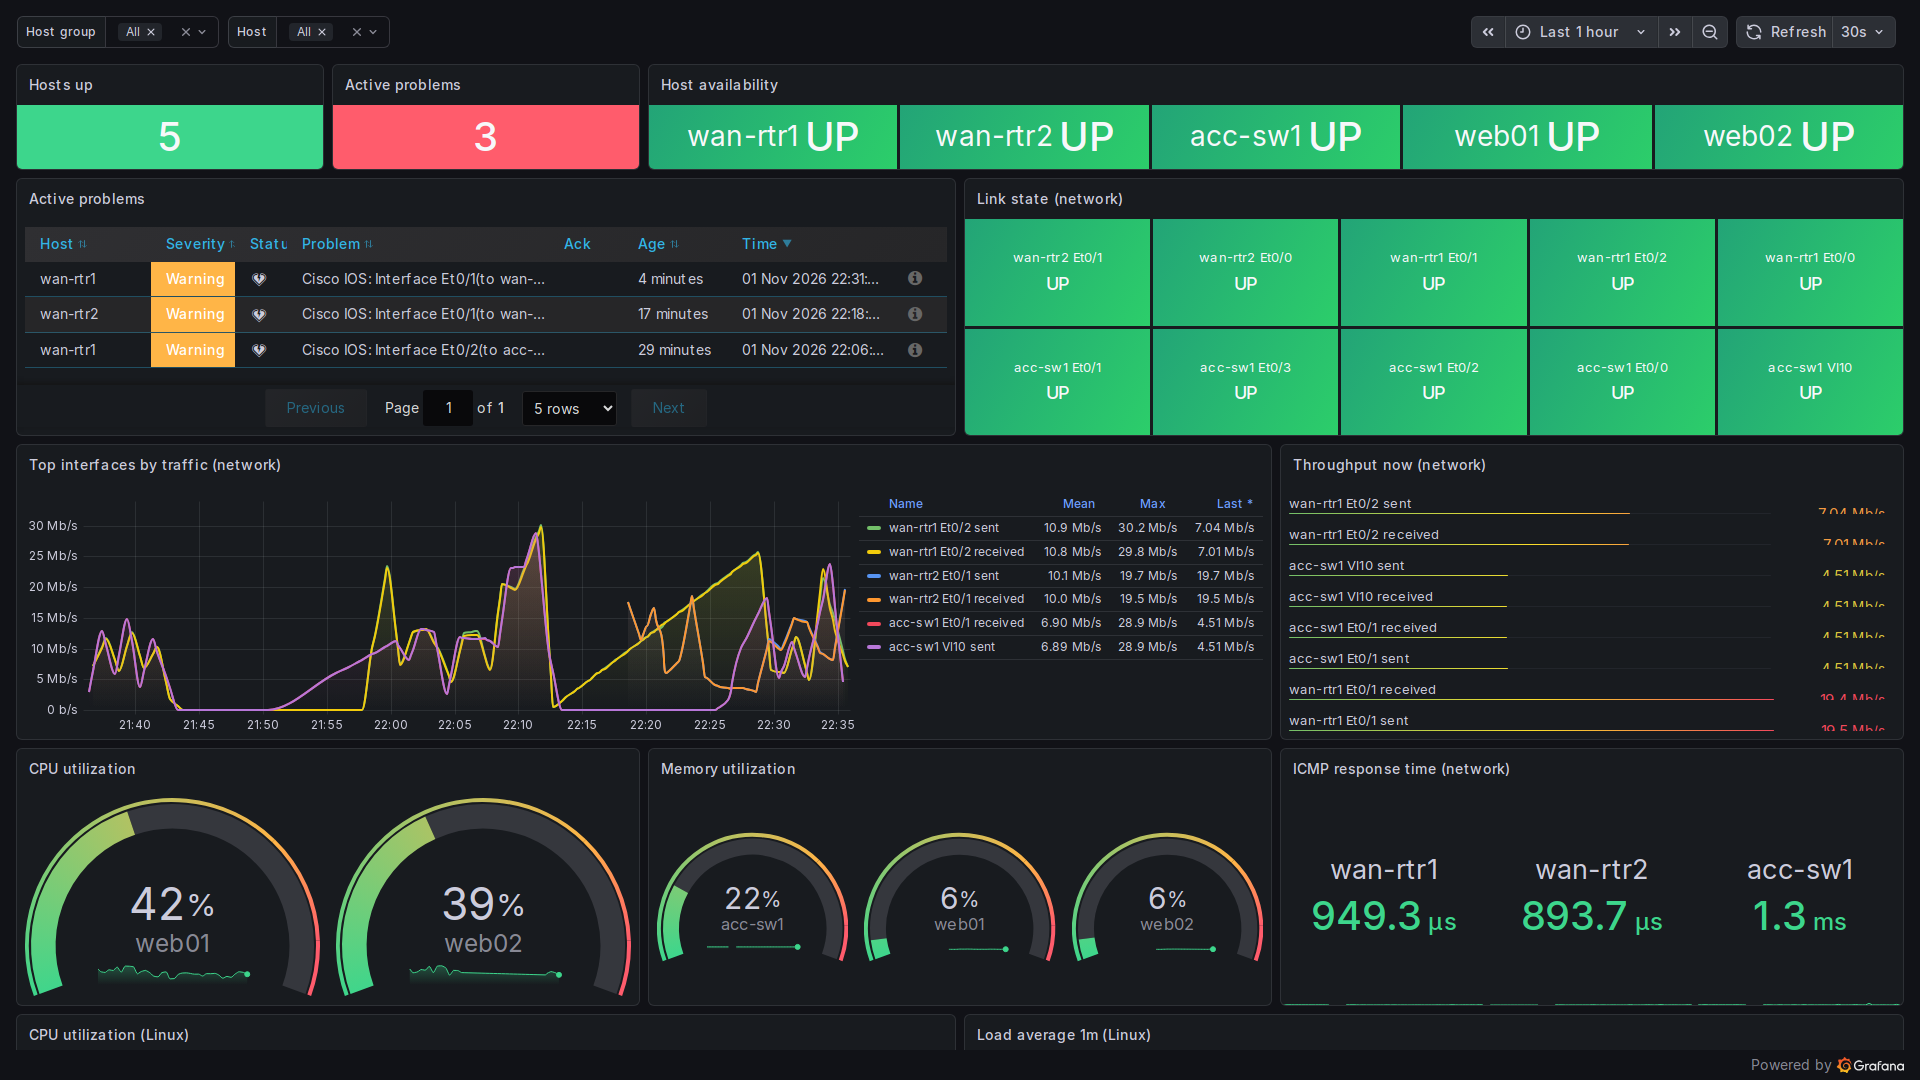
The series so far: install Zabbix 7.0 LTS alongside Grafana, add Cisco routers and switches over SNMPv3, and add Linux servers with agent 2. All that data now needs a screen. This post builds a NOC board you could leave running on a wall: two Grafana dashboards using the Zabbix plugin, one native Zabbix dashboard for comparison, and a real outage to check that the boards actually show it.
Everything here was built in my home lab on Zabbix 7.0.32, Grafana OSS 13.0.2 and the Zabbix plugin for Grafana (alexanderzobnin-zabbix-app) 6.10.1. The monitored estate is the same as before: two Cisco routers (wan-rtr1, wan-rtr2), one access switch (acc-sw1) and two Ubuntu servers (web01, web02). There are no firewalls in this one, just routers, switches and Linux.

Install the Zabbix plugin
The plugin is an app that bundles the Zabbix data source and its panels. On a package install:
sudo grafana cli plugins install alexanderzobnin-zabbix-app
sudo systemctl restart grafana-server
My Grafana runs from the Docker Compose file in the install post, so I added it as an environment variable and recreated the service:
  grafana:
    image: grafana/grafana-oss:latest
    environment:
      GF_INSTALL_PLUGINS: alexanderzobnin-zabbix-app
      GF_USERS_DEFAULT_THEME: dark
Grafana logs the download on start:
msg="Downloaded and extracted alexanderzobnin-zabbix-app v6.10.1 zip successfully to /var/lib/grafana/plugins/alexanderzobnin-zabbix-app"
msg="Plugin registered" pluginId=alexanderzobnin-zabbix-app
Then enable the app (Administration > Plugins and data > Plugins > Zabbix > Enable), or use the API:
curl -u admin:YOUR_GRAFANA_PASSWORD -X POST -H 'Content-Type: application/json' \
  -d '{"enabled":true,"pinned":true}' \
  http://localhost:3000/api/plugins/alexanderzobnin-zabbix-app/settings
A read-only Zabbix user and API token
Don't point Grafana at Zabbix with the Admin account. In Zabbix:
- Users > User groups: create
Grafana read-onlyand give it Read on the network and Linux host groups. Nothing else. - Users > Users: create
grafanawith the built-in User role, in that group only. - Users > API tokens: create a token for
grafana. Copy it now, because Zabbix only shows it once.
Zabbix has had API tokens since 5.4. Token auth's better than a username and password because you can expire or revoke it without touching the user.
Add the data source
Under Connections > Data sources > Add > Zabbix, set:
- URL: the API endpoint, ending in
api_jsonrpc.php. Here it'shttp://zabbix-web:8080/api_jsonrpc.phpbecause Grafana reaches the web frontend by its Compose service name. - Auth type: API token, then paste the token.
- Trends: on, from 7 days. Long time ranges then read hourly trends instead of raw history, which keeps big boards fast.
- Cache TTL: 1m.
The same thing as provisioning YAML, so it lives in Git (the token comes from an environment variable, never the file):
apiVersion: 1
datasources:
  - name: Zabbix
    uid: zabbix
    type: alexanderzobnin-zabbix-datasource
    access: proxy
    url: http://zabbix-web:8080/api_jsonrpc.php
    jsonData:
      authType: token
      trends: true
      trendsFrom: 7d
      cacheTTL: 1m
    secureJsonData:
      apiToken: ${ZABBIX_API_TOKEN}
Save & test should come back with the server version. From the API:
{"message":"Zabbix API version 7.0.32","status":"OK"}What goes on a wall board
A NOC screen gets read from three metres away in about two seconds. That rules out most of the things you'd put on a troubleshooting dashboard. My rules:
- Status first, in colour. The top row answers "is anything broken?" with big green or red tiles: hosts up, active problems, and per-host availability.
- Problems second. A short, sorted list with host, severity and age.
- Every link as a tile. Operational status mapped to UP or DOWN, so a dead uplink is a red square, not a line on a graph.
- Trends last. Traffic, CPU, memory and latency come after the status, and they get thresholds so the colour does the talking.
- No scrolling. Everything important fits in 1920x1080 in kiosk mode.
There are two Grafana boards: NOC overview for the wall, and Linux host, a drill-down with a host variable. Both use the dark theme. Grafana's kiosk mode (?kiosk on the URL) hides the menus.
The key queries
Every panel uses the plugin's Metrics query type: group, host and item filters (regex between slashes), followed by a chain of functions. These are the ones doing the real work on the NOC board:
# Link state tiles (stat panel, value mapping 1=UP, 2=DOWN)
Group: /Network/   Host: $host   Item: /Operational status/
  setAlias($__zbx_host_name $__zbx_item_name)
  replaceAlias(/^(\S+) Interface (\S+?)\(.*$/, $1 $2)        -> "wan-rtr1 Et0/2"

# Top interfaces by traffic (time series)
Group: /Network/   Host: $host   Item: /Bits (received|sent)/
  top(6, avg)
  setAlias($__zbx_host_name $__zbx_item_name)
  replaceAlias(/^(\S+) Interface (\S+?)\(.*: Bits (\w+)$/, $1 $2 $3)

# Host availability tiles (1=UP, 0=DOWN)
Group: $group   Host: $host   Item: /^(ICMP ping|Zabbix agent availability)$/
  setAlias($__zbx_host_name)

# Hosts up: same query + transforms
  Reduce (Last *) -> Filter by value (Last * = 1) -> Reduce (count)

# Linux CPU by mode (drill-down board)
Group: /Linux/   Host: $host   Item: /^CPU (user|system|iowait|softirq|steal|nice) time$/
  replaceAlias(/^CPU (\w+) time$/, $1)
Two points about those queries:
- Clean up the names. Zabbix item names are long ("Interface Et0/2(to acc-sw1): Bits received"). On a wall board,
setAliasfollowed byreplaceAliaswith a capture group turns that into "wan-rtr1 Et0/2 received". Most of the visual polish comes from that one step. - One query covers both device types. Network gear has
ICMP pingfrom the SNMP template and Linux servers haveZabbix agent availability. Matching both in a single regex gives one availability row covering all of them.
The two template variables are plugin queries too: $group matches /^(Network|Linux)/, and $host lists every host in $group (both multi-select, with All).
The Linux drill-down
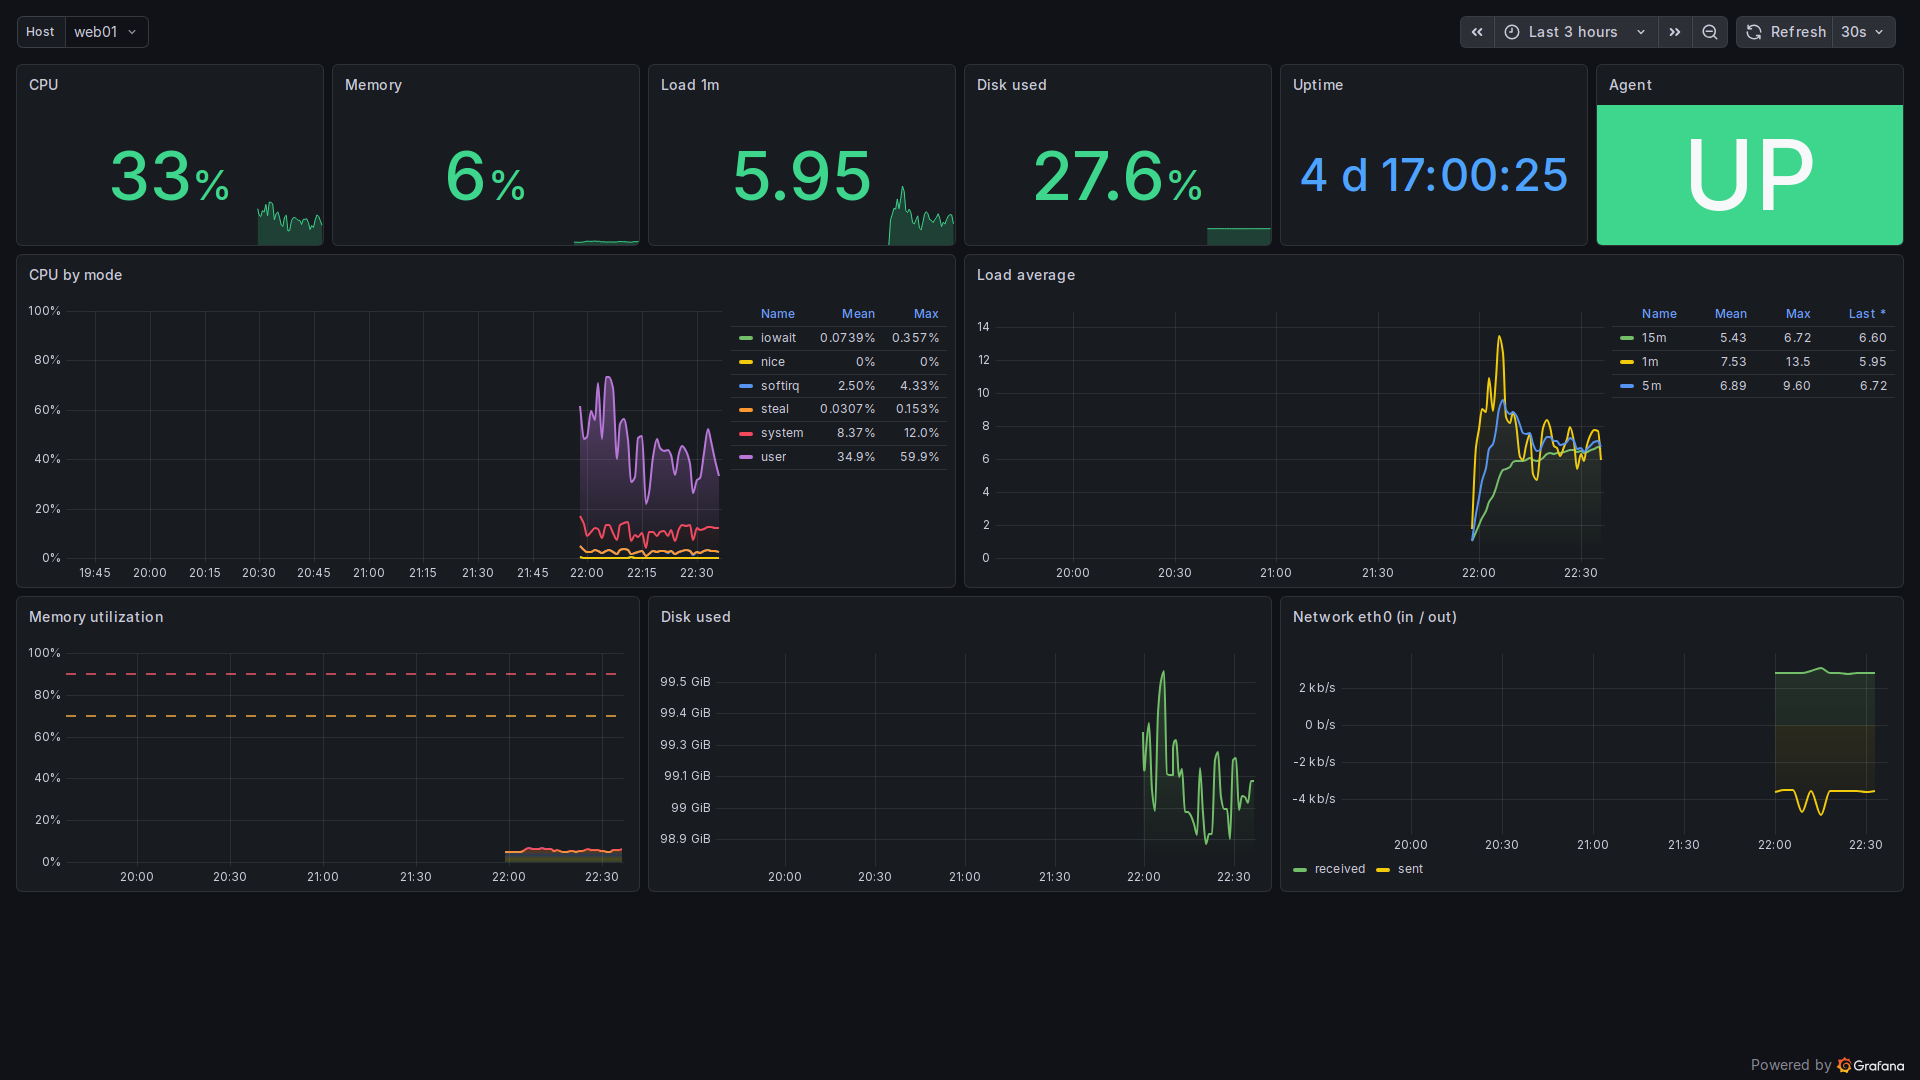
The top row uses stat panels with sparklines. Thresholds are 70 and 90 percent for CPU and memory, and 12 and 16 for 1-minute load. Set load thresholds against the core count of your own servers, not a copied number. CPU by mode is stacked, so the user, system and iowait split is visible at a glance, and the load graph shows all three averages. The agent tile is a value-mapped stat with a solid background, so DOWN fills the panel in red.
Breaking something on purpose
A dashboard that's only ever been green hasn't been tested. At 10:11 PM PT I did two things at once:
- shut
Et0/2onwan-rtr1, the link toacc-sw1 - powered off
web02
wan-rtr1(config)# interface Ethernet0/2
wan-rtr1(config-if)# shutdown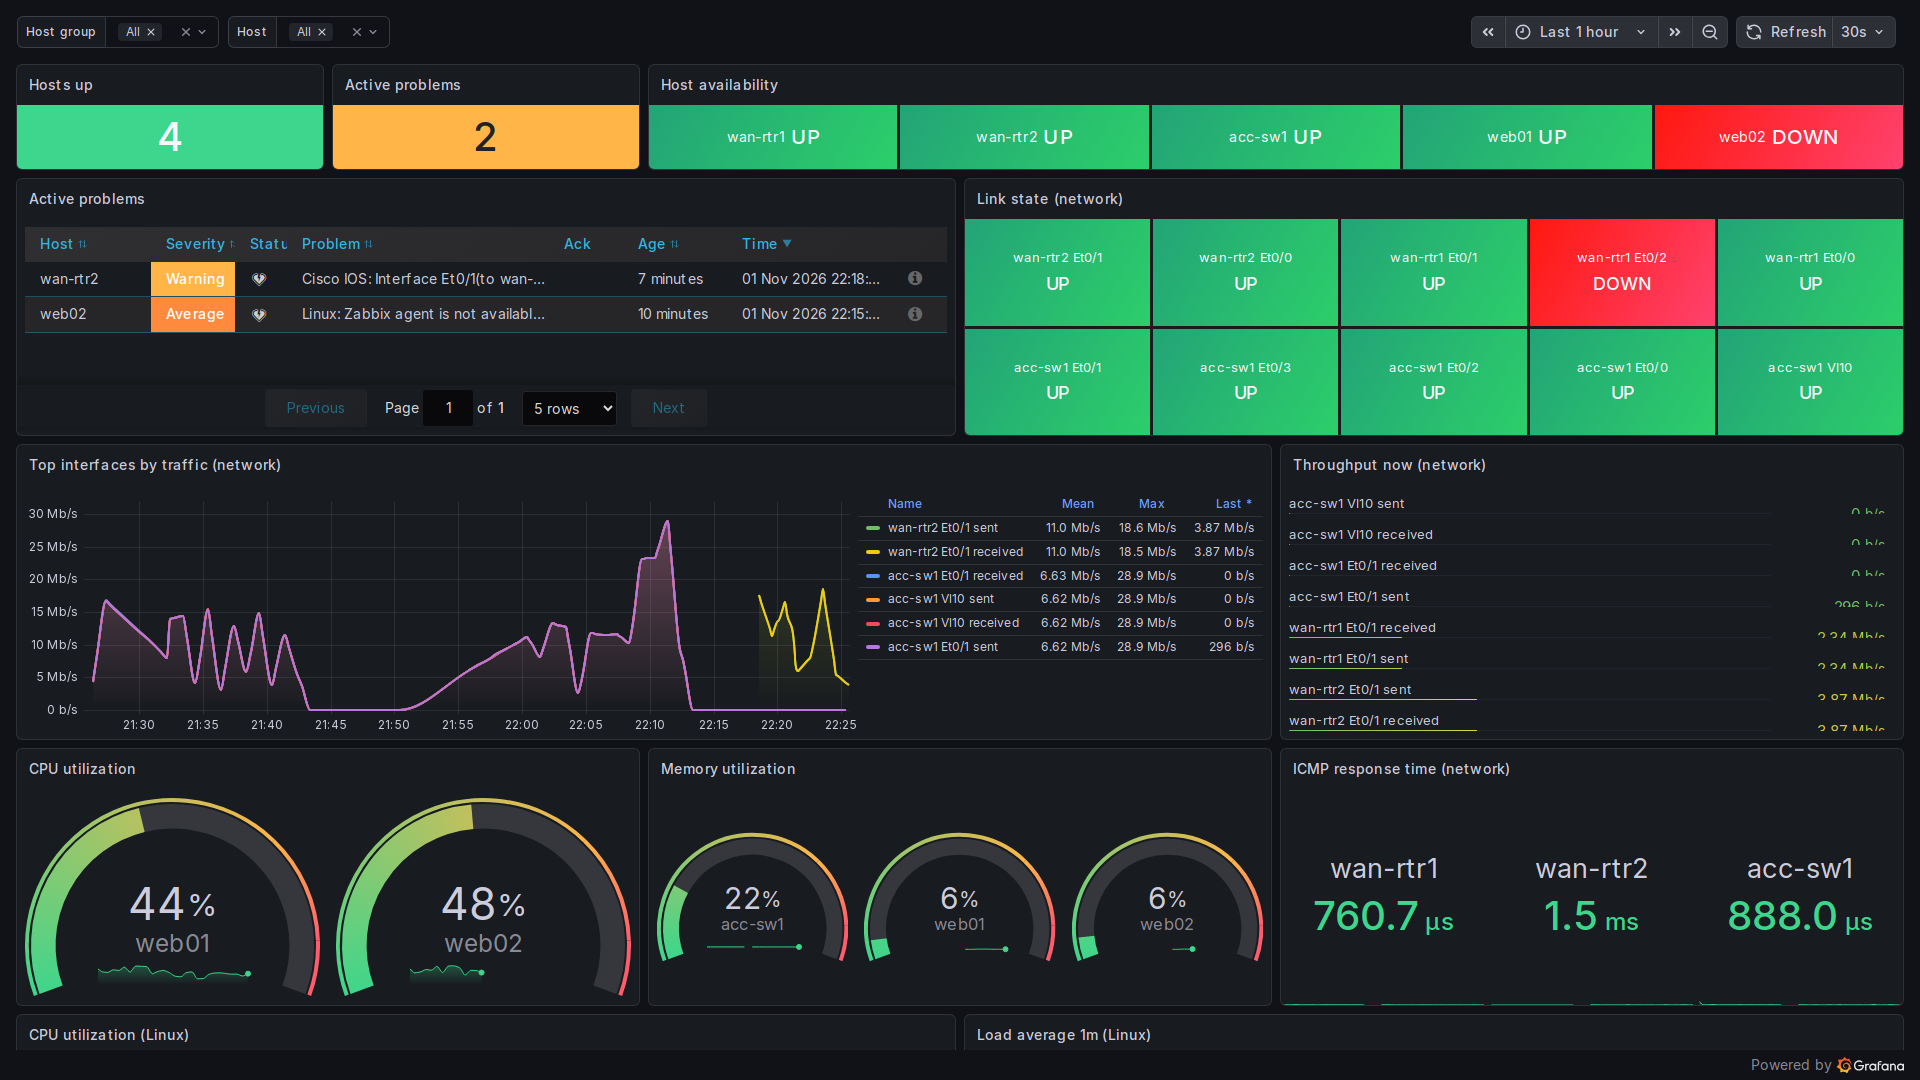
Both failures show up on the board from across the room. The agent problem fired at 10:15:54 PM, once the 3-minute "agent is not available" trigger had run its course. Two things on that screenshot are worth knowing about before you trust a board like this.
Gotcha 1: a shut port doesn't raise a problem
The Et0/2 tile went red, but there is no "Link down" in the problems list. That's deliberate. The Cisco template's interface discovery uses a filter macro, {$NET.IF.IFADMINSTATUS.NOT_MATCHES}, set to ^2$ by default, and its link-down trigger only fires when the port is admin-up and oper-down. Zabbix assumes an admin shutdown is intentional. Out of the box, discovery also drops admin-down ports, so the tile would have disappeared instead of turning red.
To keep the tile for this test, I overrode the macro on wan-rtr1 only and disabled the status items for ports that really are unused. That's also the behaviour you want in production: a cut cable or dead optic (admin up, oper down) raises the alarm, and a port someone shut on purpose doesn't page anyone. If you test your board with shutdown, expect the red tile and no alarm, and don't decide the trigger is broken.
Gotcha 2: gauges show the last value they saw
While web02 was down, its CPU gauge still read 48%. Gauges and stats using Last * (lastNotNull) keep the final value they received, and nothing on the gauge tells you it's stale. That's why availability sits in the top row, and why the drill-down has an agent tile. On a wall board, pair every "current value" panel with an availability indicator, or use Last instead of Last * so a dead host shows no value.
Recovery
At 10:26 PM PT I ran no shutdown on Et0/2 and powered web02 back on. The link tile went green on the next poll. web02 answered ping, but its agent didn't start on its own, so the problem stayed open until I started it by hand. It resolved at 10:31:54 PM. That's a real-world lesson as well: check systemctl is-enabled zabbix-agent2 on every box you build.
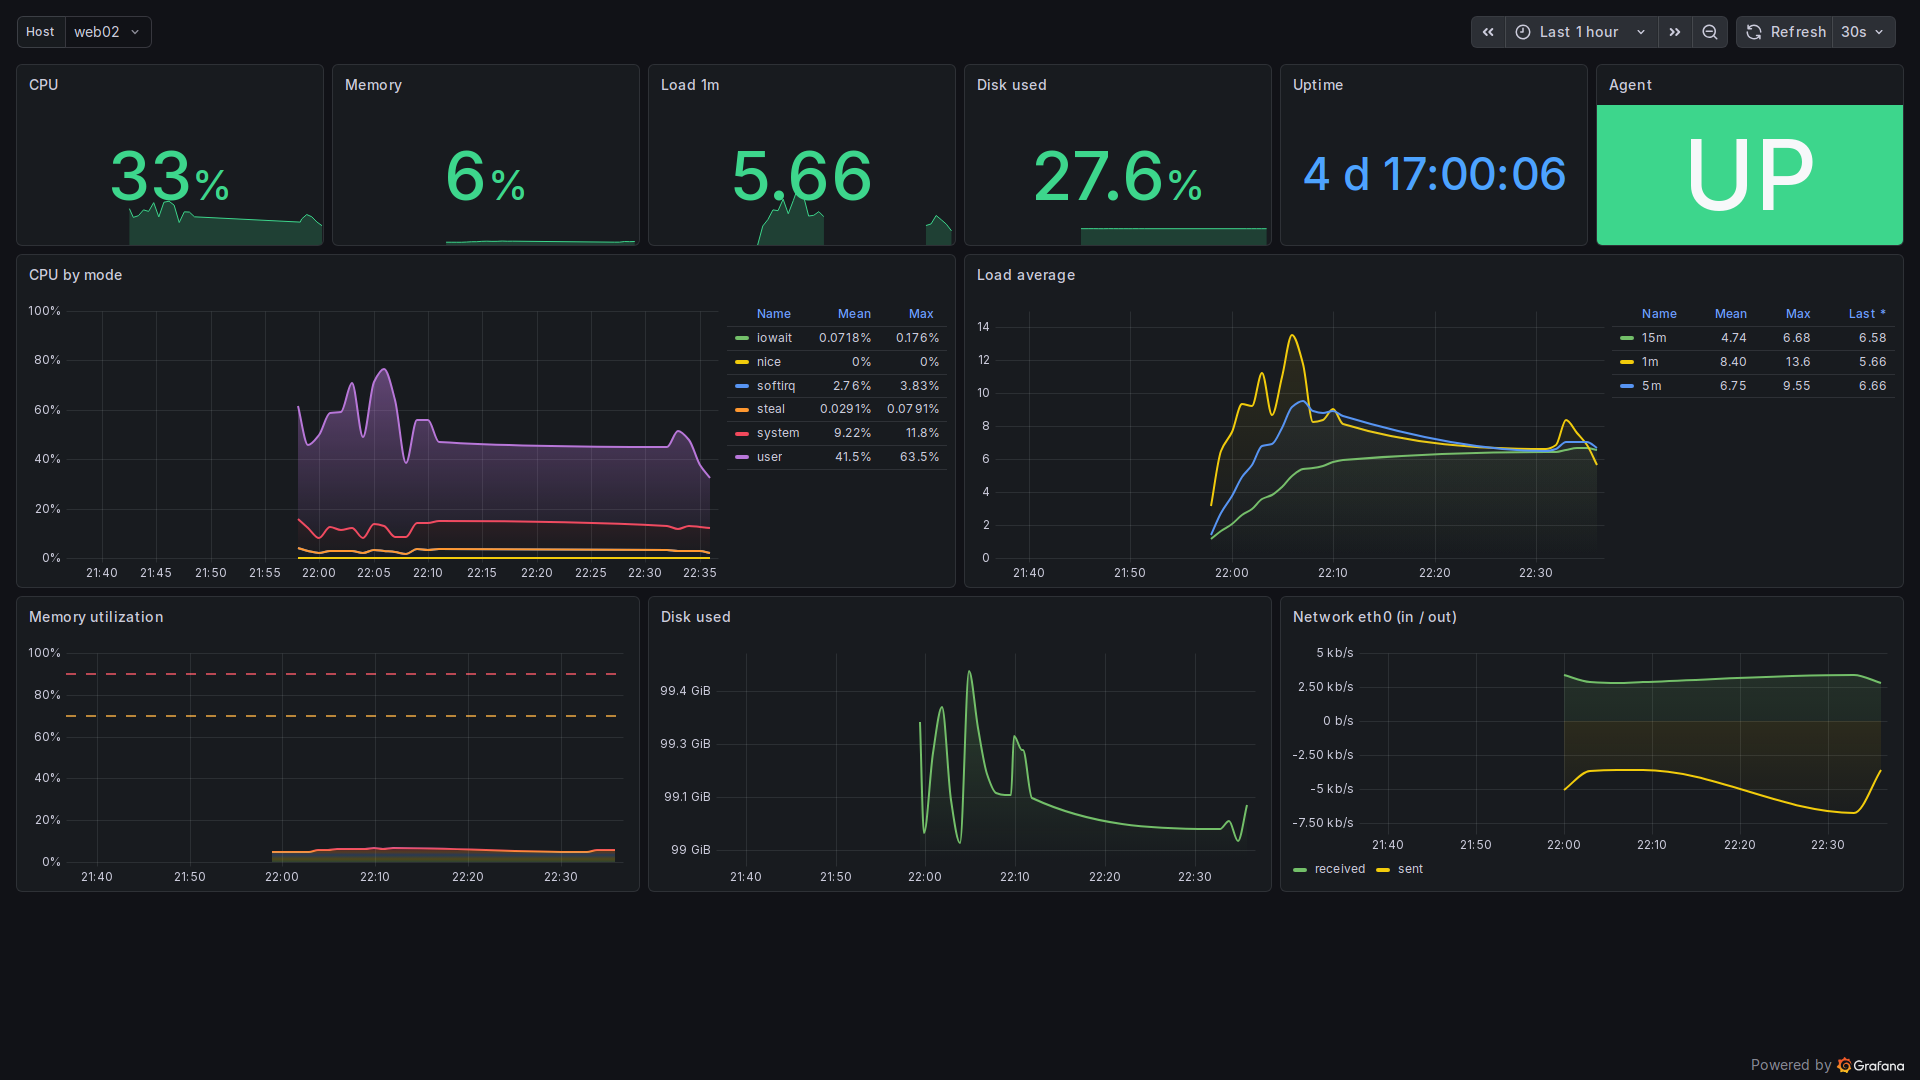
Those bandwidth warnings are worth fixing rather than ignoring. If ifHighSpeed reports a low value, set {$IF.UTIL.MAX} or the interface speed macro so the percentage means something. A wall board with permanent amber gets ignored.
The same board in native Zabbix 7.0
Zabbix 7.0's own dashboards have come a long way, so I built the closest equivalent with no Grafana involved. It has a host availability widget, problems by severity, a honeycomb for CPU and memory, current problems, and two SVG graphs. The dark theme is set per user under User settings > Profile.
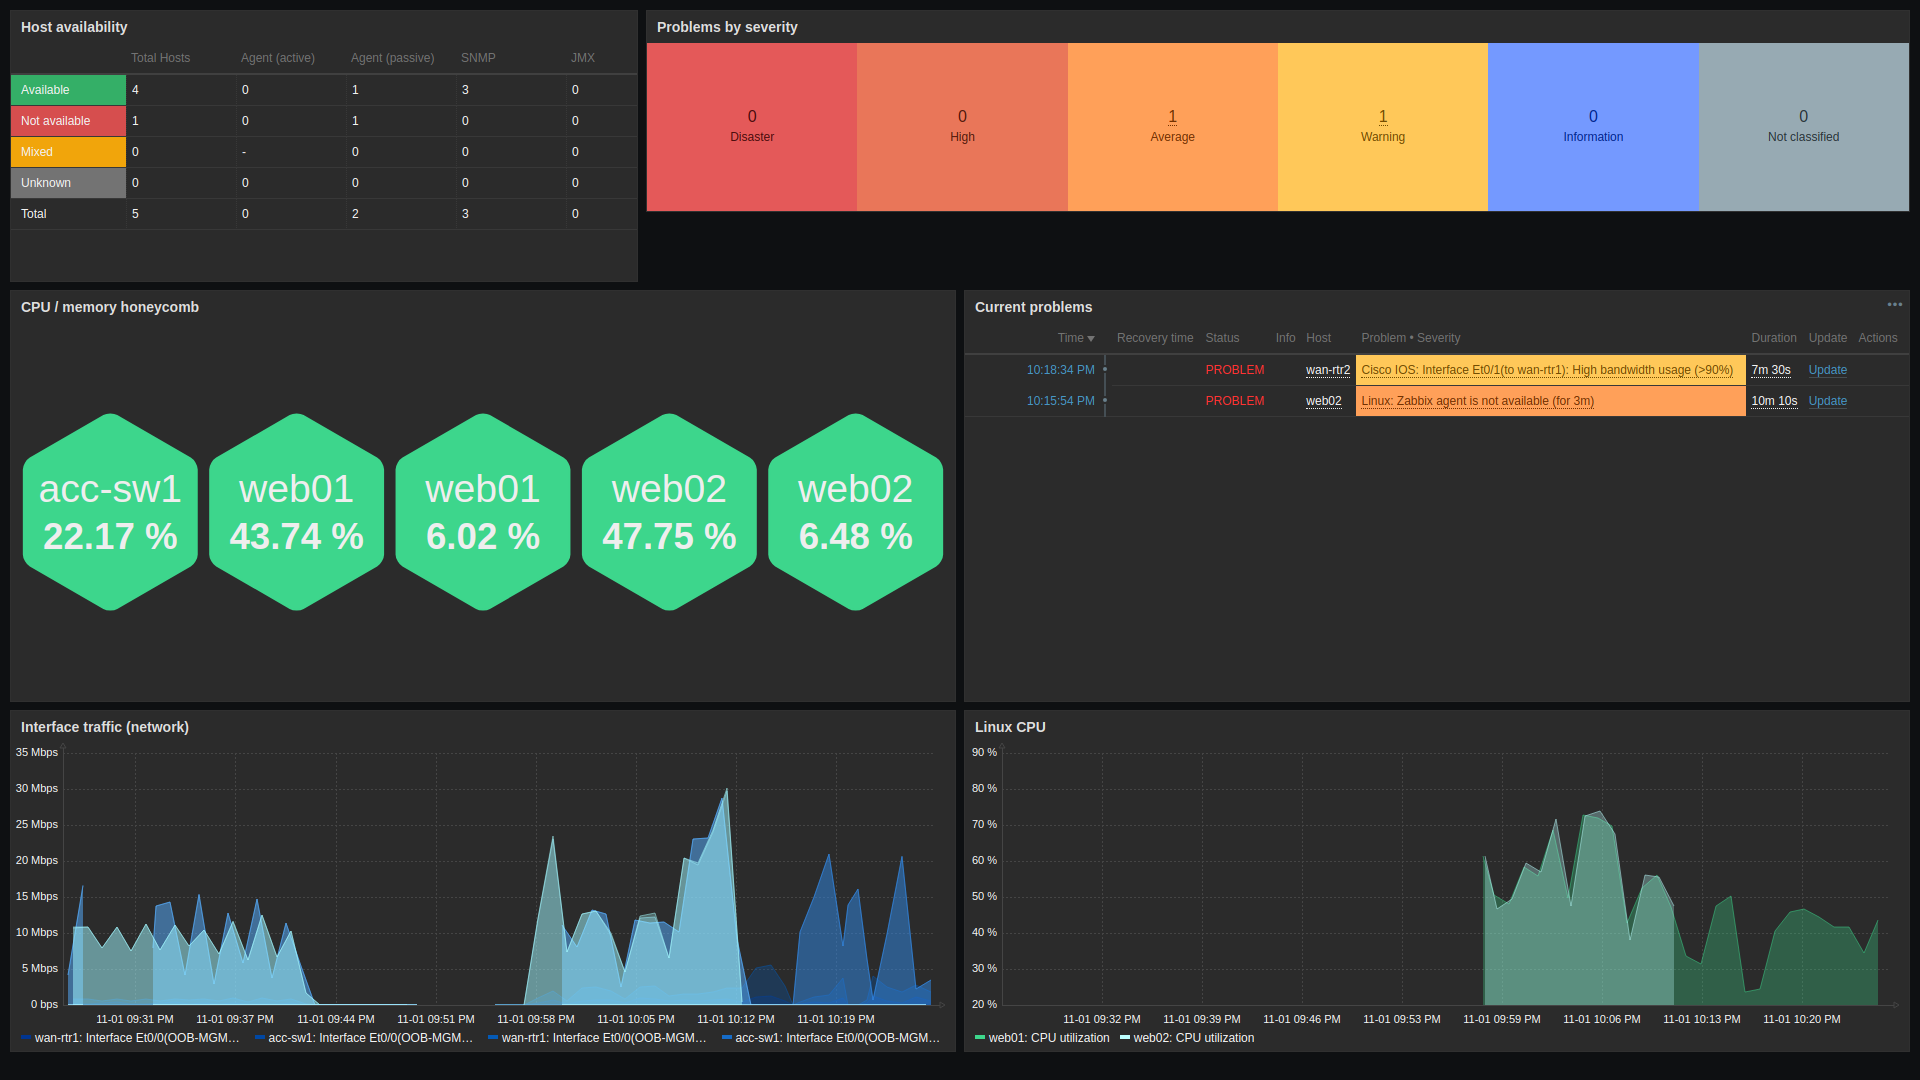
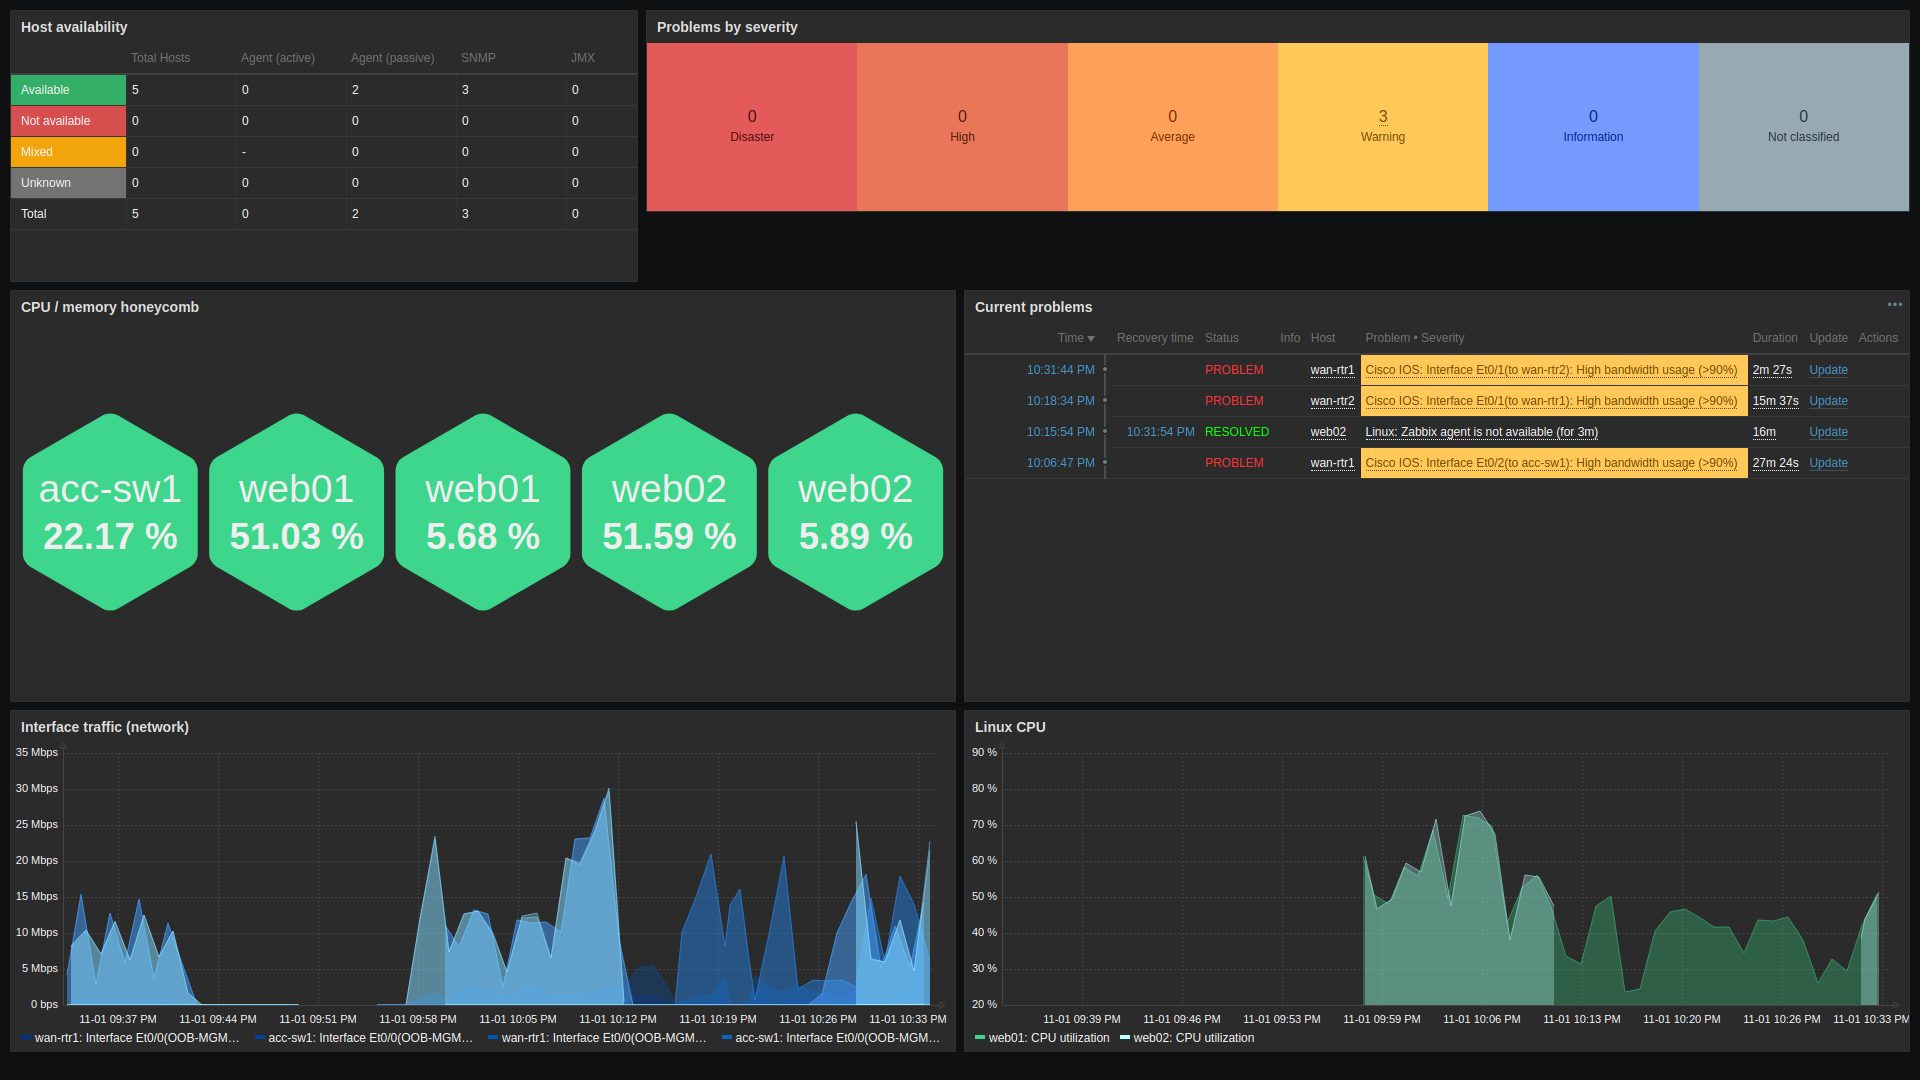
An honest comparison after building both:
| Grafana + Zabbix plugin | Native Zabbix 7.0 | |
|---|---|---|
| Extra components | Grafana, plugin, API user and token | None |
| Look on a wall | Best. Full control of colour, size, value mappings and layout | Good, but fixed widget styling |
| Per-link UP/DOWN tiles | Easy (stat panel plus value mapping) | Possible with item value or honeycomb widgets, less flexible |
| Variables and drill-down | Template variables, one board for every host | Dashboard host override, more limited |
| Problems view | Good, but some actions need Zabbix | Best: ack, close and history built in |
| Access control | Grafana's own, plus whatever the API user can read | Zabbix user groups, no extra layer |
| Mixing sources | Yes (Prometheus, Loki and others next to Zabbix) | Zabbix only |
| Kiosk mode | ?kiosk | &kiosk=1 |
My take: for the operators who work problems all day, the native dashboard is enough, and it can do things Grafana can't, like acknowledge an event from the widget. For a screen people look at but don't touch, or one that mixes Zabbix with other data, Grafana wins easily. Running both costs very little, because Grafana only reads.
Quick checklist
- Install
alexanderzobnin-zabbix-appand enable the app. - Create a read-only Zabbix user group and user, and an API token.
- Add the data source with token auth and trends on, and confirm the test returns your Zabbix version.
- Top row: availability and problem count. Then problems, link tiles and trends.
- Use
setAliasandreplaceAliasto give everything short names. - Break something real, and check that the board and the triggers both notice.
- Watch for admin-down ports (no alarm by design) and stale Last * values.
Next in the series
The board shows a problem when someone is looking at it. Next, alert actions and media types, so Zabbix tells you about the link-down at 3 AM instead of waiting for someone to notice a red tile.