
The earlier posts in this series watch devices: SNMP, syslog, flows. This one watches the management network those tools live on. Who is polling the routers, who just tried SSH from somewhere odd, and what is speaking cleartext between the NOC tools themselves.
I put Suricata 8.0.3 and Zeek 9.0.0 on a mirror of the management segment in my home lab, shipped their JSON logs into the same Loki 3.7.9 and Grafana 13.0.2 stack from the syslog post, and wired one Grafana alert rule to the NOC folder. The devices are the same two Cisco IOS XE 17.18.2 routers and IOS XE 17.18.2 access switch as before. All test traffic came from one throwaway client container hitting my own lab addresses.

How this differs from the earlier Suricata and Zeek posts
I've already covered the sensors themselves: reading eve.json from a controlled scan, a SPAN in the wrong direction producing no alerts, Suricata inline with NFQUEUE, turning a pcap into Zeek conn and DNS logs, matching Zeek and Suricata with Community ID, correlating Zeek with ASA PAT and rogue DHCP and ARP spoofing with Zeek. Those were about detection mechanics on a data network.
This post is about operations: the sensors watch the management network, and their output lands next to the SNMP and syslog data a NOC already looks at, with an alert that goes through the same Grafana alerting as the WAN rules from the alerting post.
Getting a copy of the traffic
The management segment is a software bridge, so there's no switch to configure a SPAN on. I built the equivalent: a dummy interface called ids0 and a tc ingress mirror on every port of the bridge, so every frame a device or tool sends is copied to ids0. Both sensors listen there.
$ sudo ip link add ids0 type dummy && sudo ip link set ids0 up mtu 9000
$ for v in $(ip -o link show master <mgmt-bridge> | awk -F': ' '{print $2}' | cut -d@ -f1); do
    sudo tc qdisc add dev $v handle ffff: ingress
    sudo tc filter add dev $v parent ffff: matchall action mirred egress mirror dev ids0
  done

$ tc filter show dev <port> ingress
filter parent ffff: protocol all pref 49152 matchall chain 0 handle 0x1
  not_in_hw
	action order 1: mirred (Egress Mirror to device ids0) pipe
Ingress on every port gives you both directions of any conversation between two attached hosts, because each side's packets enter the bridge on its own port. The catch is traffic from the bridge host itself: those packets leave on a port, they never enter one, so only the replies get mirrored. Zeek noticed straight away. Its weird.log filled with data_before_established and inappropriate_FIN for every connection from the host to Grafana and Loki, 121 of each in about nine minutes. It's the same one-sided capture problem as the wrong-direction SPAN post, just in software. On a real switch, use monitor session 1 source vlan <mgmt-vlan> both and you avoid it.
New containers on the bridge get new ports, so the loop has to run after anything you add. I started the test client and web server first for that reason.
Rules for a management network
A management network is quiet and predictable, which makes small local rules work well. I defined two address groups, the NOC tools and the devices, and wrote three rules plus one classic test signature:
vars:
  address-groups:
    NOC_NET: "[10.66.20.1/32,10.66.20.2/32,10.66.20.5/32,10.66.20.40/28]"
    ROUTERS: "[10.66.20.11/32,10.66.20.12/32,10.66.20.21/32]"

alert tcp !$NOC_NET any -> $ROUTERS 22 (msg:"PL-LAB SSH to router management from a non-NOC host"; flow:to_server; flags:S,12; classtype:policy-violation; sid:9000001; rev:1;)
alert tcp any any -> $ROUTERS 23 (msg:"PL-LAB Telnet attempt to router management"; flags:S,12; classtype:policy-violation; sid:9000002; rev:1;)
alert tcp !$NOC_NET any -> $ROUTERS any (msg:"PL-LAB Possible port scan of router management"; flags:S,12; threshold:type both, track by_src, count 20, seconds 60; classtype:attempted-recon; sid:9000003; rev:1;)
alert ip any any -> any any (msg:"GPL ATTACK_RESPONSE id check returned root"; content:"uid=0|28|root|29|"; classtype:bad-unknown; sid:2100498; rev:7;)
Two things bit me. Overriding vars in an include file replaces the whole block, so Suricata complained that TEREDO_PORTS, GENEVE_PORTS and VXLAN_PORTS were undefined until I copied the default port groups back in. And the scan rule started as type threshold, count 20, seconds 10, which fired 7 times for one 100-port nmap run. type both with a 60-second window brought that down to one alert per scan, which is what you want paging someone.
The test traffic
From a client at 10.66.20.61 (outside NOC_NET) at 10:19 AM PST, repeated at 10:21 after the threshold change (that run used .12 for the SSH probe):
$ curl -s http://10.66.20.60/id.txt          # lab web server returns "uid=0(root) ..."
$ ssh -o BatchMode=yes probe@10.66.20.11 true  # no credentials, just the handshake
$ nc -z -w3 10.66.20.12 23                     # one SYN to telnet
$ nmap -sS -Pn -T4 --top-ports 100 10.66.20.21
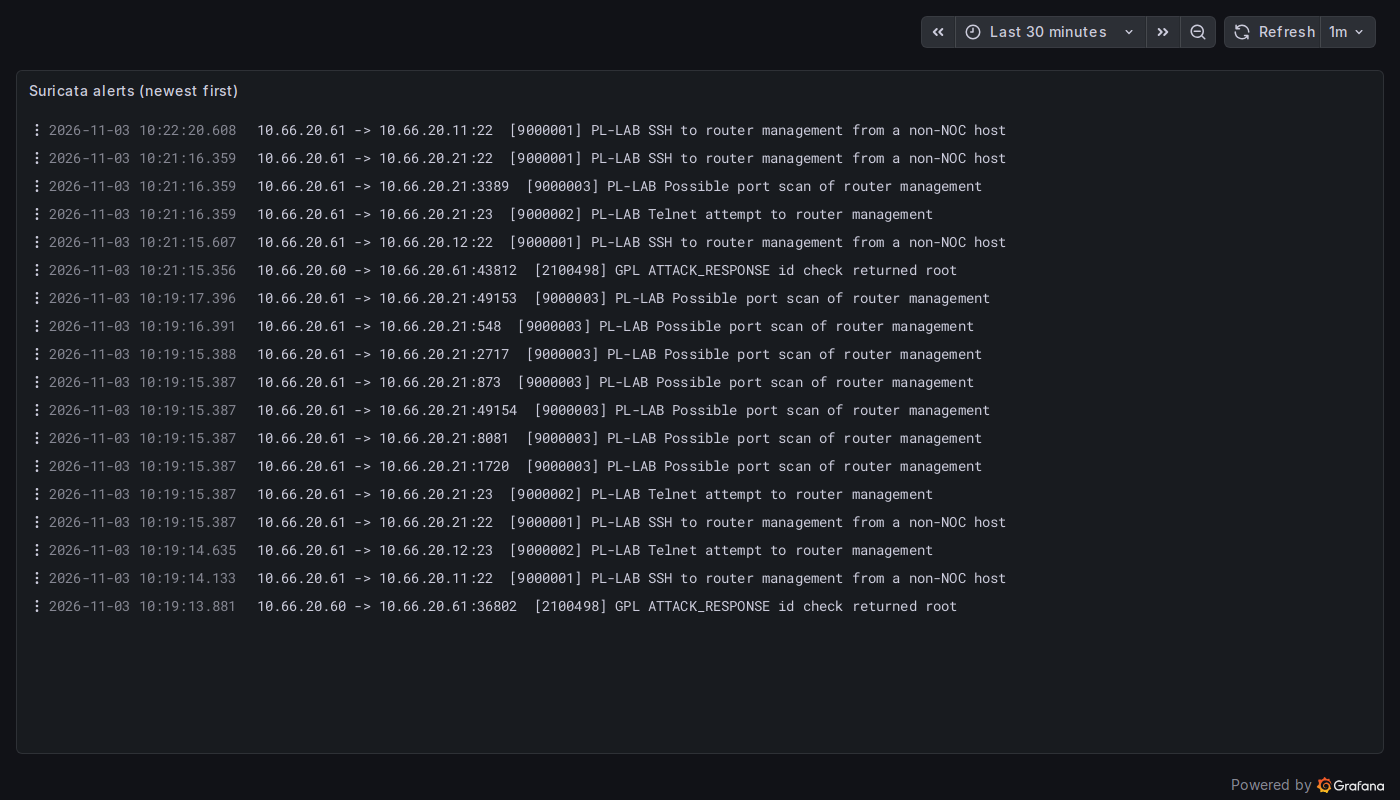
Every rule fired. Here's the scan alert as Suricata wrote it:
{
 "timestamp": "2026-11-03T18:21:16.209836+0000",
 "event_type": "alert",
 "src_ip": "10.66.20.61",
 "dest_ip": "10.66.20.21",
 "dest_port": 3389,
 "proto": "TCP",
 "alert": {
  "action": "allowed",
  "signature_id": 9000003,
  "signature": "PL-LAB Possible port scan of router management",
  "category": "Attempted Information Leak",
  "severity": 2
 }
}
Into Loki with Alloy
Alloy 1.21.3 already receives router syslog for Loki. I mounted the sensor log directories into it read-only and added two file sources. For Suricata, the event_type becomes a label and the noisy stats and flow records are dropped. For Zeek, each log file gets a zlog label:
loki.process "ids_suricata" {
  stage.json { expressions = { event_type = "event_type" } }
  stage.labels { values = { event_type = "" } }
  stage.match {
    selector = "{job=\"suricata\", event_type=~\"stats|flow\"}"
    action   = "drop"
  }
  stage.label_drop { values = ["filename"] }
  forward_to = [loki.write.local.receiver]
}

local.file_match "ids_zeek" {
  path_targets = [
    {"__path__" = "/ids/zeek-log/conn.log", job = "zeek", zlog = "conn"},
    {"__path__" = "/ids/zeek-log/ssh.log",  job = "zeek", zlog = "ssh"},
    {"__path__" = "/ids/zeek-log/snmp.log", job = "zeek", zlog = "snmp"},
    ...
  ]
}
The order matters: the label has to exist before stage.match can drop on it. My first version had them the other way round and dropped nothing.
Zeek field names contain dots, like id.orig_h. A plain | json orig="id.orig_h" in LogQL treats the dot as nesting and returns empty values. You need the bracket form:
sum by (orig, resp, port, proto) (
  count_over_time({job="zeek", zlog="conn"}
    | json orig=`["id.orig_h"]`, resp=`["id.resp_h"]`, port=`["id.resp_p"]`, proto="proto"
    | resp=~"10.66.20.(11|12|21)" [$__range]))
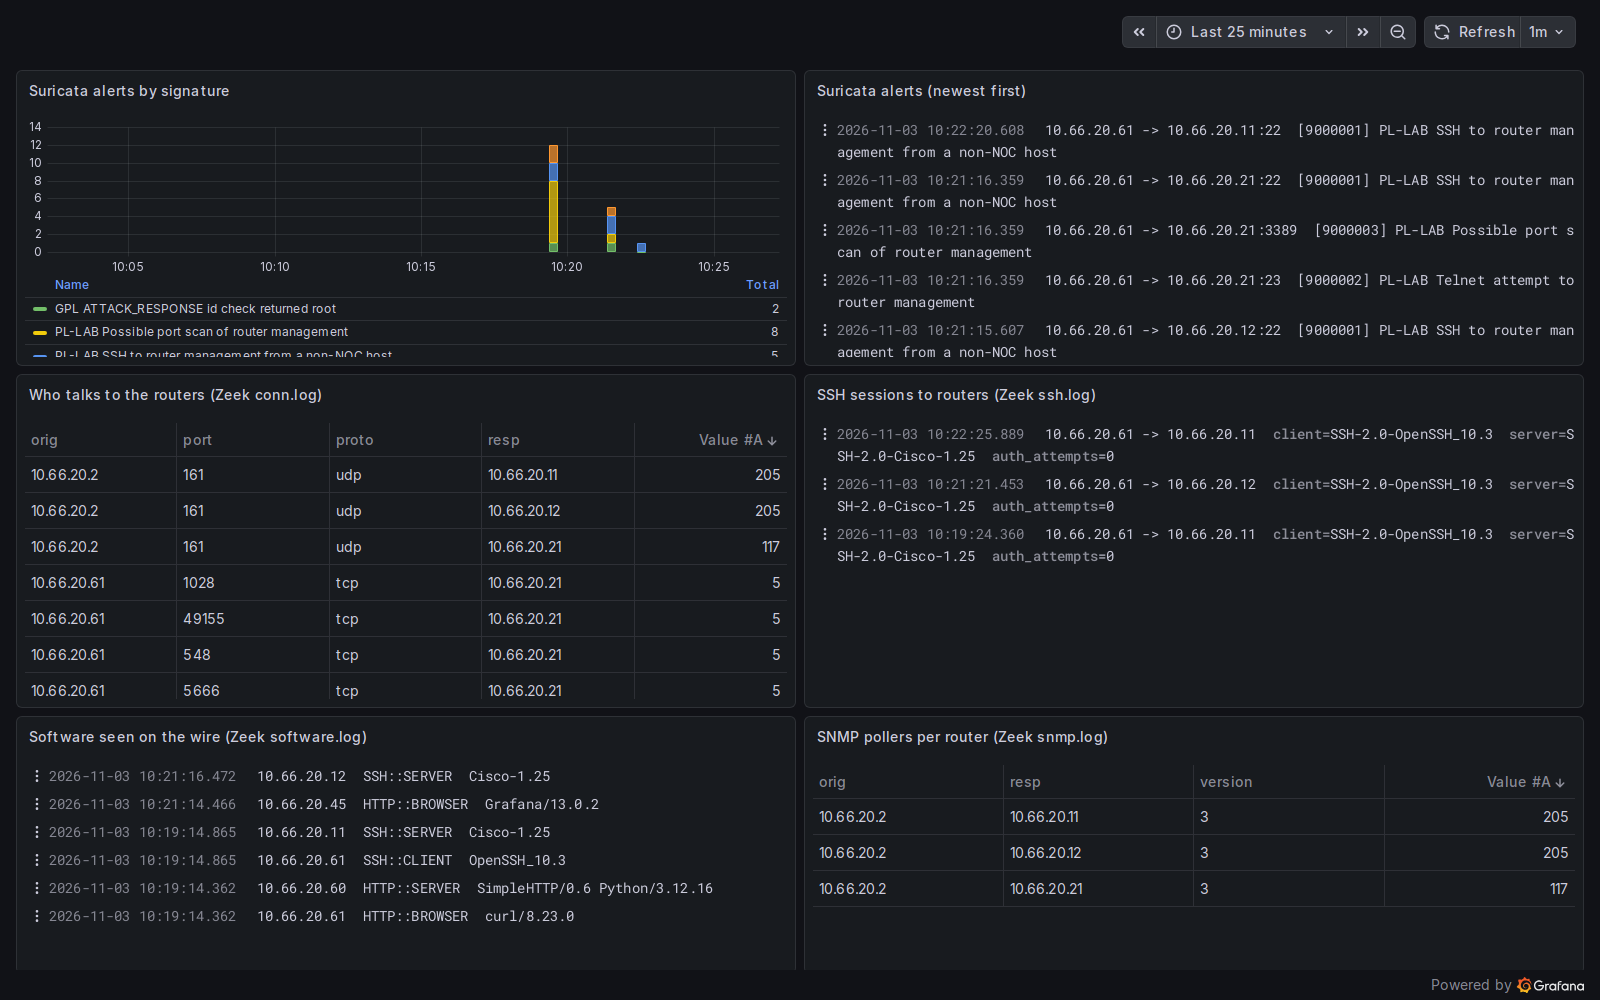
One more dashboard gotcha: the alerts-by-signature bar chart first used a fixed [1m] range with a 30-second step, so every alert was counted twice in the legend totals. [$__auto] matches the range to the step and the totals came out right: 2 GPL hits, 8 scan alerts, 5 SSH alerts.
What Zeek adds
Suricata tells you a rule matched. Zeek tells you what normal looks like, and on a management network that's most of the value.
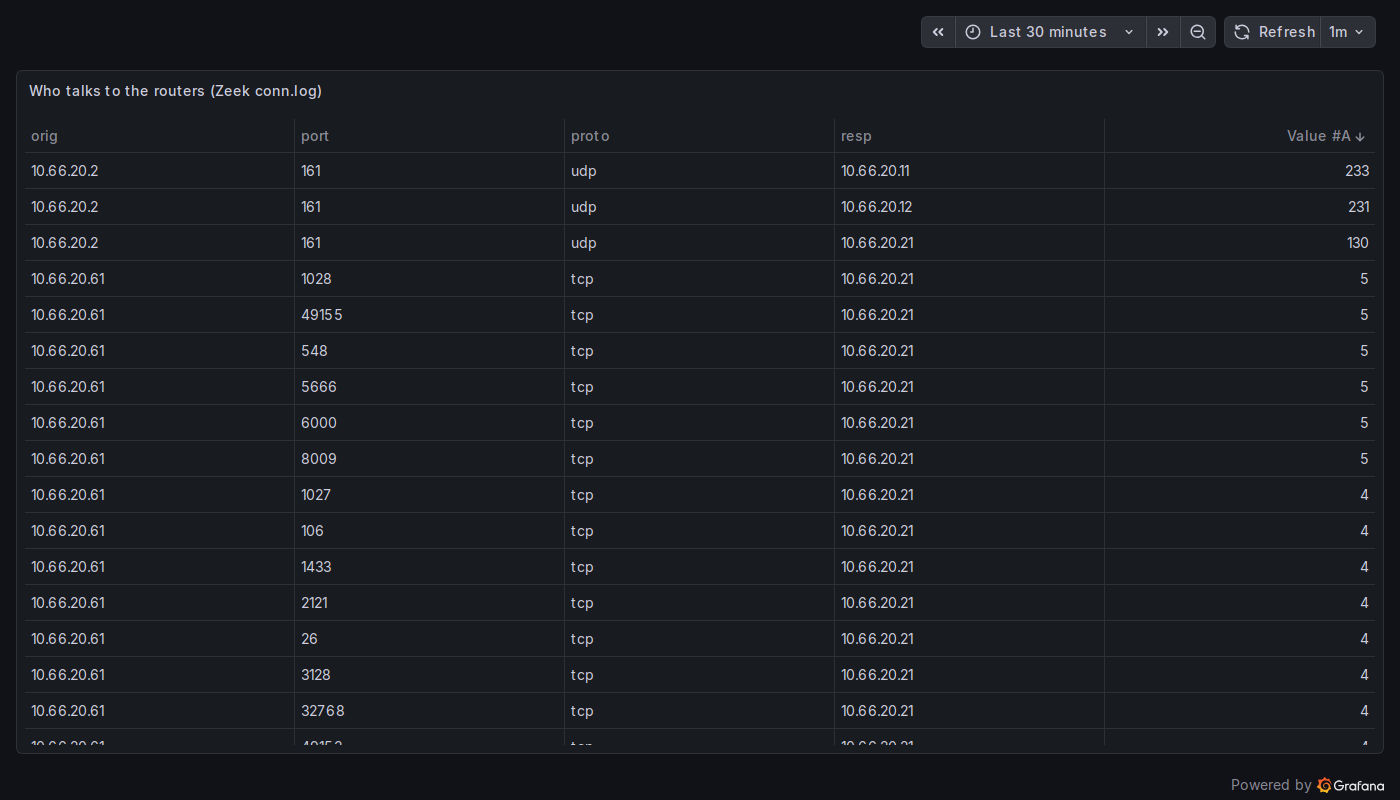
The baseline is one poller, the Zabbix server, doing SNMP to all three devices. Anything else in this table deserves a question. Zeek's snmp.log also shows these are SNMPv3 with zero visible get or set counts, because the PDUs are encrypted:
{"id.orig_h":"10.66.20.2","id.resp_h":"10.66.20.11","id.resp_p":161,"version":"3",
 "get_requests":0,"get_bulk_requests":0,"get_responses":0,"set_requests":0}
If you see "version":"2c" here with real request counts, someone is still polling with a community string, and Zeek would log that community. That's a good reason to restrict who can read these logs.
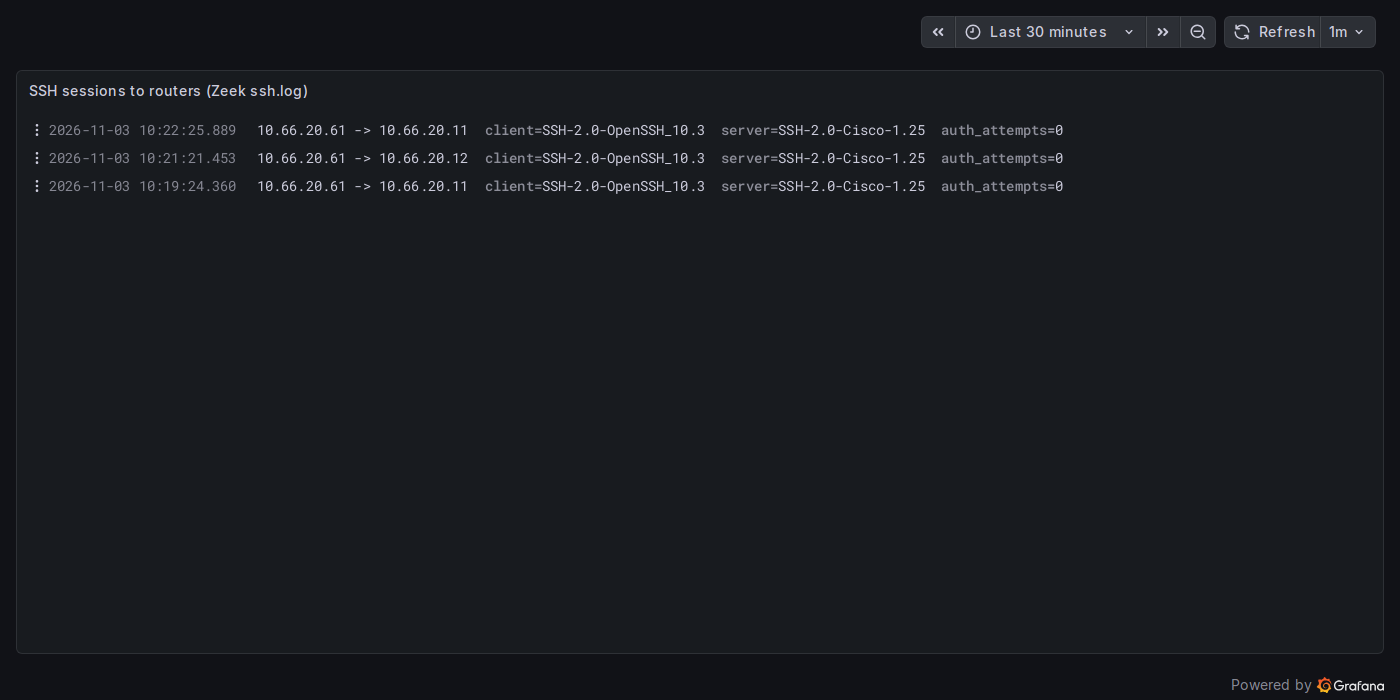
The SSH probe shows up in ssh.log with the router's banner and the client's version, and auth_attempts=0 because I never offered a password:
The surprise was http.log. Most of its entries were Grafana querying Loki over plain HTTP on port 3100, LogQL in the query strings. Internal tool traffic is easy to forget about. On a shared management network, that's readable by anyone with a mirror port.
One alert rule, same pipeline as the WAN alerts
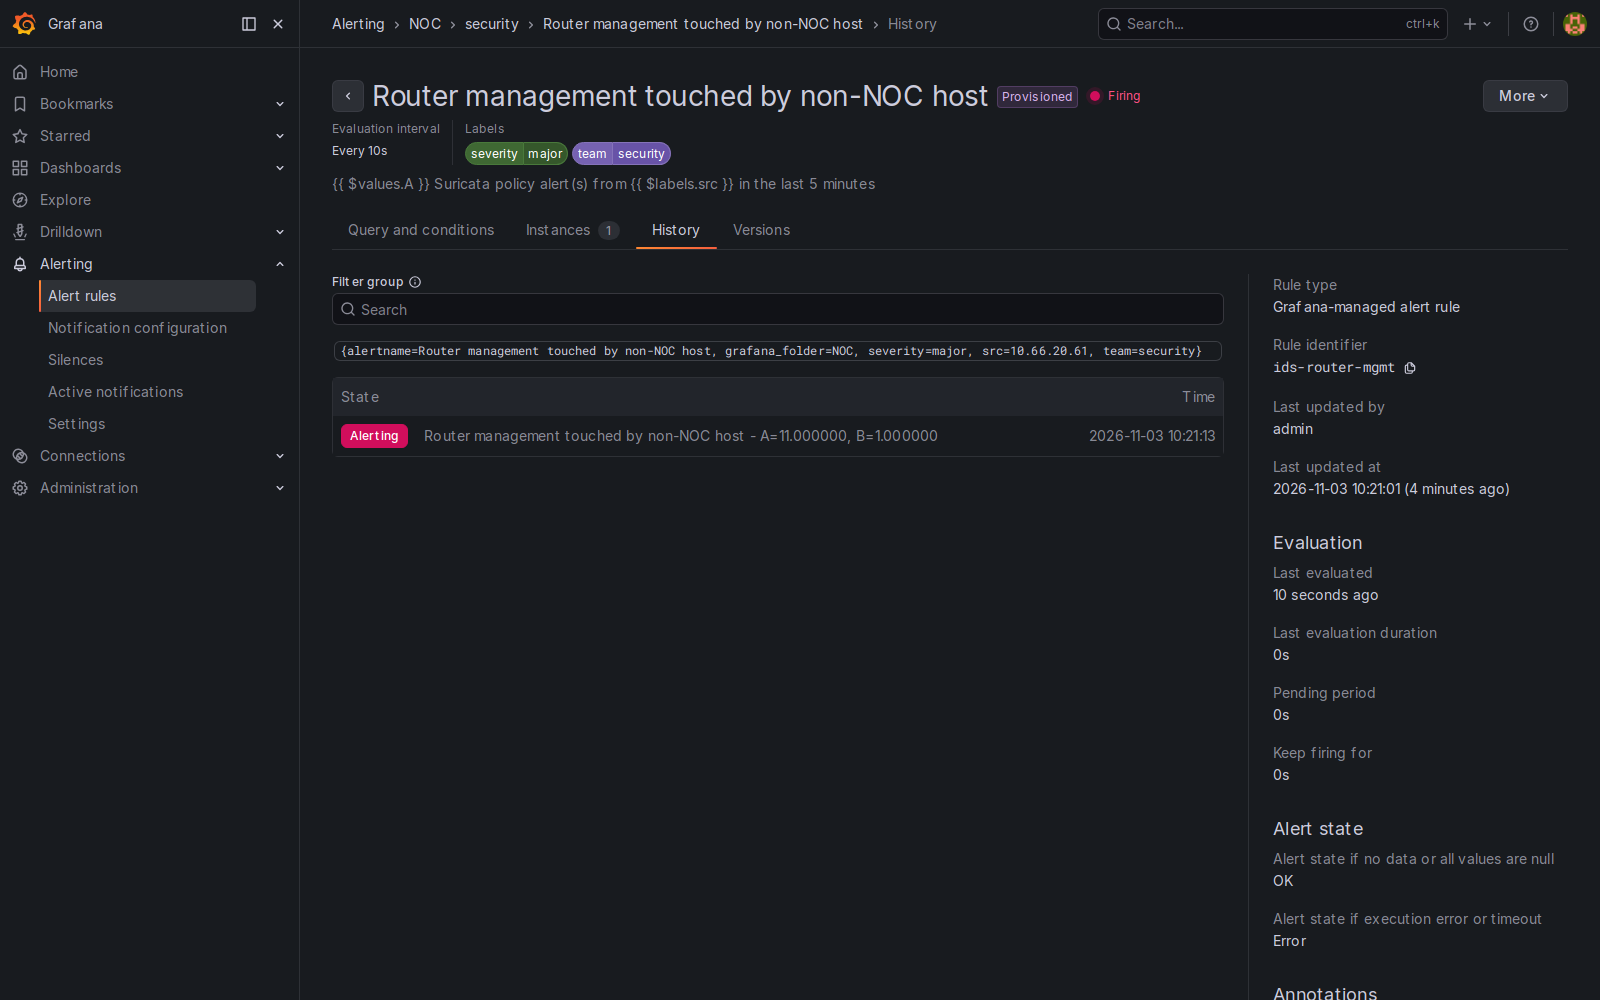
I didn't want every Suricata alert to page. The rule only covers the three management-policy signatures, grouped by source:
sum by (src) (
  count_over_time({job="suricata", event_type="alert"}
    | json sid="alert.signature_id", src="src_ip"
    | sid=~"900000[123]" [5m]))   > 0
It lives in the NOC folder in its own security group, evaluates every 10 seconds, and carries team=security so the notification policy can route it separately from team=wan. It went to Alerting at 10:21:13 AM PST with A=11, which is the count of policy alerts from 10.66.20.61 in the previous five minutes.
I didn't verify email delivery this time. The lab's mail catcher had moved address since the alerting post, and I left Grafana's SMTP settings alone.
Resource use
After about nine minutes on a quiet management network, from docker stats: Suricata 75 MiB, Zeek 97 MiB, Loki 103 MiB, Alloy 53 MiB. Suricata saw 34,491 packets with 0 kernel drops. The eve.json file was already 2.6 MB, mostly SNMP and flow records, which is why I drop flow and stats before Loki. If you don't need Suricata's SNMP parser on a network you already watch with Zeek, turn it off in app-layer and the file shrinks a lot.
Takeaways
- A management network is the easiest place to run an IDS: little traffic and a short list of who should talk to what.
- Mirror the whole segment in both directions. Half a conversation gives you Zeek weirds and missed rules.
- Thresholds decide whether a scan rule is useful. Test with a real scan and count the alerts.
- Zeek's conn and snmp logs give you a poller baseline for free. Put it on a dashboard.
- Send sensor logs into the same Loki and alerting as everything else, so security events reach the people already on call.
The open-source NOC series, part 3
That's the end of this run of posts:
- LibreNMS vs Zabbix on Cisco IOS XE
- Netdisco: find any MAC or IP and map your network from one seed
- Suricata and Zeek on the management network (this post)
Earlier parts: router syslog into Loki, Grafana alerting and the open-source workflow capstone.