
The last three posts got Cisco IOS XE metrics and logs into Grafana. A dashboard only helps if someone is looking at it, though. This post adds Grafana alerting on top: two alert rules for WAN failures, email contact points, a notification policy that groups alerts per router, a mute timing for a maintenance window, a silence for a change ticket and a custom email template. Then I shut a WAN interface twice and read what arrived.
Everything here is Grafana OSS 13.0.2 with its built-in Alertmanager. The mail goes to a local test mail server, so every address below is fake.

The pieces and how they connect
Grafana alerting has more moving parts than older tools, and most confusion comes from mixing them up:
- Alert rules run a query on a schedule and decide whether each series is firing. They attach labels such as
severityandteam. - Notification policies are a tree that matches on those labels and picks a contact point. They also set grouping and timing.
- Contact points are where the notification goes: email, Slack, webhooks and so on.
- Templates control what the message says.
- Mute timings are recurring windows when a policy sends nothing. Silences are one-off mutes that match labels.
Rules never reference a contact point directly in this setup. They set labels, and the policy tree routes on labels. That's what lets you add a team or change an email address without editing a single rule.
SMTP first
Email contact points do nothing until Grafana has an SMTP server. In grafana.ini it's the [smtp] section. I set it with environment variables:
GF_SMTP_ENABLED=true
GF_SMTP_HOST=10.66.20.2:1025
GF_SMTP_FROM_ADDRESS=grafana@noc.example.net
GF_SMTP_FROM_NAME=Grafana NOC
GF_SMTP_STARTTLS_POLICY=NoStartTLS
GF_SERVER_ROOT_URL=http://grafana.noc.example.net:3000/
The test mail server doesn't do TLS or authentication. On a real relay, set GF_SMTP_USER and GF_SMTP_PASSWORD and leave STARTTLS on. Set root_url as well, because Grafana uses it for every link in the email.
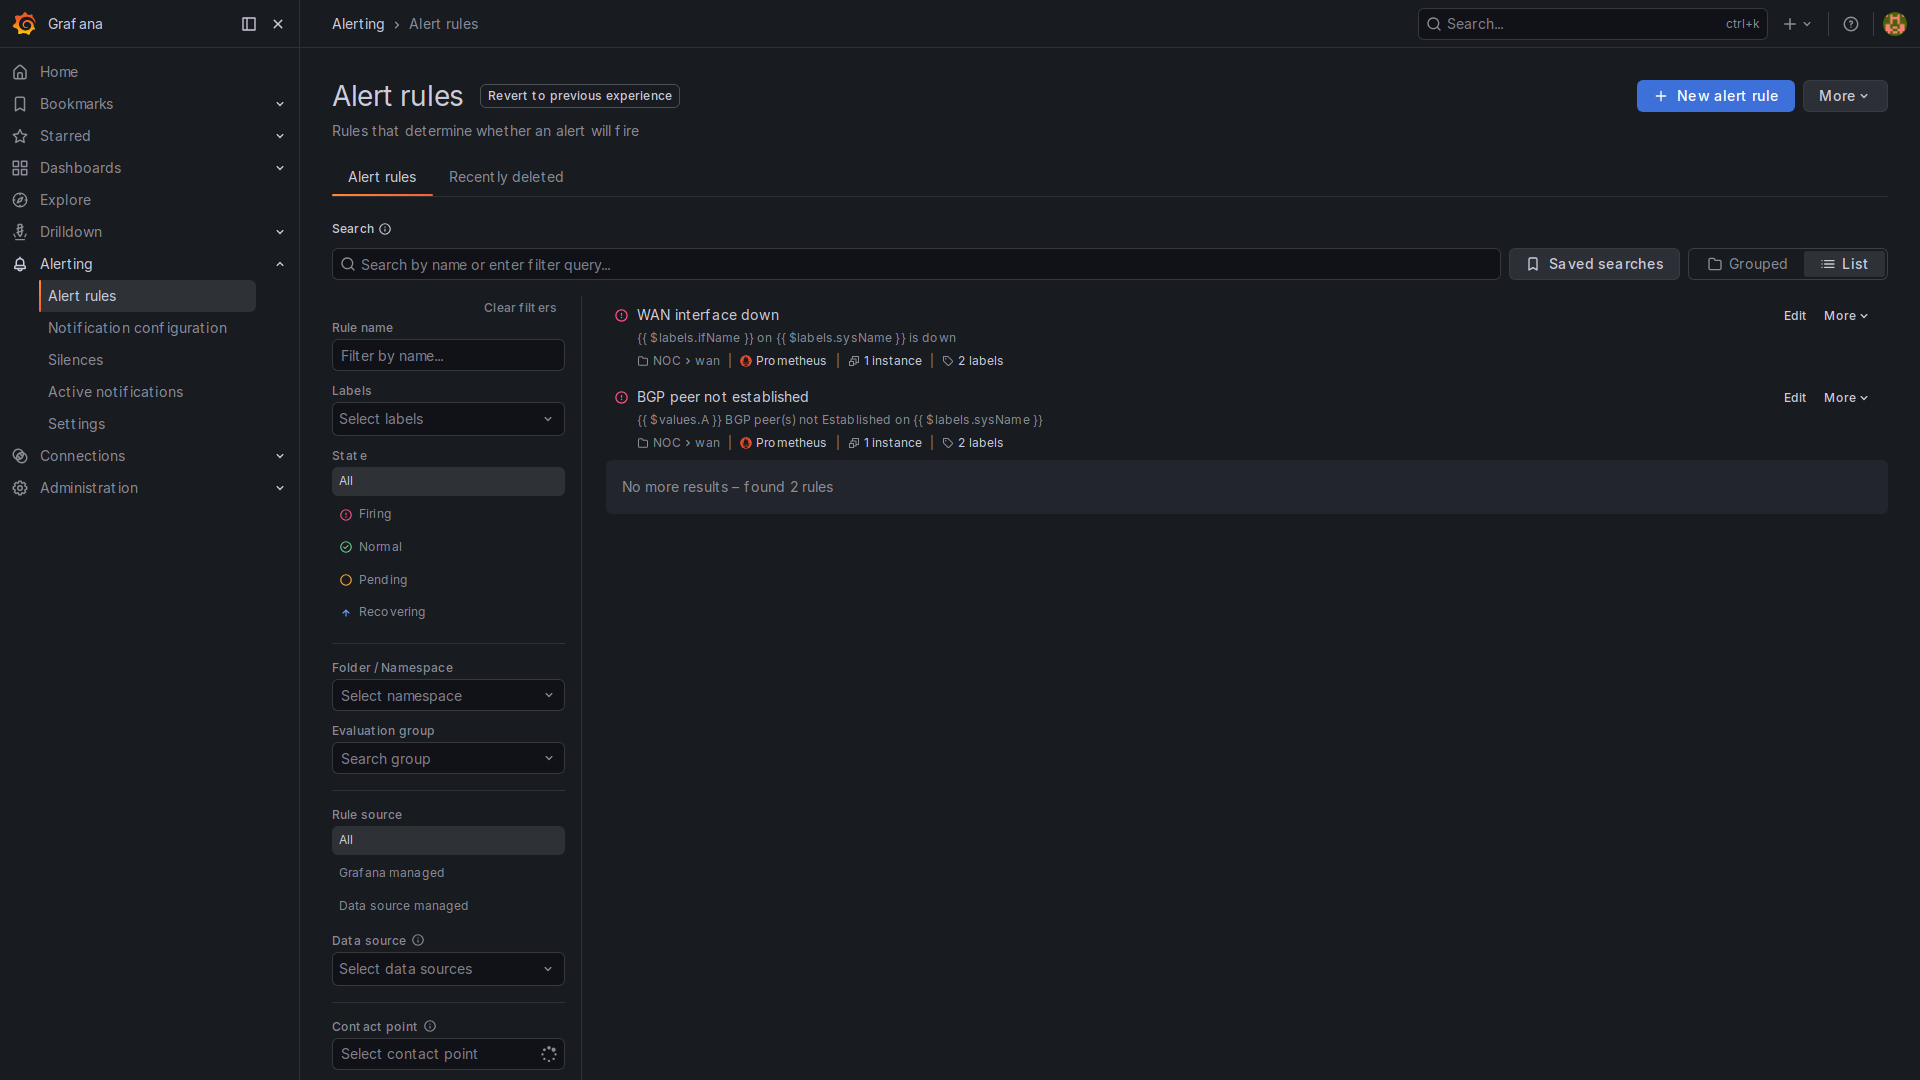
Two alert rules
Both rules live in a folder called NOC, in an evaluation group called wan that runs every 10 seconds. Each has a Prometheus query (A) and a threshold expression (B) that sets the condition.
WAN interface down uses the 10-second interface status from Telegraf, where 1 is up and 2 is down:
# A
max by (sysName, ifName) (ifx_ifOperStatus{job="telegraf", ifName="Et0/1"})
# B: threshold, A is above 1
# pending period: 20s
# labels: severity=critical, team=wan
# summary: {{ $labels.ifName }} on {{ $labels.sysName }} is down
BGP peer not established counts peers whose bgpPeerState isn't 6 (Established) on each router:
# A
sum by (sysName) (
  (bgpPeerState{job="snmp-cisco-router"} != bool 6)
  * on(instance) group_left(sysName) max by(instance, sysName)(sysName{job="snmp-cisco-router"})
)
# B: threshold, A is above 0
# pending period: 0s
# labels: severity=major, team=wan
# summary: {{ $values.A }} BGP peer(s) not Established on {{ $labels.sysName }}
The != bool 6 part matters. Without bool, the comparison filters series out instead of returning 0, and a router with every peer up returns no data. You'd get "no data" states in place of a clean 0 and a clean resolve.
Each rule is multi-dimensional: one rule produces one alert instance per sysName (and per ifName for the interface rule), so you don't need one rule per router.
Contact points and the policy tree
Two email contact points: noc-email to noc@noc.example.net as the default, and wan-team to wan-team@noc.example.net. Both use the custom template below for subject and body, and both send resolved messages.
The policy tree:
Default policy        -> noc-email
  group by: alertname
  group wait 30s, group interval 2m, repeat 4h

  team = wan          -> wan-team
    group by: sysName
    group wait 45s, group interval 1m, repeat 1h
    mute timing: sunday-maintenance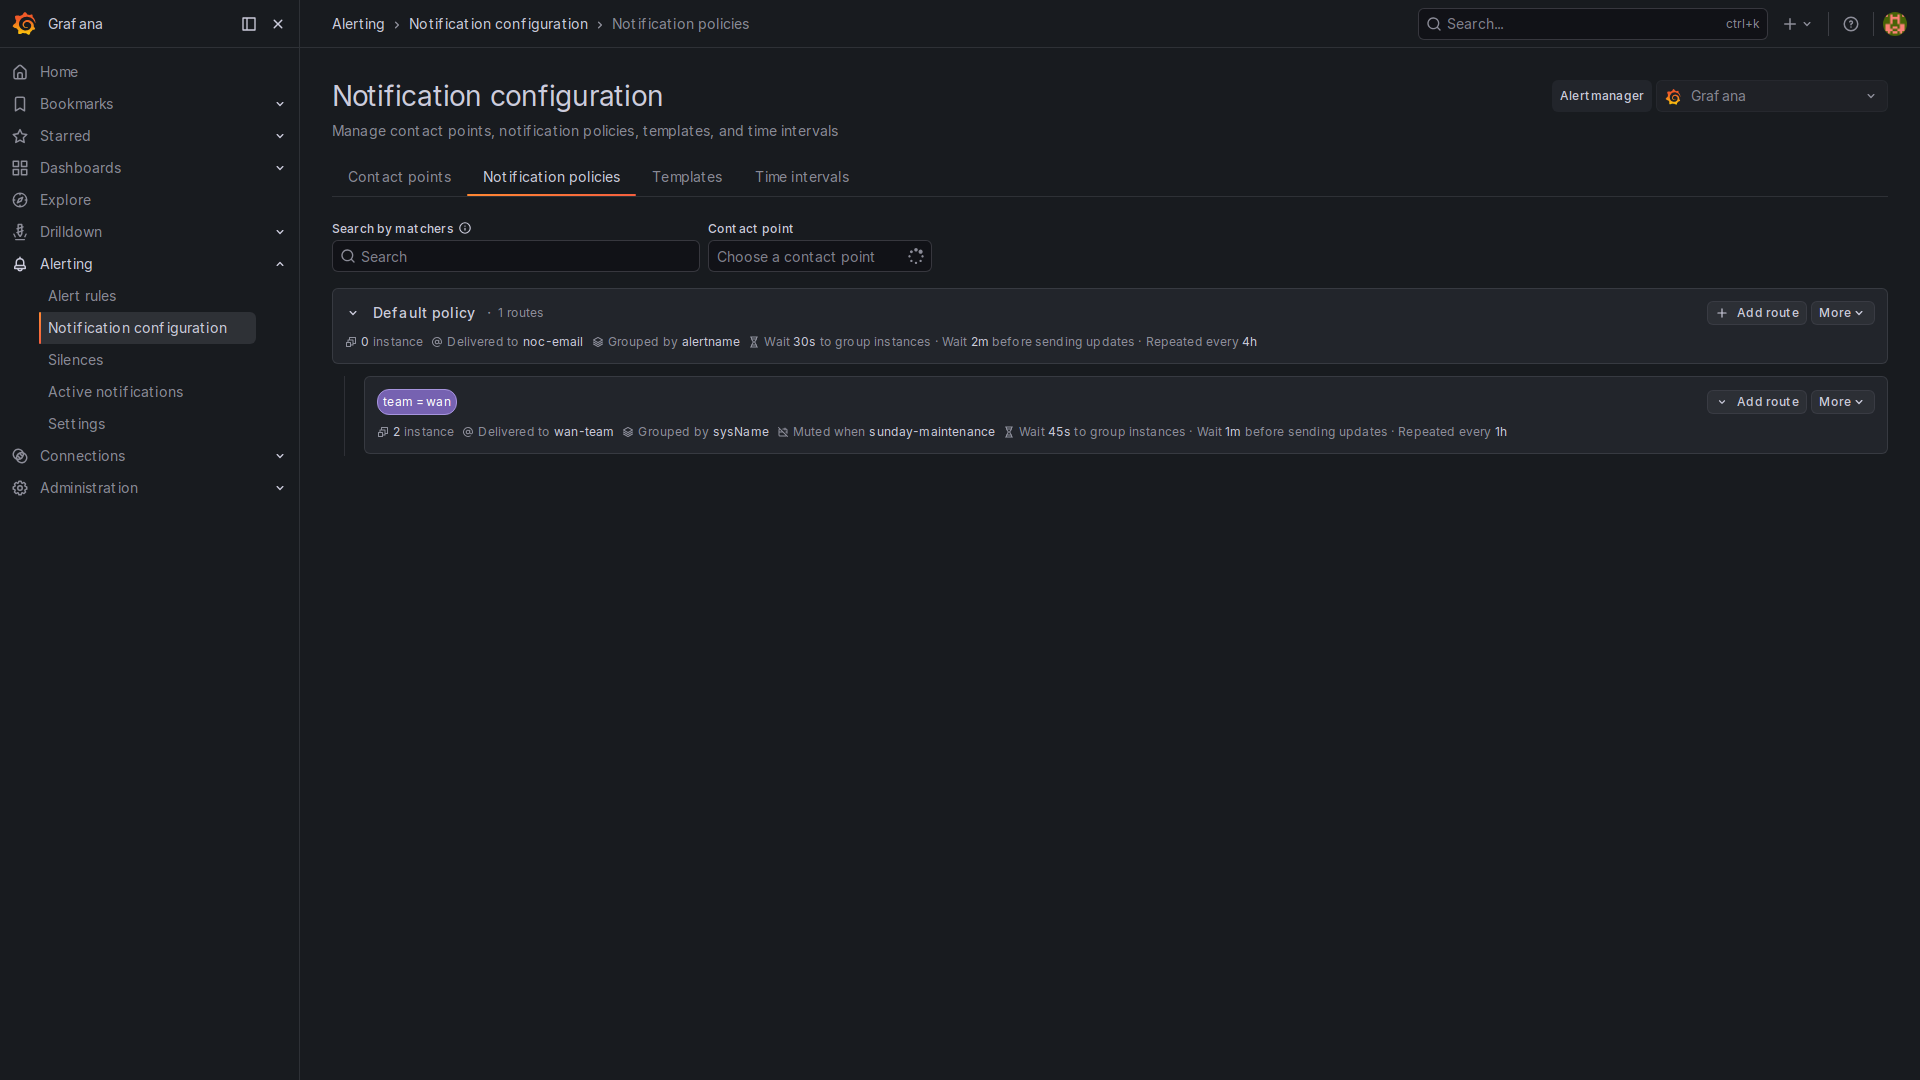
Grouping by sysName on the WAN route is the important choice. When a WAN link drops, the interface alert and the BGP alert for that router are really one incident. Grouped by router, they arrive in one email. Grouped by alertname (the default), you'd get one email per rule, and on a bigger network one email listing every router with a BGP problem.
The three timers:
- Group wait (45s) is how long a new group waits before the first email, so related alerts that fire a few seconds apart can join it.
- Group interval (1m) is the minimum gap between emails for a group that has changed, for example a new alert or a resolve.
- Repeat interval (1h) re-sends a group that's still firing and hasn't changed.
Mute timing
The sunday-maintenance mute timing covers Sunday 02:00 to 04:00, America/Los_Angeles. It's attached to the WAN route only, so the NOC's default route still gets everything else. Alerts still evaluate and show as firing in Grafana during the window. Only the notifications are suppressed. If something is still broken when the window ends, the email goes out then.
name: sunday-maintenance
time_intervals:
- weekdays: [sunday]
  times: [{start_time: "02:00", end_time: "04:00"}]
  location: America/Los_Angeles
The email template
The default email lists every label and annotation, which is a lot to read at 3 AM. This notification template keeps it to what the on-call engineer needs:
{{ define "pl.subject" }}[{{ .Status | toUpper }}{{ if eq .Status "firing" }}:{{ .Alerts.Firing | len }}{{ end }}] {{ .GroupLabels.SortedPairs.Values | join " " }}{{ end }}

{{ define "pl.body" }}{{ range .Alerts.Firing }}FIRING  {{ .Labels.alertname }}
  device:   {{ .Labels.sysName }}
  object:   {{ or .Labels.ifName "-" }}
  severity: {{ .Labels.severity }}
  summary:  {{ .Annotations.summary }}
  since:    {{ .StartsAt.Format "15:04:05 MST" }}
{{ end }}{{ range .Alerts.Resolved }}RESOLVED  {{ .Labels.alertname }} on {{ .Labels.sysName }} {{ or .Labels.ifName "" }} at {{ .EndsAt.Format "15:04:05 MST" }}
{{ end }}{{ end }}
The contact point uses {{ template "pl.subject" . }} as the subject and {{ template "pl.body" . }} as the message.
My first version looped over all alerts with one block, and the resolved email came out wrong in two ways. The summary said 0 BGP peer(s) not Established, because annotations are rendered with the latest value, and that value is 0 once the alert resolves. And "started" showed the same time as "resolved". Splitting the template into .Alerts.Firing and .Alerts.Resolved, and giving resolved alerts a one-line message with only EndsAt, fixed both.
The times are UTC because that's the server's time zone. For a single-site team you may prefer local time; for a NOC covering several time zones, UTC is usually the right call.
Test 1: a WAN link goes down
On wan-rtr1:
interface Ethernet0/1
 shutdown
What happened, all times UTC:
- 03:42:50: BGP peer not established started firing on wan-rtr1. Its pending period is 0s, and the router reported the BGP session down at the same moment the interface went down.
- 03:43:05: the first email,
[FIRING:1] wan-rtr1.lab, with just the BGP alert. - 03:43:30: WAN interface down started firing, after its 20-second pending period.
- 03:44:05:
[FIRING:2] wan-rtr1.lab, both alerts in one email, one group interval after the first.
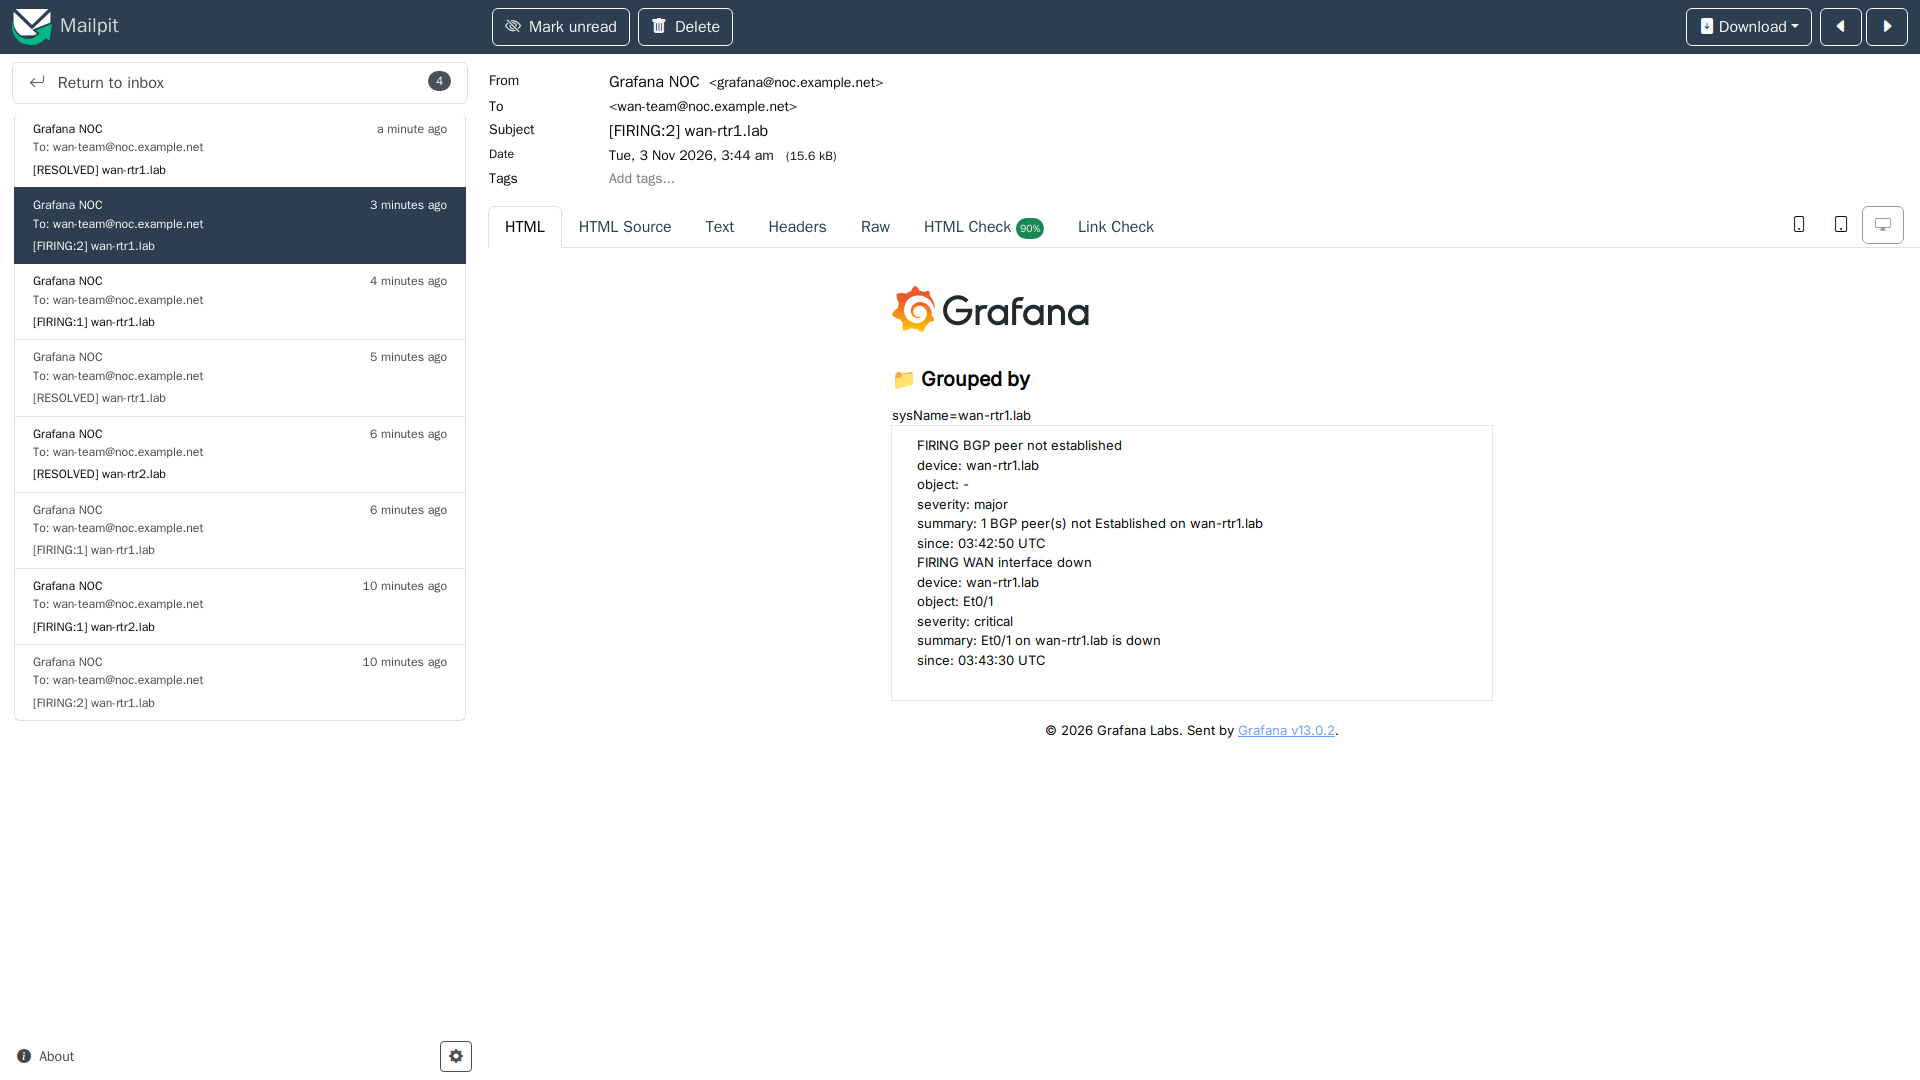
The BGP alert won the race even though the interface is the root cause, because the BGP rule has no pending period and the interface rule waits 20 seconds. The timing of the emails needs a closer look, though. This was my second run. On the first run, a few minutes earlier, the BGP alert fired at 03:35:50, the interface alert at 03:36:20, and the first email went out at 03:36:35 with both alerts, exactly 45 seconds (group wait) after the first alert. That's grouping working as designed.
On the second run the first email went out only 15 seconds after the BGP alert, with one alert in it. The wan-rtr1 group from the first run still existed in Alertmanager, so the new alert didn't start a fresh group wait. It went out on the group's next group-interval tick, and the interface alert followed on the tick after that. If you test alerting by breaking the same thing twice in a few minutes, expect the second round to look different. If you want root cause and symptoms in the same first email, give the symptom rule (BGP here) a longer pending period than the cause.
Test 2: recovery
interface Ethernet0/1
 no shutdown
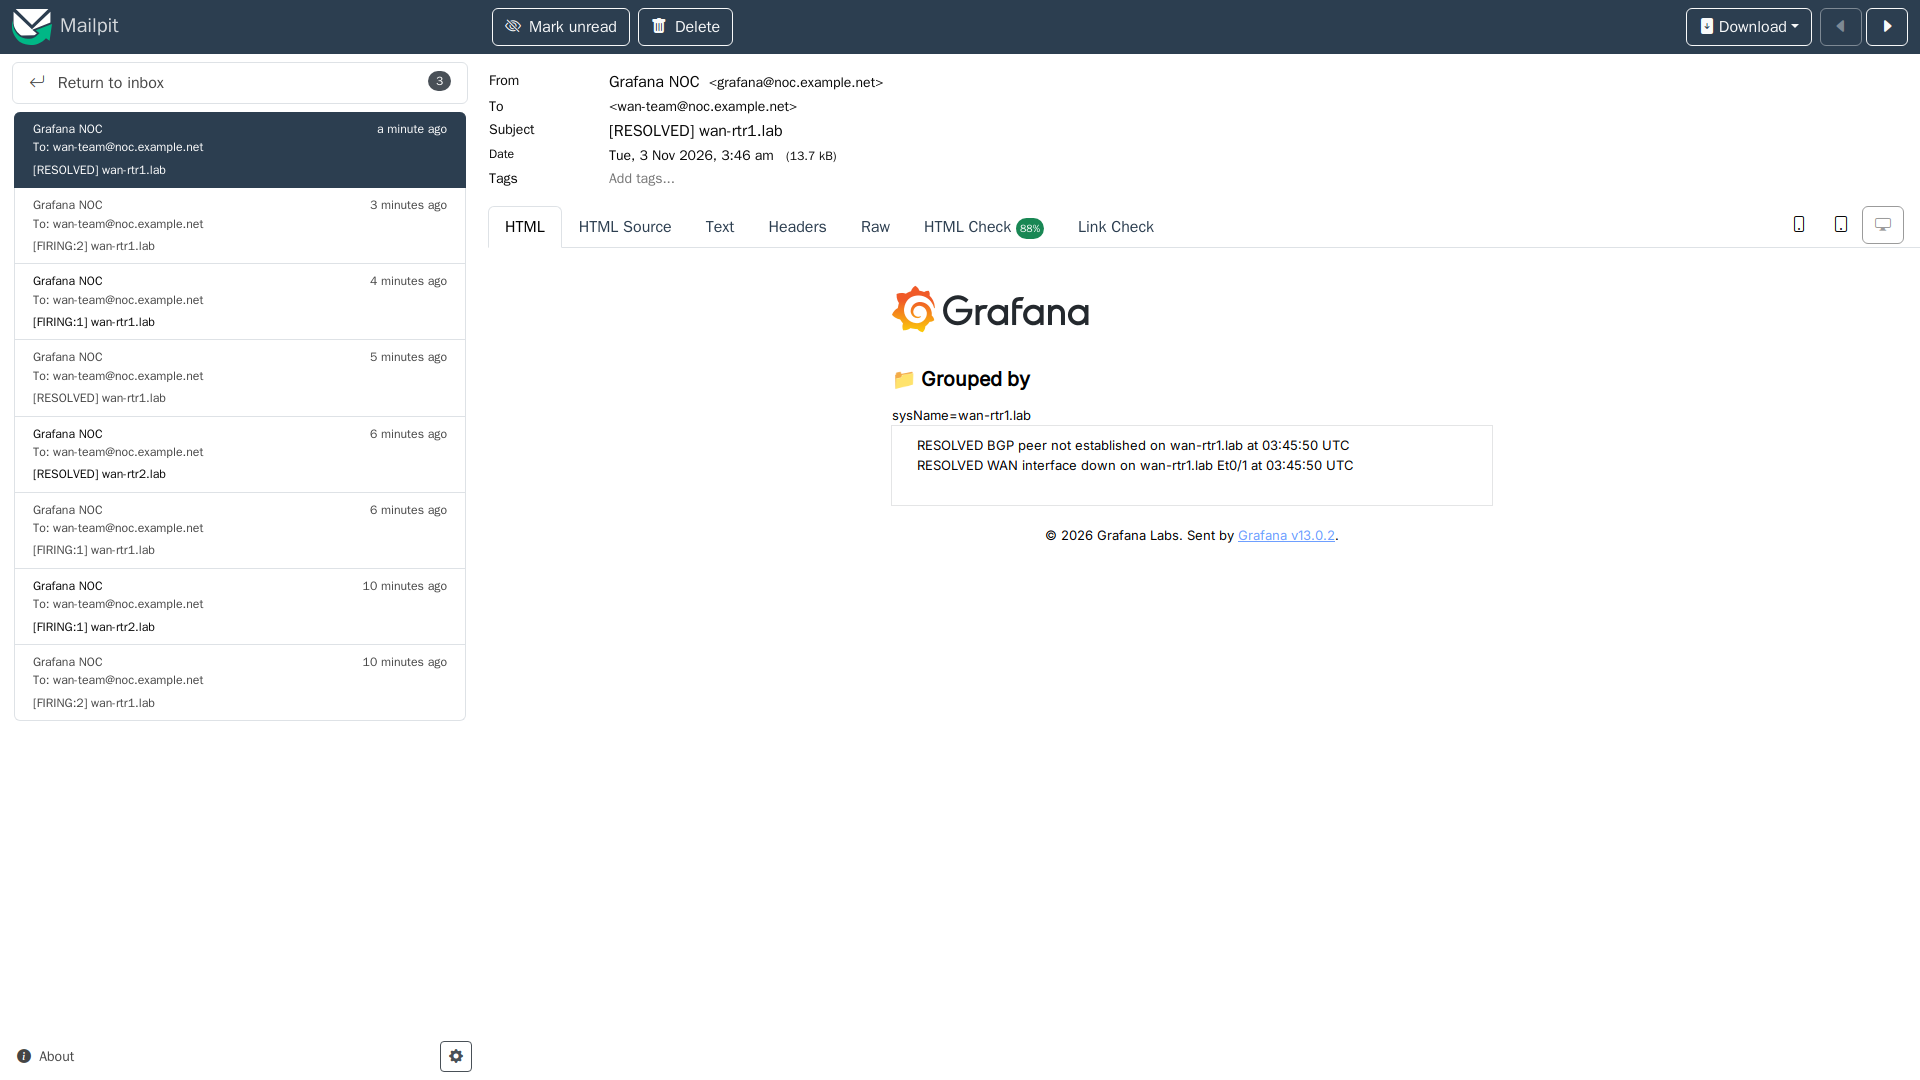
Both alerts resolved at 03:45:50 and arrived in one [RESOLVED] wan-rtr1.lab email with one line per alert:
Silences
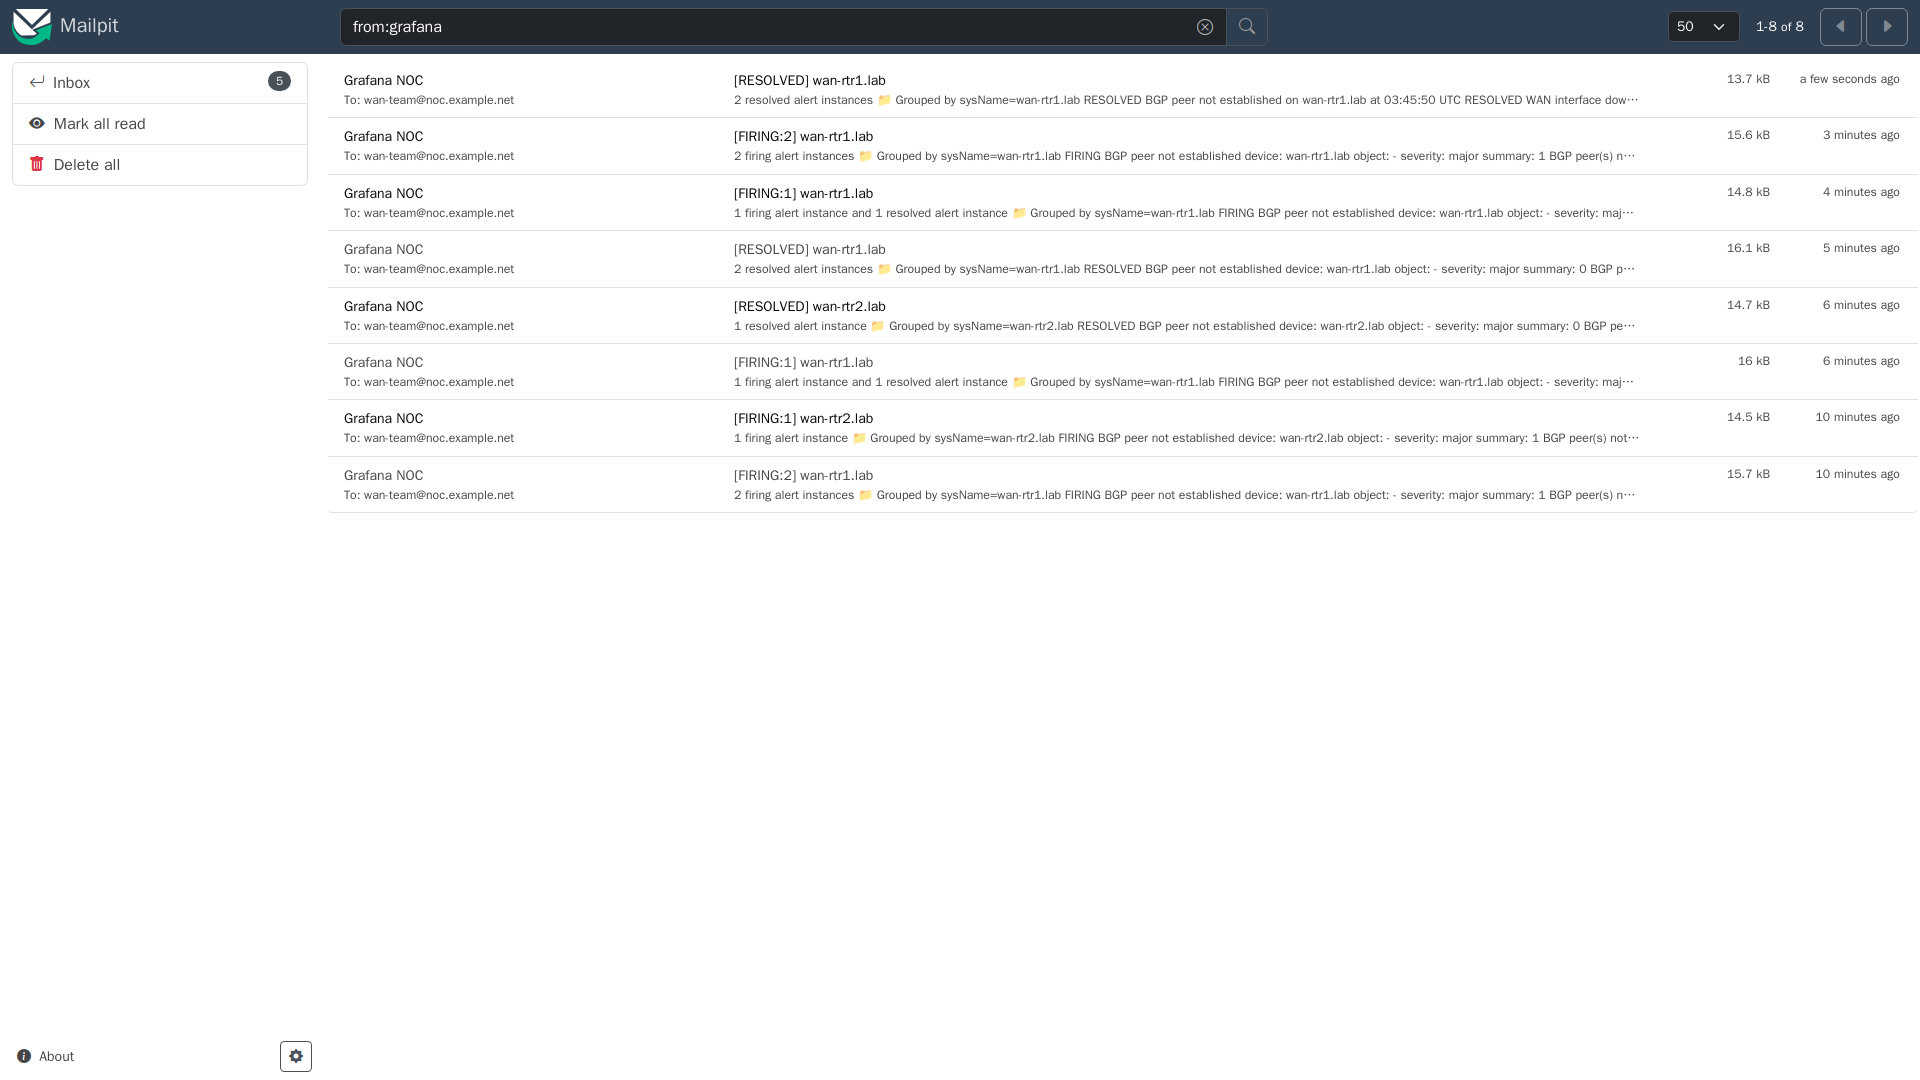
Before this second test I added a silence: matcher sysName=wan-rtr2.lab, one hour, comment "CHG-1042 wan-rtr2 carrier work". Taking wan-rtr1's link down also drops the BGP session on wan-rtr2, its peer, so wan-rtr2 fired its own BGP alert, just as it had in an earlier unsilenced run.
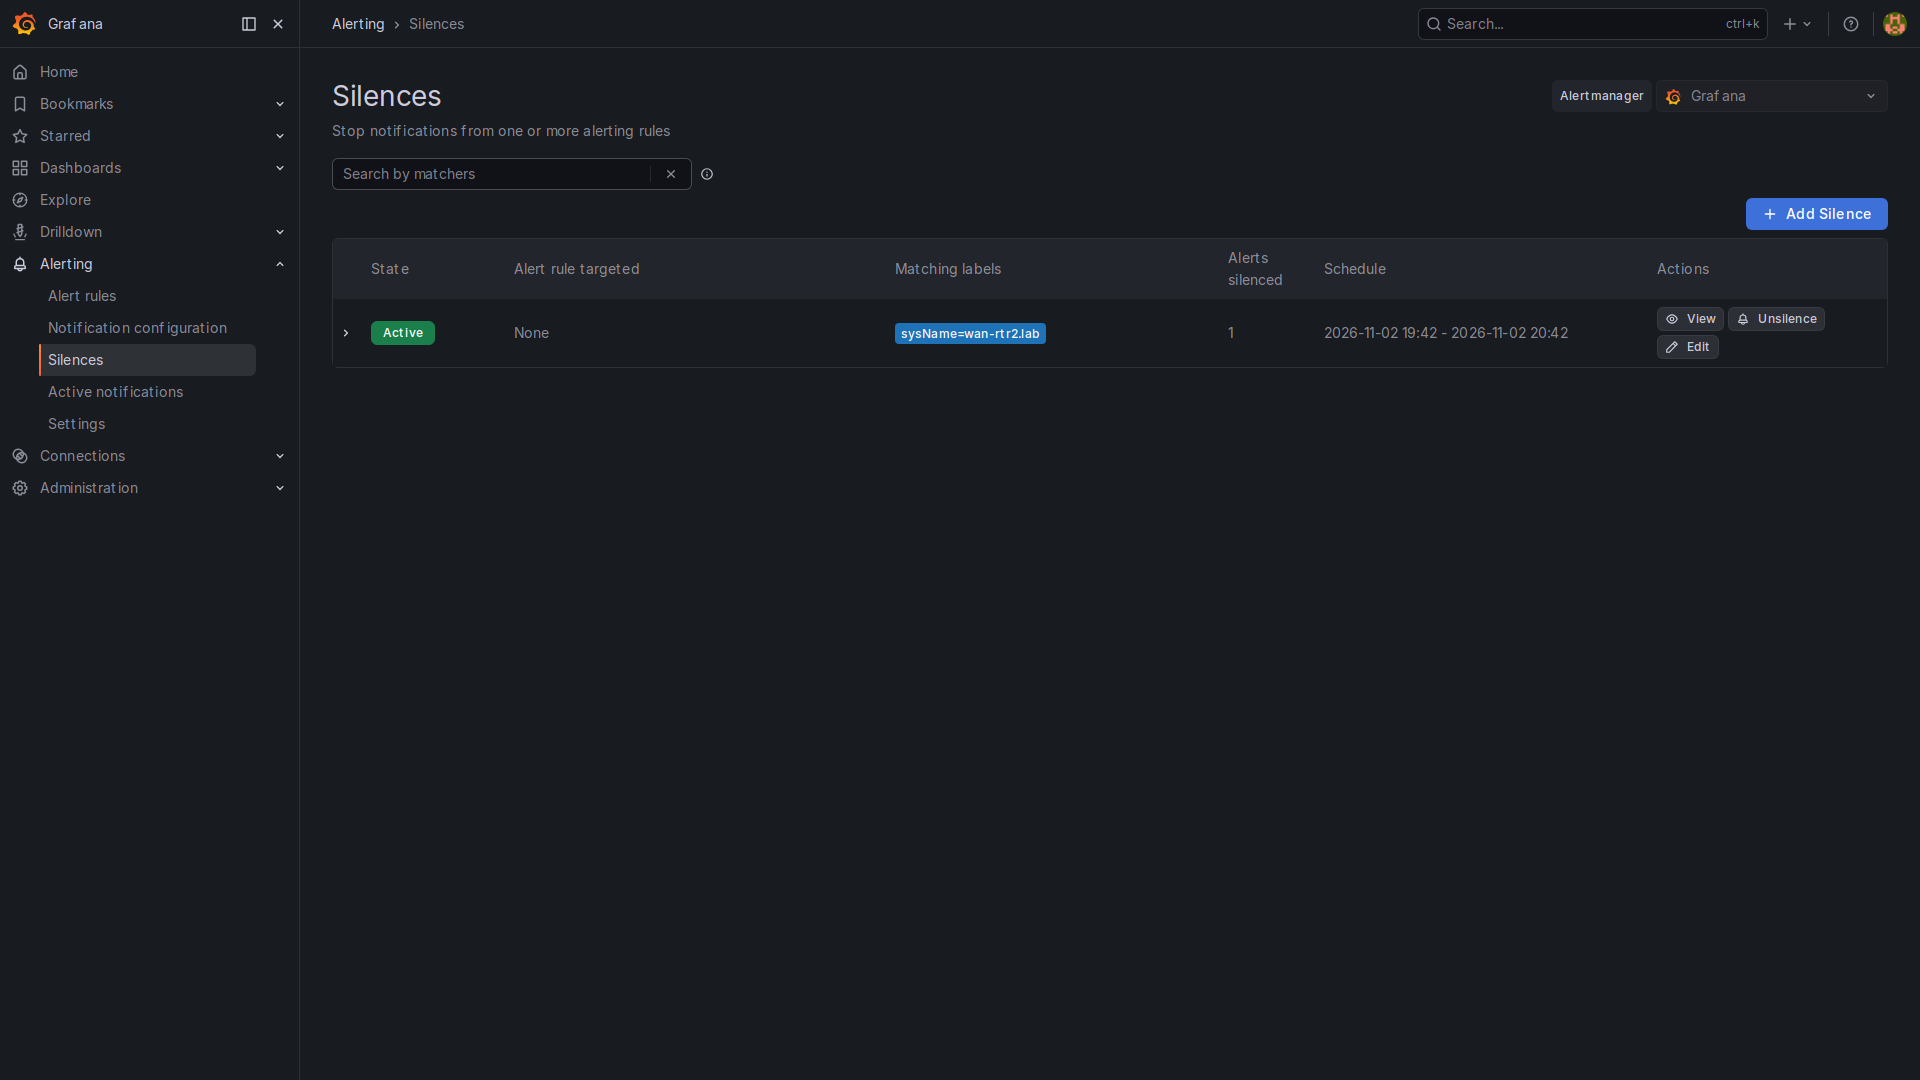
The silences page showed one alert silenced, and no wan-rtr2 email arrived. On the earlier unsilenced run the same event produced [FIRING:1] wan-rtr2.lab and a matching resolved email. Here's the mailbox for both runs:
Silence or mute timing? Use a silence for one-off work tied to a ticket, matched on the device or the alert, with an end time and a comment saying why. Use a mute timing for recurring windows that apply to a whole route. A silence nobody remembered to remove is just as bad as an alert nobody acts on, so keep them short.
Provision it as code
I built everything through the alerting provisioning API instead of clicking through the UI, so the setup can be rebuilt:
PUT  /api/v1/provisioning/templates/pl-email
POST /api/v1/provisioning/contact-points
POST /api/v1/provisioning/mute-timings
PUT  /api/v1/provisioning/policies
POST /api/v1/provisioning/alert-rules
PUT  /api/v1/provisioning/folder/noc/rule-groups/wan     # interval: 10
POST /api/alertmanager/grafana/api/v2/silences
Send the header X-Disable-Provenance: true if you want to be able to edit the objects in the UI afterwards. Without it, Grafana marks them as provisioned and locks them.
Takeaways
- Rules set labels, and policies route on labels. Keep contact points out of the rules.
- Group network alerts by device so a link failure is one email, not three.
- Use
boolcomparisons in PromQL so healthy targets return 0 instead of no data. - Check what your template does with resolved alerts. Annotations use the latest value.
- Pending periods decide which alert arrives first. Set them so the root cause wins.
- Silences for tickets, mute timings for schedules.
Now live: NetFlow and IPFIX in Grafana, flow data from Cisco IOS XE in Loki with top talkers.