
The Zabbix series polled two IOS XE routers and an access switch over SNMPv3. This post points Prometheus at the same three devices, using the same SNMPv3 user, and builds a dark Grafana board on top. I ran it on Prometheus 3.15.1, snmp_exporter 0.31.0 and Grafana OSS 13.0.2, against IOS XE 17.18.2. Every number and screenshot below comes from that setup.

How the pieces fit
Prometheus doesn't speak SNMP. snmp_exporter does the SNMP work, and Prometheus calls it over HTTP for each target:
GET http://snmp-exporter:9116/snmp?target=10.66.20.11&module=cisco_iosxe&auth=cisco_v3The exporter walks the OIDs listed in the module, using the credentials named in the auth, and returns metrics. Prometheus stores them. Grafana queries Prometheus. That means one exporter can serve every device, and the device list lives in the Prometheus config.
Device side: let the exporter in
The routers already had a read-only SNMPv3 user in group ZBX-RO, locked to ACL ZBX-SNMP. The only change needed was one more ACL line for the exporter's address on each device:
ip access-list standard ZBX-SNMP
 permit 10.66.20.41
!
snmp-server group ZBX-RO v3 priv read ZBX-VIEW access ZBX-SNMP
snmp-server user zbxmon ZBX-RO v3 auth sha <AUTH_PASS> priv aes 128 <PRIV_PASS> access ZBX-SNMP
One finding was useful. I tried to move the access switch to authPriv as well, and it didn't work. On the L2 switch image I used, snmp-server group ZBX-RO v3 priv ... returns % Invalid input detected, so the switch stays on authNoPriv: SHA authentication with no encryption. Check what your switch image accepts before you write one auth profile for every device. Deleting and re-adding the group also invalidated the existing user. The exporter then logged incoming packet is not authentic until I re-entered the snmp-server user line.
Build the module with the generator
snmp_exporter doesn't read MIBs at run time. You describe what to walk in generator.yml. The generator resolves it against the MIB files and writes snmp.yml. I kept the MIB set small: SNMPv2-MIB, IF-MIB, BGP4-MIB, OSPF-MIB and their imports. A smaller walk means a faster poll.
auths:
  cisco_v3:
    version: 3
    security_level: authPriv
    username: SNMP_USER_PLACEHOLDER
    password: AUTH_PLACEHOLDER
    auth_protocol: SHA
    priv_protocol: AES
    priv_password: PRIV_PLACEHOLDER
modules:
  cisco_iosxe:
    walk:
      - sysUpTime
      - sysName
      - ifTable
      - ifXTable
      - bgpPeerTable
      - ospfNbrTable
    lookups:
      - source_indexes: [ifIndex]
        lookup: ifName
      - source_indexes: [ifIndex]
        lookup: ifAlias
    overrides:
      ifName: {ignore: true}
      ifAlias: {ignore: true}
      ifDescr: {ignore: true}
      ifType: {type: EnumAsInfo}
      ifAdminStatus: {type: gauge}
      ifOperStatus: {type: gauge}
      ifInOctets: {ignore: true}
      ifOutOctets: {ignore: true}
      ifSpecific: {ignore: true}
generator generate -m ./mibs -g generator.yml -o snmp.ymlThree of these choices matter:
- Lookups turn
ifIndexintoifNameandifAliaslabels, so the graphs say "Et0/1 to wan-rtr2" instead of "ifIndex 2". - Ignoring the 32-bit octet counters leaves only
ifHCInOctets/ifHCOutOctets. A 32-bit counter wraps in under six minutes at 100 Mb/s, which is too close to the scrape interval. - Status as gauge keeps
ifOperStatusas a plain 1/2 number that's easy to compare.
Keep the secrets out of snmp.yml
snmp_exporter accepts more than one --config.file. I removed the auths block from the generated file and put the real credentials in a separate auth.yml, with mode 600:
snmp_exporter --config.file=snmp.yml --config.file=auth.yml

# auth.yml
auths:
  cisco_v3:
    version: 3
    security_level: authPriv
    username: <SNMP_USER>
    password: <AUTH_PASS>
    auth_protocol: SHA
    priv_protocol: AES
    priv_password: <PRIV_PASS>
  cisco_v3_authnopriv:
    version: 3
    security_level: authNoPriv
    username: <SNMP_USER>
    password: <AUTH_PASS>
    auth_protocol: SHA
Now snmp.yml can go in Git and be regenerated freely, and the secrets never leave the one host.
Test a device by hand before Prometheus touches it:
curl -s "http://10.66.20.41:9116/snmp?target=10.66.20.11&module=cisco_iosxe&auth=cisco_v3" | grep -E '^(sysName|bgpPeerState|ospfNbrState|snmp_scrape)'
sysName{sysName="wan-rtr1.lab"} 1
bgpPeerState{bgpPeerRemoteAddr="10.0.12.2"} 6
ospfNbrState{ospfNbrIpAddr="10.0.12.2"} 8
snmp_scrape_duration_seconds{module="cisco_iosxe"} 0.11
snmp_scrape_pdus_returned{module="cisco_iosxe"} 259
BGP state 6 is Established and OSPF state 8 is Full. The whole walk took 0.11 seconds.
The Prometheus scrape config
Use one job per auth profile. The relabelling moves the device address into the target parameter, keeps it as the instance label, and sends the actual HTTP request to the exporter:
scrape_configs:
  - job_name: snmp-cisco-router
    scrape_interval: 60s
    scrape_timeout: 30s
    metrics_path: /snmp
    params:
      module: [cisco_iosxe]
      auth: [cisco_v3]
    static_configs:
      - targets: [10.66.20.11, 10.66.20.12]
        labels: {role: router}
    relabel_configs:
      - source_labels: [__address__]
        target_label: __param_target
      - source_labels: [__param_target]
        target_label: instance
      - target_label: __address__
        replacement: 10.66.20.41:9116

  - job_name: snmp-cisco-switch
    # same as above, with:
    params:
      module: [cisco_iosxe]
      auth: [cisco_v3_authnopriv]
    static_configs:
      - targets: [10.66.20.21]
        labels: {role: switch}

  - job_name: snmp-exporter
    static_configs:
      - targets: [10.66.20.41:9116]
Sixty seconds matches what Zabbix was doing. SNMP CPU on the device is the cost, so don't scrape at Prometheus's default 15 seconds unless you need to. On Status > Targets, all four targets showed up.
The Grafana board
I added Prometheus as a data source in Grafana. Then I generated real traffic across the WAN link with long ping runs between the routers and the switch, so the graphs had something to show.
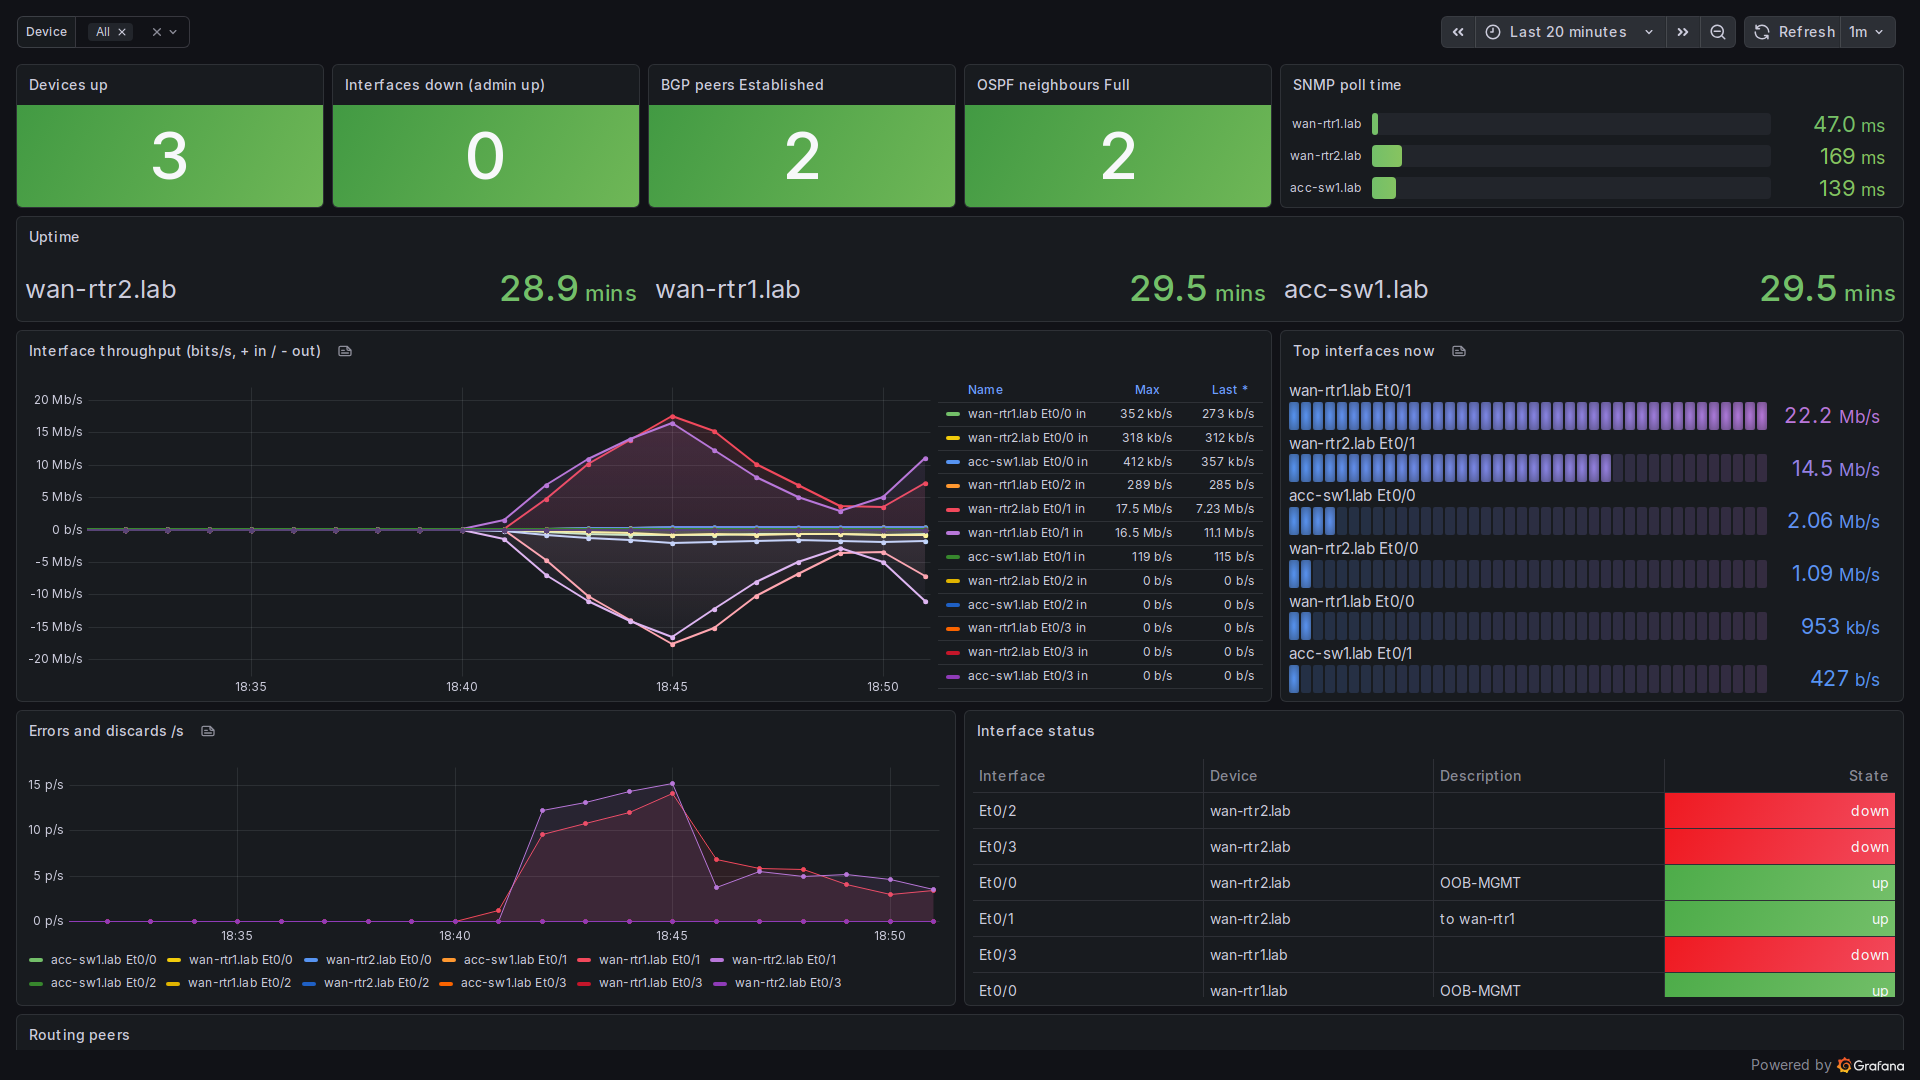
The useful queries:
# throughput, labelled with the device's own hostname
rate(ifHCInOctets{job=~"snmp-cisco-(router|switch)",ifName=~"Et.*"}[5m]) * 8
  * on(instance) group_left(sysName) max by(instance, sysName)(sysName)

# interfaces that are down but admin up
count((ifOperStatus == 2) and on(instance, ifIndex) (ifAdminStatus == 1)) or vector(0)

# BGP sessions Established, OSPF neighbours Full
count(bgpPeerState == 6)
count(ospfNbrState == 8)
Two of these are worth explaining:
- The
max by(instance, sysName)wrapper. My first version joined straight ontosysNameand the throughput panel showed an error. When I renamed the scrape job, old and newsysNameseries overlapped in the time range, so the join matched twice. Wrapping the right-hand side inmax bymakes it robust. - The admin-up filter. wan-rtr2 Et0/2 and the unused Et0/3 ports are shut on purpose. They show down in the status table but don't count as faults.
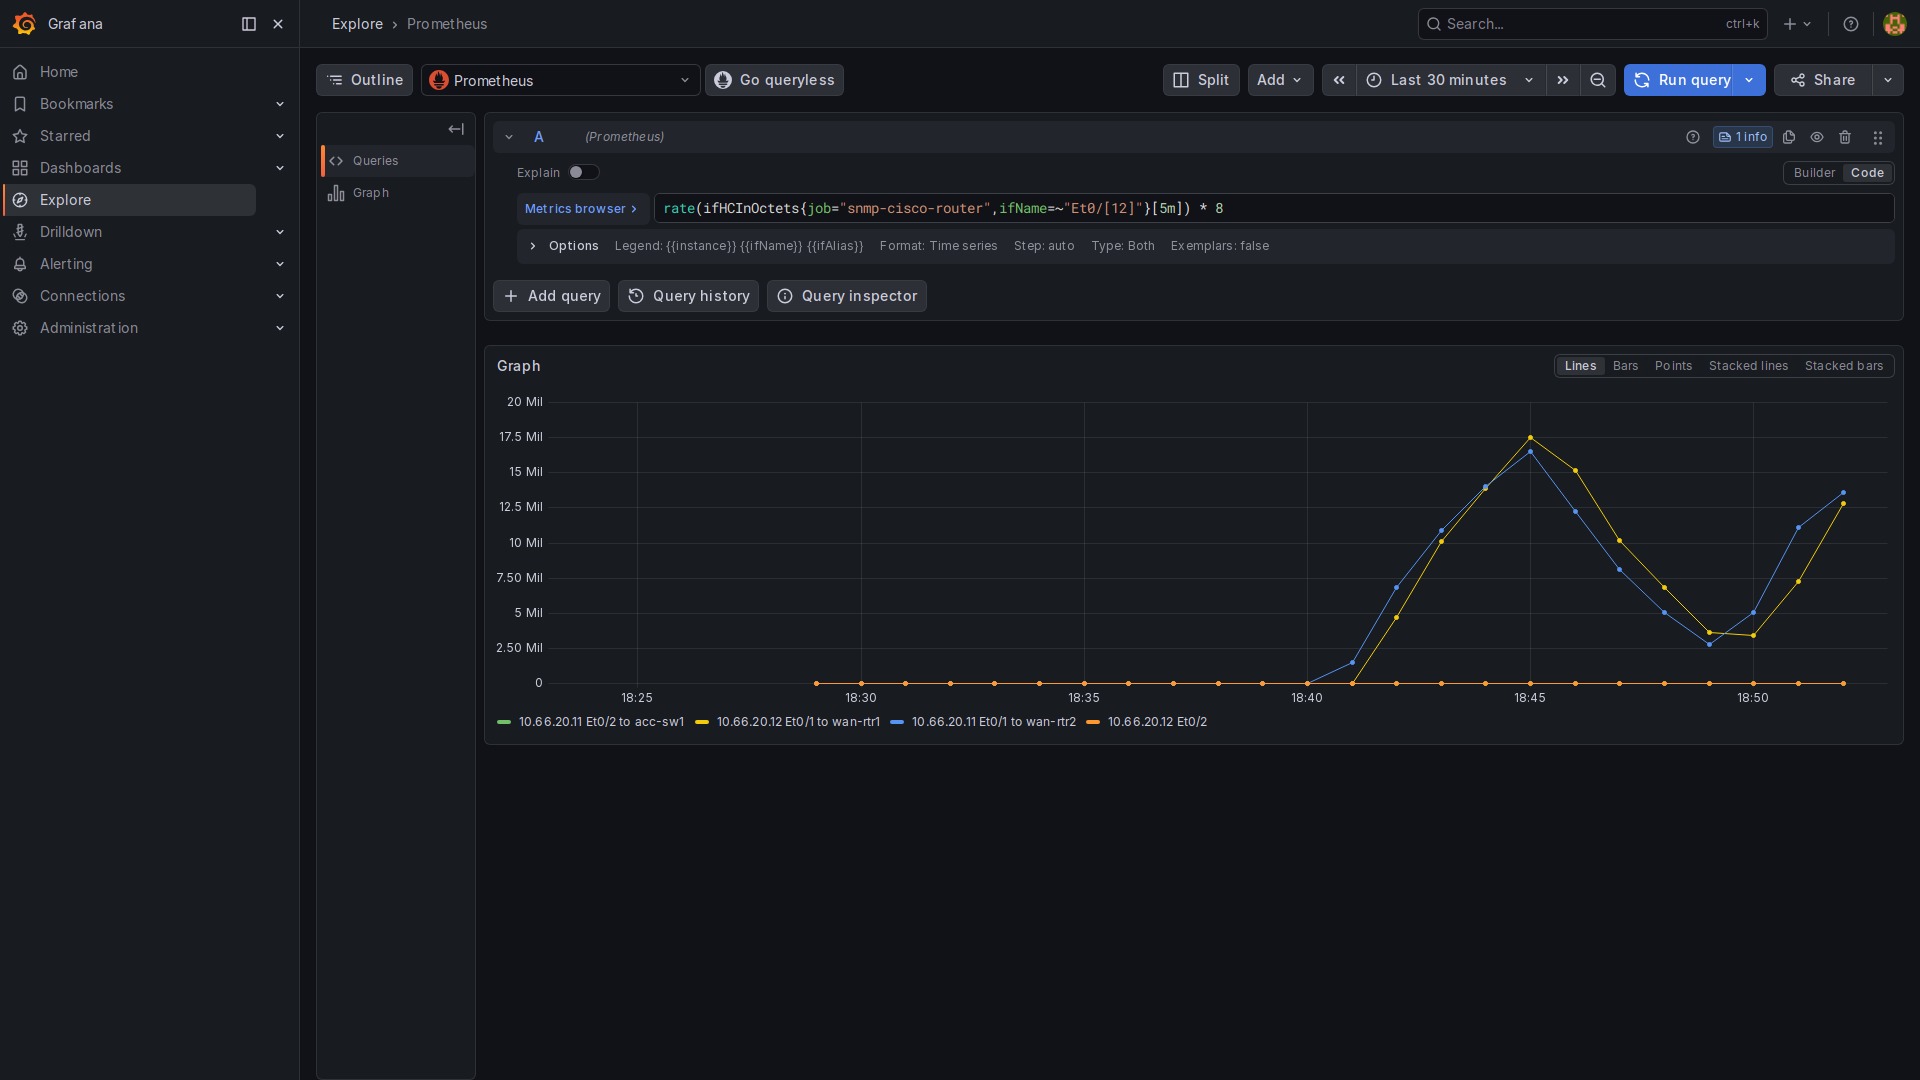
Explore is the quickest way to test a query before it goes on a panel. Here both WAN interfaces track the ping load:
Zabbix or Prometheus?
I've now monitored the same three devices both ways, so here's how they compare.
| Zabbix 7.0 | Prometheus + snmp_exporter | |
|---|---|---|
| Getting started | Link a Cisco template and you get hundreds of items and triggers | You choose every OID, so it takes more work up front |
| Alerting | Triggers, dependencies and escalations built in | PromQL alert rules, then Alertmanager or Grafana alerting |
| Queries | Per-item functions | PromQL joins and aggregates across devices and labels |
| Config | Mostly UI and database, with an API | Plain YAML that fits in Git |
| Traps and syslog | Built in (covered here) | Not handled. Use Loki for syslog |
| Long-term data | History and trends in SQL | Local TSDB, 15 days here, remote-write for longer |
If you want something an operator can run on day one, with dependencies and escalations, use Zabbix. If your team already runs Prometheus for servers, likes config in Git and wants to write cross-device queries, use Prometheus. Both can feed the same Grafana, as the Zabbix NOC dashboard post shows. You don't have to pick only one.
Next up: syslog from these routers into Loki, on a board that puts logs next to these metrics. If you're new to Grafana, start with installing Grafana on Ubuntu. For streaming instead of polling, see model-driven telemetry on IOS XE.
Now live: IOS XE syslog into Loki with Alloy, logs next to these metrics.