
The usual pitch for streaming telemetry goes like this: SNMP polls every minute or so and smooths everything out, gNMI pushes a sample every 10 seconds, so switch to gNMI. Telegraf is a popular collector for that because one agent can subscribe over gNMI, poll SNMP and expose the result to Prometheus. I tried to build exactly that against two Cisco IOS XE 17.18.2 routers, and the gNMI half didn't work. This post covers why, what I ran instead, and what 10-second data actually shows you that 60-second data hides.
This continues the Prometheus and snmp_exporter build and the syslog into Loki post. Same routers, same Prometheus, same Grafana 13.0.2.

Check the device first
gNMI on IOS XE depends on the programmability stack (the same one NETCONF and RESTCONF use). Before you write a single line of collector config, confirm the image has it:
wan-rtr1#show version | include Version
Cisco IOS Software [IOSXE], Linux Software (X86_64BI_LINUX-ADVENTERPRISEK9-M), Version 17.18.2, RELEASE SOFTWARE (fc3)

wan-rtr1#show gnmi-yang state
show gnmi-yang state
      ^
% Invalid input detected at '^' marker.

wan-rtr1#show netconf-yang status
show netconf-yang status
            ^
% Invalid input detected at '^' marker.
The configuration side is the same story: gnmi-yang and netconf-yang are rejected in global config, and show telemetry ietf subscription all doesn't exist either. This build of IOS XE is a Linux-hosted software image without the YANG management process. Hardware platforms (Catalyst 8000, Catalyst 9000, ASR 1000) and the virtual Catalyst 8000V do ship it, so on those you would enable it with something like:
gnmi-yang
gnmi-yang server
gnmi-yang port 50052
! or the TLS server on 9339 with a trustpoint:
gnmi-yang secure-server
gnmi-yang secure-trustpoint <TRUSTPOINT>
I couldn't test that block here, so treat it as a pointer to the right commands, not a verified config. Check the programmability configuration guide for your release before you rely on port numbers or TLS options.
The Telegraf config
Telegraf 1.40.3 runs on a Linux host next to Prometheus. One config file has three parts: a gNMI input, an SNMP input, and a Prometheus output. Credentials come from environment variables in a file only root can read, never from the config itself.
[agent]
  interval = "10s"
  flush_interval = "10s"
  omit_hostname = true

# gNMI dial-in
[[inputs.gnmi]]
  addresses = ["10.66.20.11:9339", "10.66.20.12:9339"]
  username = "${GNMI_USER}"
  password = "${GNMI_PASS}"
  encoding = "json_ietf"
  redial = "30s"
  tls_enable = true
  insecure_skip_verify = true
  [[inputs.gnmi.subscription]]
    name = "ifcounters"
    origin = "openconfig"
    path = "/interfaces/interface/state/counters"
    subscription_mode = "sample"
    sample_interval = "10s"

# SNMPv3 polling every 10s
[[inputs.snmp]]
  agents = ["udp://10.66.20.11:161", "udp://10.66.20.12:161"]
  version = 3
  sec_name = "${SNMP_USER}"
  sec_level = "authPriv"
  auth_protocol = "SHA"
  auth_password = "${SNMP_AUTH}"
  priv_protocol = "AES"
  priv_password = "${SNMP_PRIV}"
  timeout = "5s"
  retries = 1
  [[inputs.snmp.field]]
    name = "sysName"
    oid = ".1.3.6.1.2.1.1.5.0"
    is_tag = true
  [[inputs.snmp.table]]
    name = "ifx"
    inherit_tags = ["sysName"]
    [[inputs.snmp.table.field]]
      name = "ifName"
      oid = ".1.3.6.1.2.1.31.1.1.1.1"
      is_tag = true
    [[inputs.snmp.table.field]]
      name = "ifHCInOctets"
      oid = ".1.3.6.1.2.1.31.1.1.1.6"
    [[inputs.snmp.table.field]]
      name = "ifHCOutOctets"
      oid = ".1.3.6.1.2.1.31.1.1.1.10"
    [[inputs.snmp.table.field]]
      name = "ifOperStatus"
      oid = ".1.3.6.1.2.1.2.2.1.8"

[[outputs.prometheus_client]]
  listen = ":9273"
  metric_version = 2
A few details that cost me a restart each:
- The gNMI TLS switch is
tls_enable. I first wroteenable_tls, and Telegraf refused to start at all: configuration specified the fields ["enable_tls"], but they were not used. Strict config checking is a good thing, but it means one typo in one plugin takes down every input. - Numeric OIDs avoid any MIB loading. The SNMP input works without MIB files on the collector, and the field names you choose become the metric names.
- Since 1.38, Telegraf handles environment variables strictly and logs a warning about it on every start. If a
${VAR}isn't set, it's an error, not an empty string.
What the logs said
With the config loaded, both inputs failed, for different reasons:
E! [inputs.gnmi] Error in plugin: failed to setup subscription: rpc error: code = Unavailable
   desc = connection error: desc = "transport: Error while dialing: dial tcp 10.66.20.11:9339: connect: connection refused"
E! [inputs.snmp] Error in plugin: agent udp://10.66.20.11:161: performing get on field sysName:
   request timeout (after 1 retries): max retries exceeded
The gNMI error is the expected one: nothing listens on 9339 because the image has no gNMI server. A connection refused tells you the IP path is fine and the service is missing. A timeout here would point at an ACL or routing instead.
The SNMP timeout was mine. The routers only answer SNMP from addresses in a standard ACL attached to the SNMPv3 group, and the new collector wasn't in it. SNMPv3 doesn't send an error back for a denied source; it just drops the request, so it looks exactly like a dead agent. The fix on each router:
ip access-list standard ZBX-SNMP
 30 permit 10.66.20.44
!
snmp-server group ZBX-RO v3 priv read ZBX-VIEW access ZBX-SNMP
On the next poll the counters showed up on the Prometheus endpoint:
$ curl -s 10.66.20.44:9273/metrics | grep ^ifx_ifHCInOctets
ifx_ifHCInOctets{agent_host="10.66.20.11",ifName="Et0/0",sysName="wan-rtr1.lab"} 9.3381566e+07
ifx_ifHCInOctets{agent_host="10.66.20.11",ifName="Et0/1",sysName="wan-rtr1.lab"} 3.452056894e+09
ifx_ifHCInOctets{agent_host="10.66.20.11",ifName="Et0/2",sysName="wan-rtr1.lab"} 121624
Scraping Telegraf from Prometheus
Telegraf's prometheus_client output is just another target. Match the scrape interval to the agent interval, or you'll either duplicate samples or throw half of them away:
- job_name: telegraf
  scrape_interval: 10s
  static_configs:
  - targets: ["10.66.20.44:9273"]
10 seconds vs 60 seconds
The point of all this was resolution, so the dashboard puts the same counter from both pipelines on one graph: wan-rtr1 Et0/1 inbound, once from Telegraf every 10 seconds and once from snmp_exporter every 60 seconds.
# Telegraf, 10s
rate(ifx_ifHCInOctets{job="telegraf",sysName="wan-rtr1.lab",ifName="Et0/1"}[30s]) * 8
# snmp_exporter, 60s
rate(ifHCInOctets{job="snmp-cisco-router",instance="10.66.20.11",ifName="Et0/1"}[2m]) * 8
The rate windows differ on purpose. rate() needs at least two samples inside the window, so the window has to be at least two scrape intervals: 30 seconds covers three Telegraf samples, and 2 minutes covers two exporter samples.
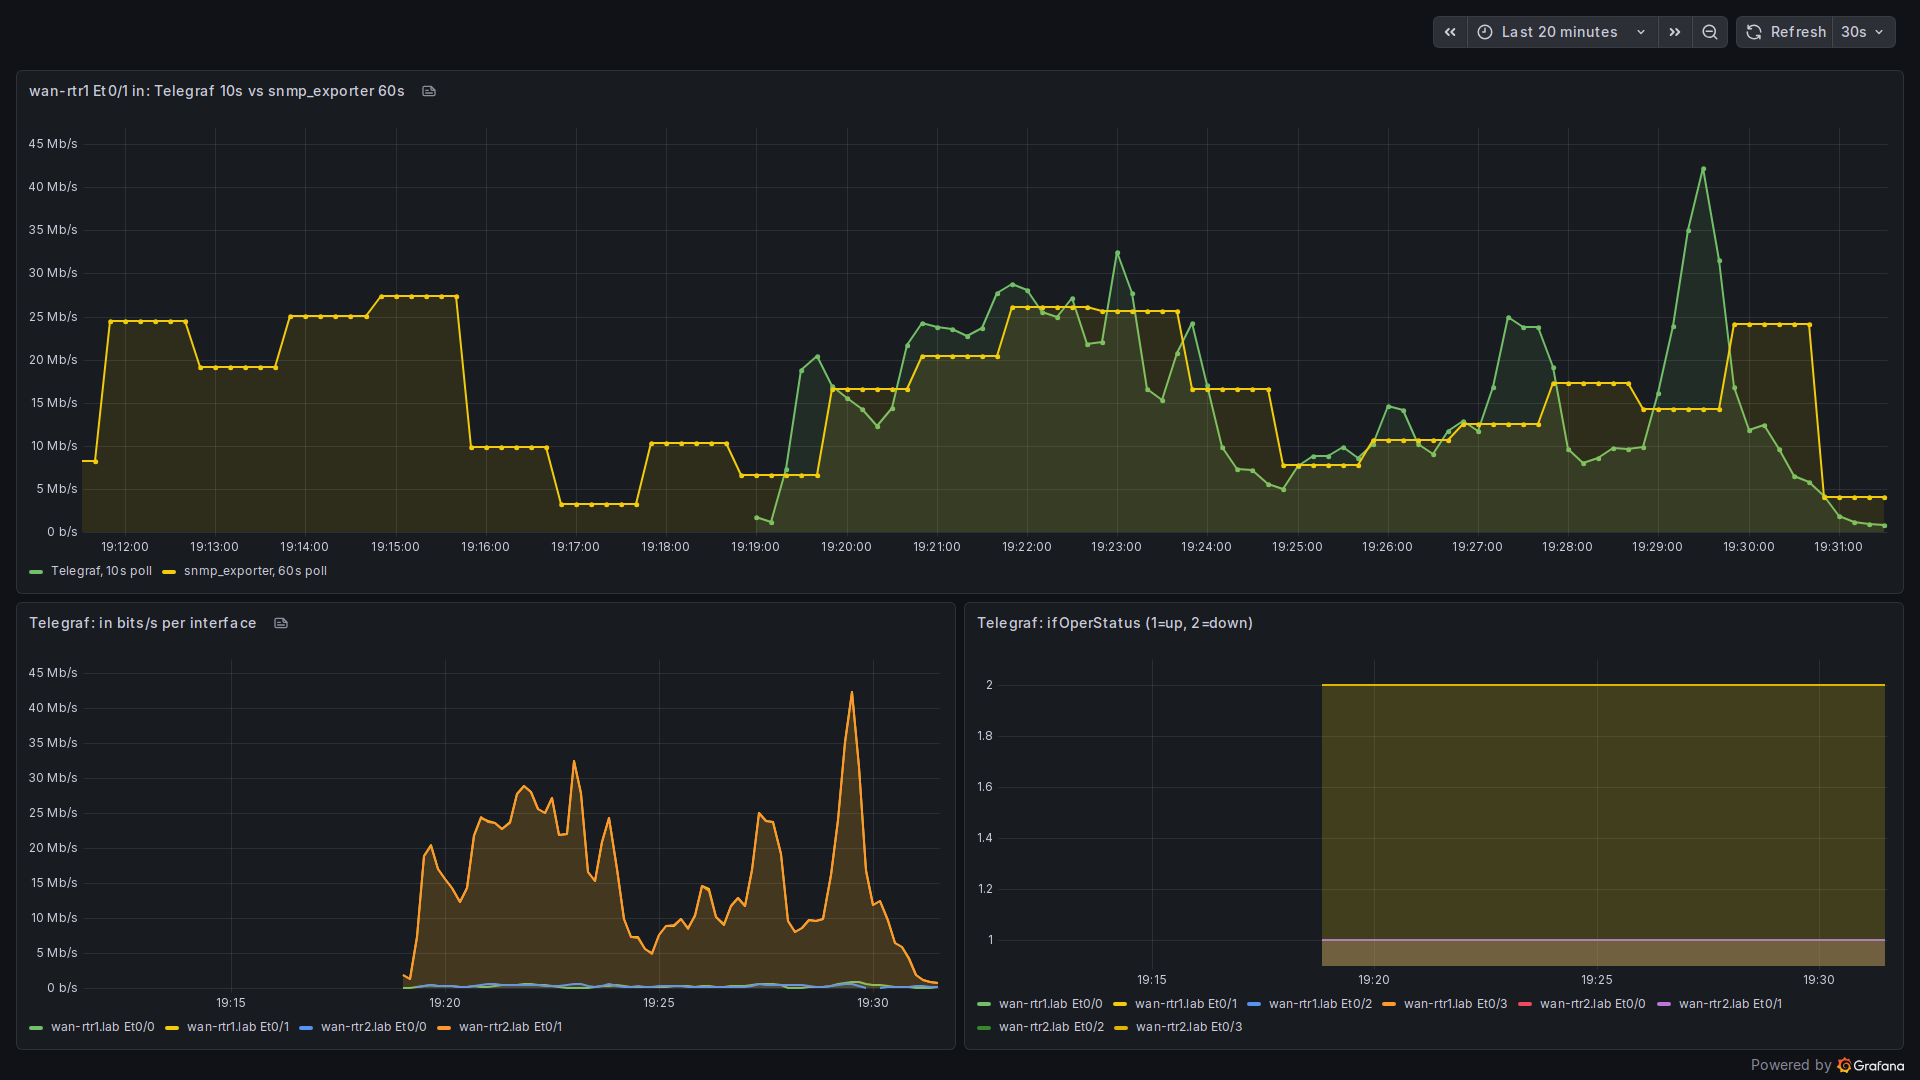
The traffic on that link comes in bursts of one to four minutes with short pauses between them. In this 20-minute window the 10-second line peaks at about 42 Mb/s. The 60-second line never goes above about 26 Mb/s, and while that 42 Mb/s burst was happening it still showed about 14 Mb/s, because its last sample was taken before the burst began. Slow polling doesn't just make the graph smoother. It can put a peak in the wrong minute or hide it completely. If you size links or alert on utilization, the 60-second view can show a link with plenty of headroom while it is actually near its peak in short bursts.
One Grafana gotcha: my first screenshot of this panel showed the Telegraf line with one point per minute, even though Prometheus had a sample every 10 seconds. The query step was following the data source's default interval. Setting the panel's Min interval (query options) to 10s fixed it.
There's a cost. Six times the samples means six times the SNMP load on the router's CPU and six times the storage in Prometheus for those series. Fast polling on a few uplinks is fine. Fast polling every interface on a few hundred switches is the problem streaming telemetry was designed to solve, which is why it's worth checking platform support before you plan around it.
When gNMI is available
On a platform that has the programmability stack, keep the same pipeline and remove the fast SNMP input. The gNMI subscription above gives you the same interface counters as fields of an ifcounters measurement, tagged with the interface name, and the Prometheus side doesn't change. Keep slow SNMP running for things the OpenConfig models on your platform don't cover. Run show gnmi-yang state on the device first, check it says the server is enabled, and look for a connection from the collector before debugging the Telegraf side.
Takeaways
- Check the device supports gNMI before building the collector. On this IOS XE image the commands don't exist at all.
- Connection refused means the service is missing. A timeout means something in the path, often an SNMP ACL, is dropping you.
- Telegraf's SNMP input at 10 seconds is a reasonable stopgap for a few important interfaces.
- Set
rate()windows to at least two scrape intervals of the job you're querying.
Now live: Grafana alerting with contact points, policies and silences.