
SNMP tells you an interface is busy. It doesn't tell you who is making it busy. For that you need flow data. This post sets up Flexible NetFlow on a Cisco IOS XE 17.18.2 router, exports IPFIX to the open source GoFlow2 collector, ships each flow record into Loki with Grafana Alloy and builds a Grafana 13.0.2 dashboard with top talkers, protocol split and a live flow list. It's the fifth part of the Grafana series, built in my home lab.
If you haven't read them, the earlier parts set up SNMP metrics with Prometheus and syslog in Loki. This one reuses that same Loki and Alloy.

The design
The router wan-rtr1 has two inside-facing links: Ethernet0/1 to wan-rtr2 and Ethernet0/2 to the access switch acc-sw1. Flow monitoring runs inbound on both. The path looks like this:
- wan-rtr1 builds flow records and exports them as IPFIX (NetFlow v10) over UDP 2055, sourced from its management interface.
- GoFlow2 v2 listens on UDP 2055, decodes the templates and writes one JSON line per flow to a file.
- Alloy tails that file and pushes each line to Loki with the labels
job="netflow"andexporter. - Grafana queries Loki with LogQL, pulls fields out with
| jsonand adds up bytes withunwrap.
Why Loki and not a dedicated flow database? You already have it from the syslog post, the flow volume from a branch router is small, and LogQL can sum a numeric field. For a busy data centre core you'd want ClickHouse or a purpose-built flow tool. I'll come back to the trade-offs at the end.
Router configuration
Flexible NetFlow has three parts: a record (what to match and collect), an exporter (where to send it) and a monitor (which ties the two together and owns the cache). I used a custom record rather than netflow ipv4 original-input so the fields are explicit.
flow record PL-REC
 match ipv4 source address
 match ipv4 destination address
 match ipv4 protocol
 match transport source-port
 match transport destination-port
 match interface input
 collect interface output
 collect counter bytes long
 collect counter packets long
 collect timestamp absolute first
 collect timestamp absolute last
!
flow exporter PL-GOFLOW
 destination 10.66.20.46 vrf <MGMT-VRF>
 source Ethernet0/0
 transport udp 2055
 export-protocol ipfix
 template data timeout 60
!
flow monitor PL-MON
 exporter PL-GOFLOW
 record PL-REC
!
interface Ethernet0/1
 ip flow monitor PL-MON input
interface Ethernet0/2
 ip flow monitor PL-MON input
Three details matter here:
export-protocol ipfix. The default is NetFlow v9. GoFlow2 handles both, but IPFIX is the standard and carries the same fields.destination ... vrf. My collectors sit on the out-of-band management network, which lives in its own VRF. Without thevrfkeyword the router looks for the collector in the global table and quietly sends nothing.template data timeout 60. The collector can't decode data records until it has the template. Resending it every minute means a collector restart costs you a minute of flows, not 30.
An honest note on cache timeouts
On most IOS XE platforms you'd also set cache timeout active 60 under the monitor so long-lived flows are exported every minute. The IOS XE 17.18.2 image I used doesn't offer the cache command under flow monitor at all:
wan-rtr1(config)#flow monitor PL-MON
wan-rtr1(config-flow-monitor)#?
  collect      Collect tloc loopback interface
  default      Set a command to its defaults
  description  Provide a description for this Flow Monitor
  exit         Exit from Flow Monitor configuration mode
  exporter     Add an Exporter to use to export records
  no           Negate a command or set its defaults
  record       Specify Flow Record to use to define Cache
  statistics   Collect statistics
So the defaults apply: 15 seconds inactive and 1800 seconds active. A flow is exported when it goes quiet for 15 seconds, or after 30 minutes if it never does. That has a real effect on the graphs, which I'll point out below. On a Catalyst 9000 or an ASR/ISR you should set the active timeout to 60.
Verify on the router first
Before touching Grafana, check the router is building flows and sending them:
wan-rtr1#show flow interface
Interface Ethernet0/1
  FNF:  monitor:          PL-MON
        direction:        Input
        traffic(ip):      on
Interface Ethernet0/2
  FNF:  monitor:          PL-MON
        direction:        Input
        traffic(ip):      on

wan-rtr1#show flow monitor PL-MON cache format table
IPV4 SRC ADDR    IPV4 DST ADDR    TRNS SRC PORT  TRNS DST PORT  INTF INPUT  IP PROT  bytes long  pkts long
===============  ===============  =============  =============  ==========  =======  ==========  =========
10.0.12.2        224.0.0.5                    0              0  Et0/1            89        1600         16
10.0.12.2        10.0.12.1                  179          16056  Et0/1             6        1445         29
10.0.12.2        10.255.0.1                   0           2048  Et0/1             1    79847600      57034
10.0.12.2        10.0.12.1                    0           2048  Et0/1             1    72856800      50073
10.0.10.2        10.0.10.1                    0           2048  Et0/2             1    50628000      84380
You can already read the network from this: OSPF hellos (protocol 89), the BGP session to wan-rtr2 (TCP 179) and three ICMP streams. For ICMP, the destination port column holds type and code, so 2048 is 8/0, an echo request.
Then the exporter counters:
wan-rtr1#show flow exporter PL-GOFLOW statistics
Flow Exporter PL-GOFLOW:
  Packet send statistics (last cleared 00:06:46 ago):
    Successfully sent:         4                     (555 bytes)
  Client send statistics:
    Client: Flow Monitor PL-MON
      Records added:           3
        - sent:                3
If "Successfully sent" stays at zero while the cache fills, the problem is the export path (VRF, ACL, source interface), not the monitor. In my case it stayed at zero for the first few minutes for a different reason: every flow was still active and none had aged out yet. show flow monitor PL-MON statistics shows which timer aged each flow, which makes this easy to spot.
The collector
GoFlow2 is a single Go binary from NetSampler. It decodes NetFlow v5, v9, IPFIX and sFlow and writes JSON, which is all I need here:
goflow2 -listen=netflow://:2055 -format=json \
        -transport=file -transport.file=/flows/flows.log
The netflow:// scheme accepts both v9 and IPFIX on the same port. Each flow becomes one line. Trimmed:
{"type":"IPFIX","sampler_address":"10.66.20.11",
 "time_flow_start_ns":1793678209162000000,"time_flow_end_ns":1793678412189000000,
 "bytes":150619800,"packets":105618,
 "src_addr":"10.0.12.2","dst_addr":"10.0.12.1","proto":"ICMP",
 "src_port":0,"dst_port":2048,"in_if":2,"out_if":0, ...}
sampler_address is the exporting router, and in_if is the SNMP ifIndex of the input interface. out_if is 0 because these packets were addressed to the router itself.
Alloy: flow file to Loki
This goes in the same Alloy config that already receives syslog. It tails the file, lifts the exporter address into a label and reuses the existing loki.write:
local.file_match "flows" {
  path_targets = [{"__path__" = "/flows/flows.log", job = "netflow"}]
}

loki.source.file "flows" {
  targets    = local.file_match.flows.targets
  forward_to = [loki.process.flows.receiver]
}

loki.process "flows" {
  stage.json {
    expressions = { exporter = "sampler_address" }
  }
  stage.labels {
    values = { exporter = "" }
  }
  forward_to = [loki.write.local.receiver]
}
Keep labels low-cardinality. The exporter address is fine: you'll have tens or hundreds. Source and destination IPs are not. Leave them in the log line and extract them at query time with | json. Promote them to labels and Loki ends up with a stream per conversation, which is exactly what it's bad at.
LogQL for flows
Every panel starts from the same selector and parser:
{job="netflow", exporter="10.66.20.11"} | json | __error__=""The __error__="" filter drops any line that fails to parse, so one bad line can't break a sum. From there, unwrap turns a JSON field into a number you can aggregate:
# Bytes per conversation, one point per minute
sum by (src_addr, dst_addr) (
  sum_over_time({job="netflow", exporter="10.66.20.11"} | json | __error__="" | unwrap bytes [1m])
)

# Bytes by protocol
sum by (proto) (
  sum_over_time({job="netflow", exporter="10.66.20.11"} | json | __error__="" | unwrap bytes [1m])
)

# Total over the dashboard range (instant query)
sum(sum_over_time({job="netflow", exporter="10.66.20.11"} | json | __error__="" | unwrap bytes [$__range]))
For the top talker bar gauge and the two donuts I run the 1-minute query with the query step set to 1m and let the panel reduce with Total. With a step equal to the window, each flow record is counted once. If the step is smaller than the window, windows overlap and the totals come out too high.
The flow list at the bottom right is a logs panel with a line_format so each record reads like a sentence:
{job="netflow", exporter="10.66.20.11"} | json | __error__=""
  | line_format "{{.src_addr}}:{{.src_port}} → {{.dst_addr}}:{{.dst_port}}  {{.proto}}  {{.packets}} pkts  {{.bytes}} bytes  in_if={{.in_if}}"
The dashboard
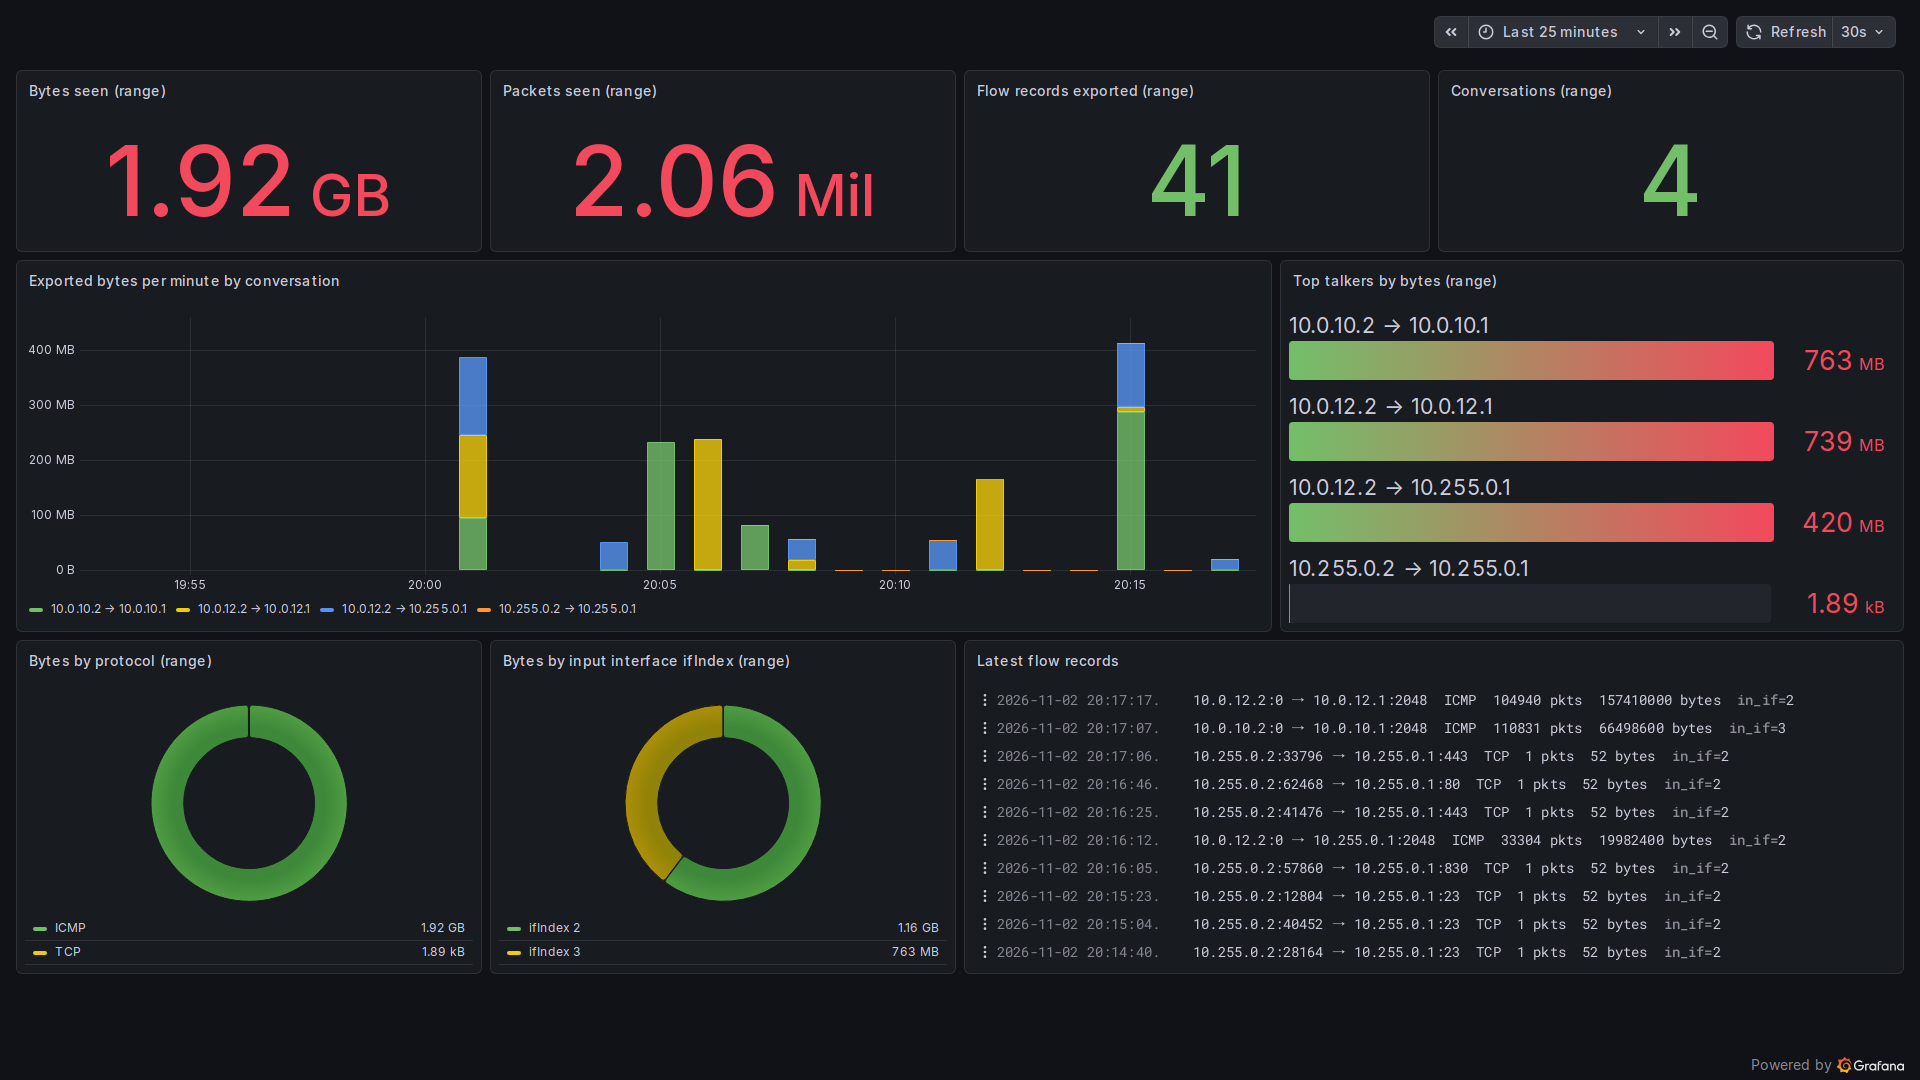
Over 25 minutes the router exported 41 flow records covering 1.92 GB and 2.06 million packets across four conversations. Top talkers shows the access switch (10.0.10.2) and wan-rtr2 (10.0.12.2) as the heavy senders. The protocol donut says nearly all of it is ICMP, with 1.89 kB of TCP. That TCP is me opening short connections from wan-rtr2's loopback to ports 22, 23, 80, 443 and 830 on wan-rtr1, and you can see each one in the flow list: one packet, 52 bytes. That's a SYN to a closed port, which is what a port scan looks like in flow data.
The interface donut splits by ifIndex. Index 2 is Ethernet0/1 and index 3 is Ethernet0/2. You can map those to names with a value mapping, or by joining against ifName from the SNMP exporter in a Prometheus panel.
Reading flow graphs correctly
Look at the bar chart in the middle. It's spiky, with tall bars a few minutes apart and gaps between them. The traffic was steady pings running for one to four minutes at a time. The bars are tall because a whole flow lands in Loki at the moment it is exported, stamped with the export time, carrying all its bytes at once.
That's true of any flow-based tool, and it's worse here because the active timeout is stuck at 30 minutes. Two things follow:
- Don't read the flow chart as an interface rate. Use SNMP or streaming telemetry for "how busy is the link right now", and flows for "who used it".
- Totals over a window are reliable. Per-minute shape isn't, unless the active timeout is short. With a 60-second active timeout the bars smooth out to within a minute of reality.
If you want the bytes placed at the time they flowed, GoFlow2 includes time_flow_start_ns and time_flow_end_ns. You can have Alloy use one of them as the log timestamp with a stage.timestamp block. I left it on export time because Loki rejects lines that are too far out of order, and a 30-minute flow would trip that.
Troubleshooting
- The cache has entries but the exporter has sent nothing. Check
show flow monitor PL-MON statistics. If "Flows aged" is 0, nothing has timed out yet. Wait 15 seconds after the traffic stops, or for the active timeout. - Sent counts go up but the collector gets nothing. Check the exporter's VRF and source interface with
show flow exporter, and check any ACL or firewall on UDP 2055 between them. - The collector logs template errors. It started after the router sent the template. Wait for the template timeout to pass, or lower it.
- A LogQL sum returns nothing. Run the selector with just
| jsonin Explore and look for an__error__label. A field name typo inunwrapalso returns an empty result, not an error. - Totals look too high. The query step is smaller than the
[1m]window. Set the step to match, or use an instant query over$__range.
When to use something else
This approach works well for a handful of branch and WAN routers. It doesn't scale to a core that exports thousands of flows a second, because every query parses JSON across every line in the range. For that, send GoFlow2's output to Kafka and ClickHouse, or use a dedicated flow analyser. Sampling also changes the maths: with sampler configured on the router, multiply bytes by sampling_rate in your queries. I didn't use sampling here.
Next in this series: Linux hosts with node_exporter, so the servers behind these routers get the same treatment.
Now live: Linux hosts in Grafana with node_exporter, next to the routers on the same Prometheus.