
The first five posts in this series were about routers and switches. But the network doesn't stop at the switch port. The syslog collector, the TACACS box, the jump host, the little web server that answers the health check: they're all Linux, and when one of them runs out of disk the outage looks like a network problem for the first twenty minutes.
So this post puts a Linux host on the same Grafana as the routers, using Prometheus node_exporter. It was built in my home lab on an Ubuntu 24.04 server called web01 (10.66.20.31), scraped by the same Prometheus that polls the Cisco IOS XE routers over SNMP in part 1.
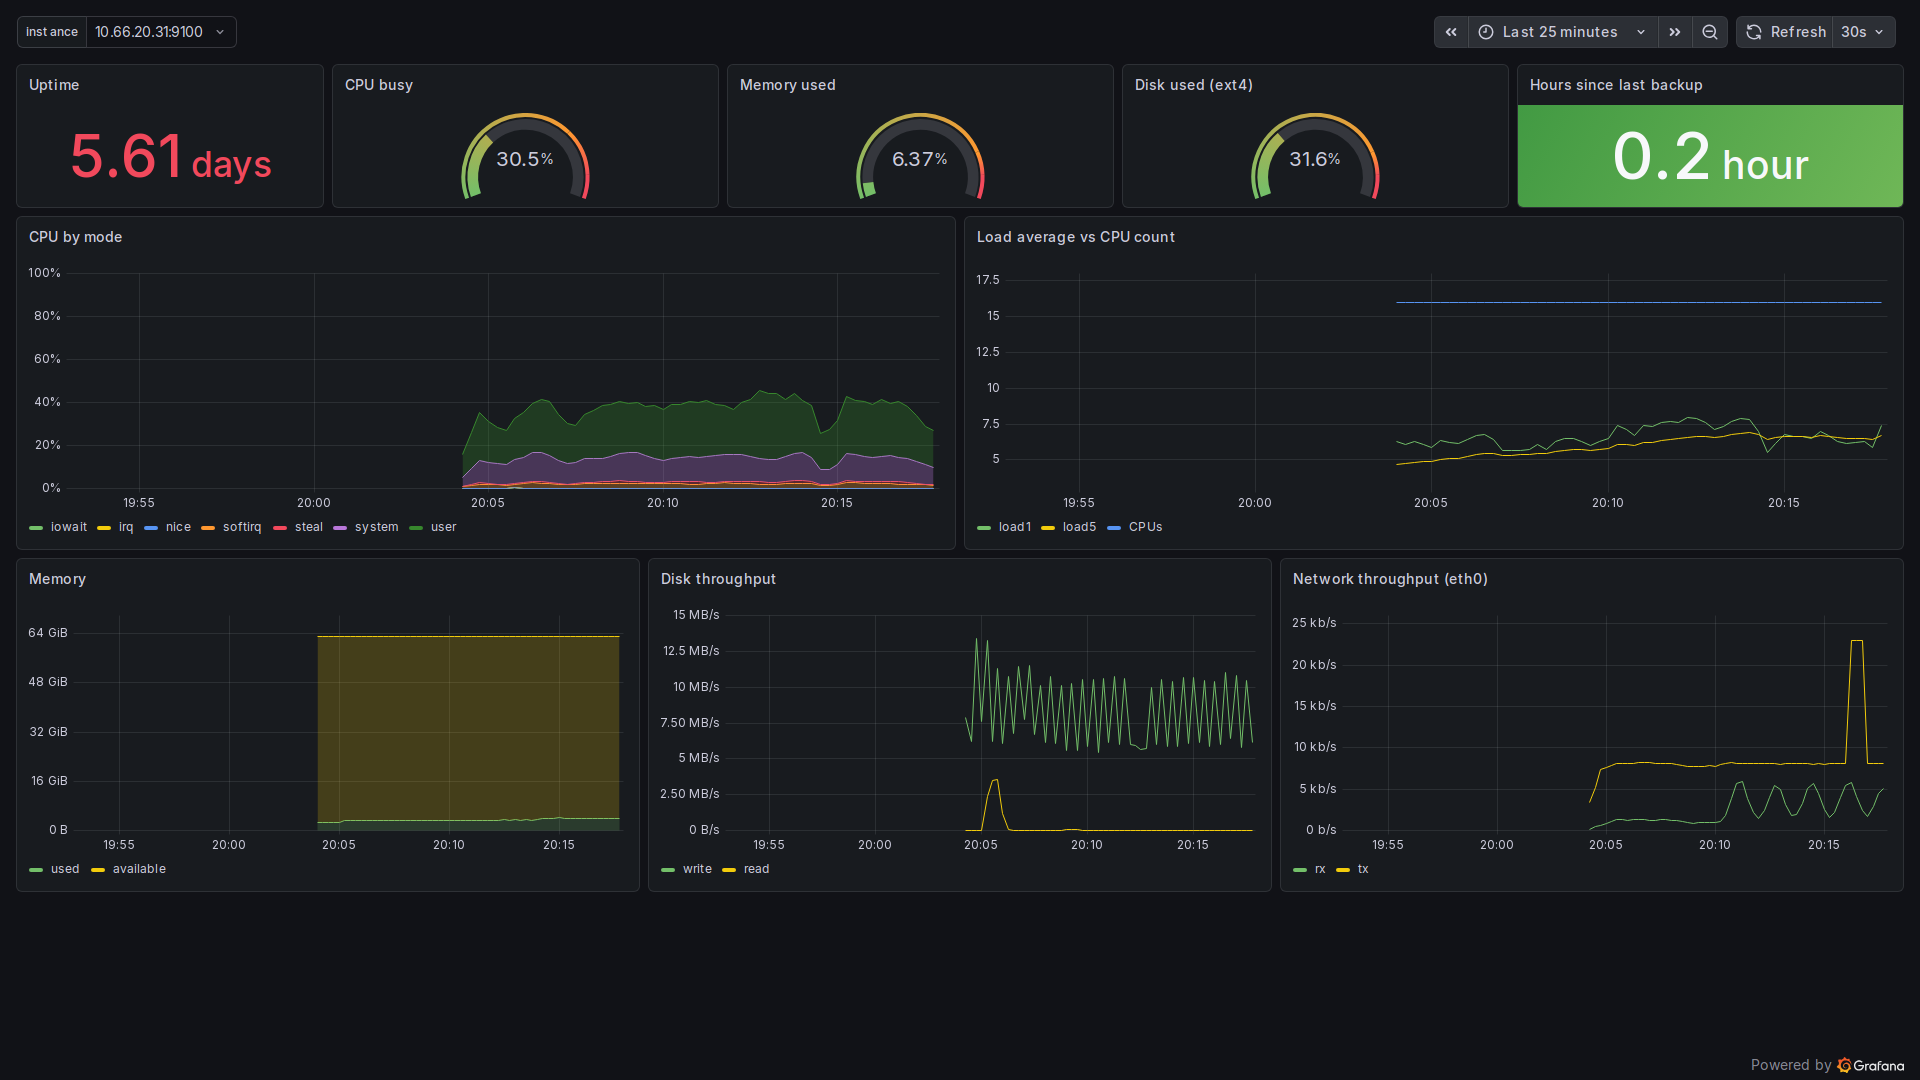

What node_exporter is, in one paragraph
node_exporter is a single Go binary that reads /proc and /sys and exposes what it finds as Prometheus metrics on TCP 9100. No agent config, no database, no push. Prometheus scrapes http://host:9100/metrics on a timer, exactly like it scrapes the SNMP exporter for the routers. If you've already got Prometheus for the network, adding Linux hosts costs one binary per host and four lines of scrape config.
Installing it
I used the release tarball rather than the distro package, because Ubuntu's package tends to lag a few versions behind. Version 1.12.1:
cd /tmp
curl -LO https://github.com/prometheus/node_exporter/releases/download/v1.12.1/node_exporter-1.12.1.linux-amd64.tar.gz
tar xzf node_exporter-1.12.1.linux-amd64.tar.gz
sudo install -m 0755 node_exporter-1.12.1.linux-amd64/node_exporter /usr/local/bin/
sudo useradd --system --no-create-home --shell /usr/sbin/nologin node_exporter
sudo mkdir -p /var/lib/node_exporter/textfile
On web01 I started the binary by hand with the two flags below while building the dashboard. For a server you keep, run it from systemd so it survives a reboot. This is the unit I'd use; it's the standard shape, but I didn't reboot web01 to prove it:
# /etc/systemd/system/node_exporter.service
[Unit]
Description=Prometheus node_exporter
After=network-online.target

[Service]
User=node_exporter
ExecStart=/usr/local/bin/node_exporter \
  --web.listen-address=:9100 \
  --collector.textfile.directory=/var/lib/node_exporter/textfile
Restart=on-failure

[Install]
WantedBy=multi-user.target
sudo systemctl daemon-reload
sudo systemctl enable --now node_exporter
/usr/local/bin/node_exporter --version | head -1node_exporter, version 1.12.1 (branch: HEAD, revision: 6044da783597cc3b57aef7580ddcdcff58a4ee99)One thing that bit me: I first tried to add --collector.systemd=false to keep the output smaller. node_exporter refused to start. Boolean collector flags take the --collector.X / --no-collector.X form, not =false, and the systemd collector is off by default anyway. If you want to switch a default collector off, it's --no-collector.<name>. Read the error, it tells you.
A quick check from the Prometheus server shows it's answering:
curl -s 10.66.20.31:9100/metrics | grep -E '^node_(load1 |memory_MemAvailable_bytes|textfile_scrape_error)'node_load1 5.71
node_memory_MemAvailable_bytes 6.3849664512e+10
node_textfile_scrape_error 0Port 9100 has no authentication by default. On anything that isn't a closed management network, firewall it to the Prometheus server only, or use the --web.config.file option for TLS and basic auth.
The Prometheus scrape job
This sits in the same prometheus.yml as the SNMP jobs. The extra labels are what make the dashboard readable later:
- job_name: node
  scrape_interval: 15s
  static_configs:
  - targets: ["10.66.20.31:9100"]
    labels:
      instance_name: web01
      role: linux
15 seconds is fine for Linux. node_exporter is cheap to scrape, unlike a router's SNMP agent, where I kept the interval at 60 seconds in part 1. For a few dozen hosts you could add file-based service discovery later. For one host, a static target is honest and simple.
The panels, and the PromQL behind them
The dashboard has an instance variable (label_values(node_uname_info, instance)), so the same dashboard works for every host you add. The queries below use $instance.
CPU busy
100 * (1 - avg(rate(node_cpu_seconds_total{mode="idle", instance="$instance"}[1m])))node_exporter gives you seconds spent in each mode per CPU. Idle rate averaged across all CPUs, subtracted from one, is "how busy is the box". The CPU by mode panel splits the busy part by mode (user, system, iowait, softirq and so on), divided by CPU count so the stack tops out at 100%. In the screenshot it's mostly user with a slice of system, which is what a compression loop looks like.
Load average, with the CPU count drawn on
Load on its own is meaningless without the core count. A load of 6 is a crisis on a 2-core VM and nothing on 16 cores. So the panel draws node_load1, node_load5 and count(node_cpu_seconds_total{mode="idle"}) as a flat line. Load sitting well under the CPU line is fine. This host has 16 CPUs and load around 6, which matches the 30% CPU gauge.
Memory used
100 * (1 - node_memory_MemAvailable_bytes / node_memory_MemTotal_bytes)Use MemAvailable, not MemFree. Linux uses spare RAM for page cache, so MemFree on a healthy server is always small and you'll get paged for nothing. MemAvailable is the kernel's own estimate of what it could hand out without swapping.
Disk used
max(100 * (1 - node_filesystem_avail_bytes{instance="$instance", fstype="ext4"}
            / node_filesystem_size_bytes{instance="$instance", fstype="ext4"}))
Honest note: my first version filtered on mountpoint="/" and showed "No data". On this host node_exporter doesn't report a series for /, so I filter on fstype="ext4" and take the fullest one. On a normal server you'd want one row per mountpoint instead, so /var/log filling up doesn't hide behind a half-empty root. Use avail, not free: free includes the blocks reserved for root, which a normal process can't use.
Disk and network throughput
Plain rate() over the byte counters: node_disk_written_bytes_total, node_disk_read_bytes_total, and node_network_receive_bytes_total / transmit times 8 for bits per second, so the units match the router interface graphs.
The useful trick: the textfile collector
The panel I'd keep if I could keep only one is Hours since last backup. node_exporter can't know whether your backup ran. But it will publish any metric you write into a .prom file in the textfile directory. So the backup script writes one line when it finishes:
# last line of the backup job, only reached on success
echo "pl_backup_last_success_timestamp_seconds $(date +%s)" \
  > /var/lib/node_exporter/textfile/backup.prom.$$ \
  && mv /var/lib/node_exporter/textfile/backup.prom.$$ /var/lib/node_exporter/textfile/backup.prom
Write to a temp file and mv it into place. A rename is atomic, so node_exporter never reads half a file. Then the panel is:
(time() - pl_backup_last_success_timestamp_seconds{instance="$instance"}) / 3600with thresholds at 24 and 48 hours. Green means the backup ran recently; red means it hasn't run in two days, which is a much better question than "did the cron job exit 0". The same pattern works for config backups of the routers, certificate expiry dates, or a nightly show running-config diff job. Keep an eye on node_textfile_scrape_error: it goes to 1 if a file has bad syntax.
What I'd fix before calling it done
- The red uptime. 5.61 days shows red because the stat panel inherited Grafana's default threshold (red above 80). Uptime isn't good or bad on its own. Set the panel to a single neutral colour, or flip it so low uptime is the warning, which catches unexpected reboots.
- The graphs start at 20:04. That's when I started scraping. There's no history before that, and nothing in the screenshot is backfilled.
- The load is synthetic. web01 was idle, so I ran a CPU and disk loop to make the panels move. The shapes are real measurements, but don't read anything into the actual numbers.
Why it belongs next to the routers
The point isn't another Linux dashboard. There are hundreds of those on grafana.com. The point is the same Prometheus, the same Grafana and the same alert rules from part 4 covering both. When the syslog server's disk fills, the alert lands in the same inbox as "interface down", and the person on call doesn't have to know which team's tool to open. In the next post I'll stop clicking dashboards together in the UI and build them from files in Git, with Ansible generating one per device.
Next in this series: Grafana dashboards as code, with provisioning, Git and Ansible.
Now live: Grafana dashboards as code, provisioning, Git and Ansible.