
Every dashboard in this series so far was made by clicking. That works for one router. It stops working when you have forty, when someone "tidies up" a panel at 2am, or when you rebuild the Grafana server and realise the dashboards only ever lived in its database.
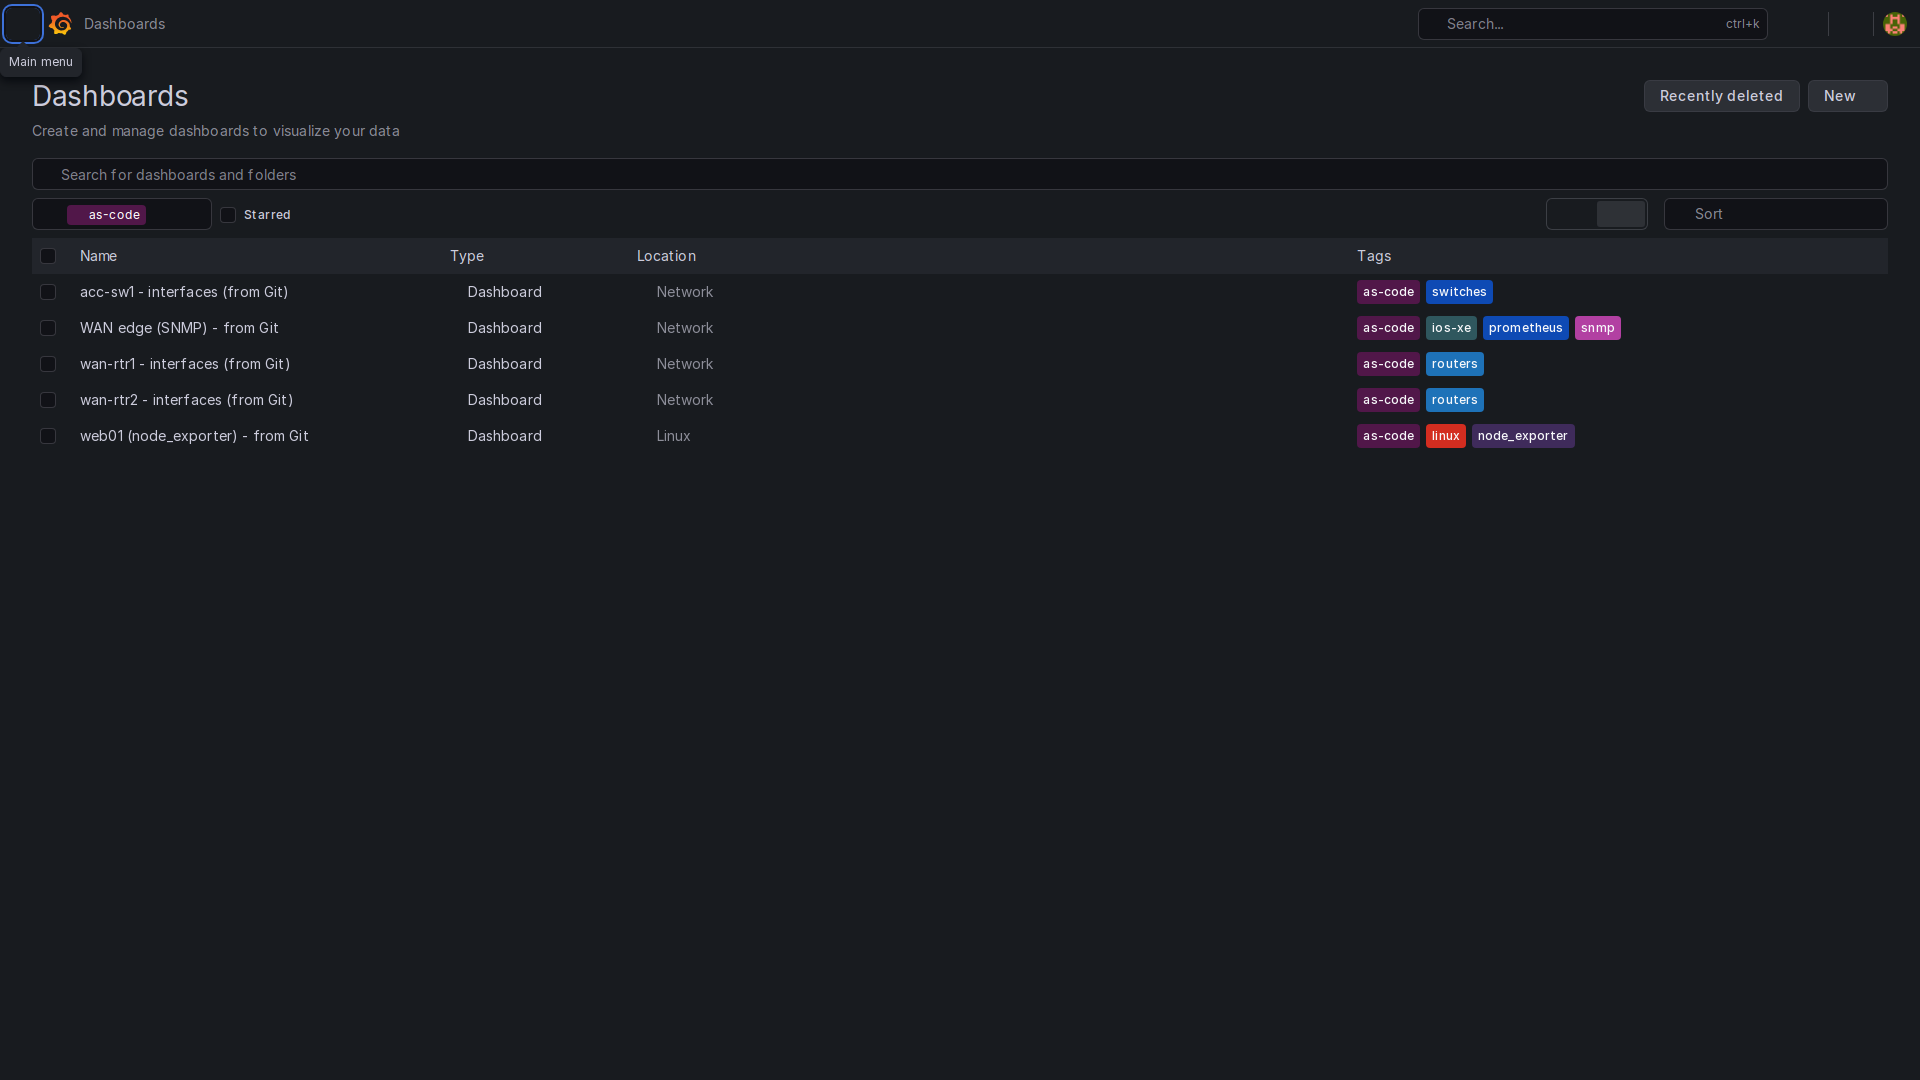
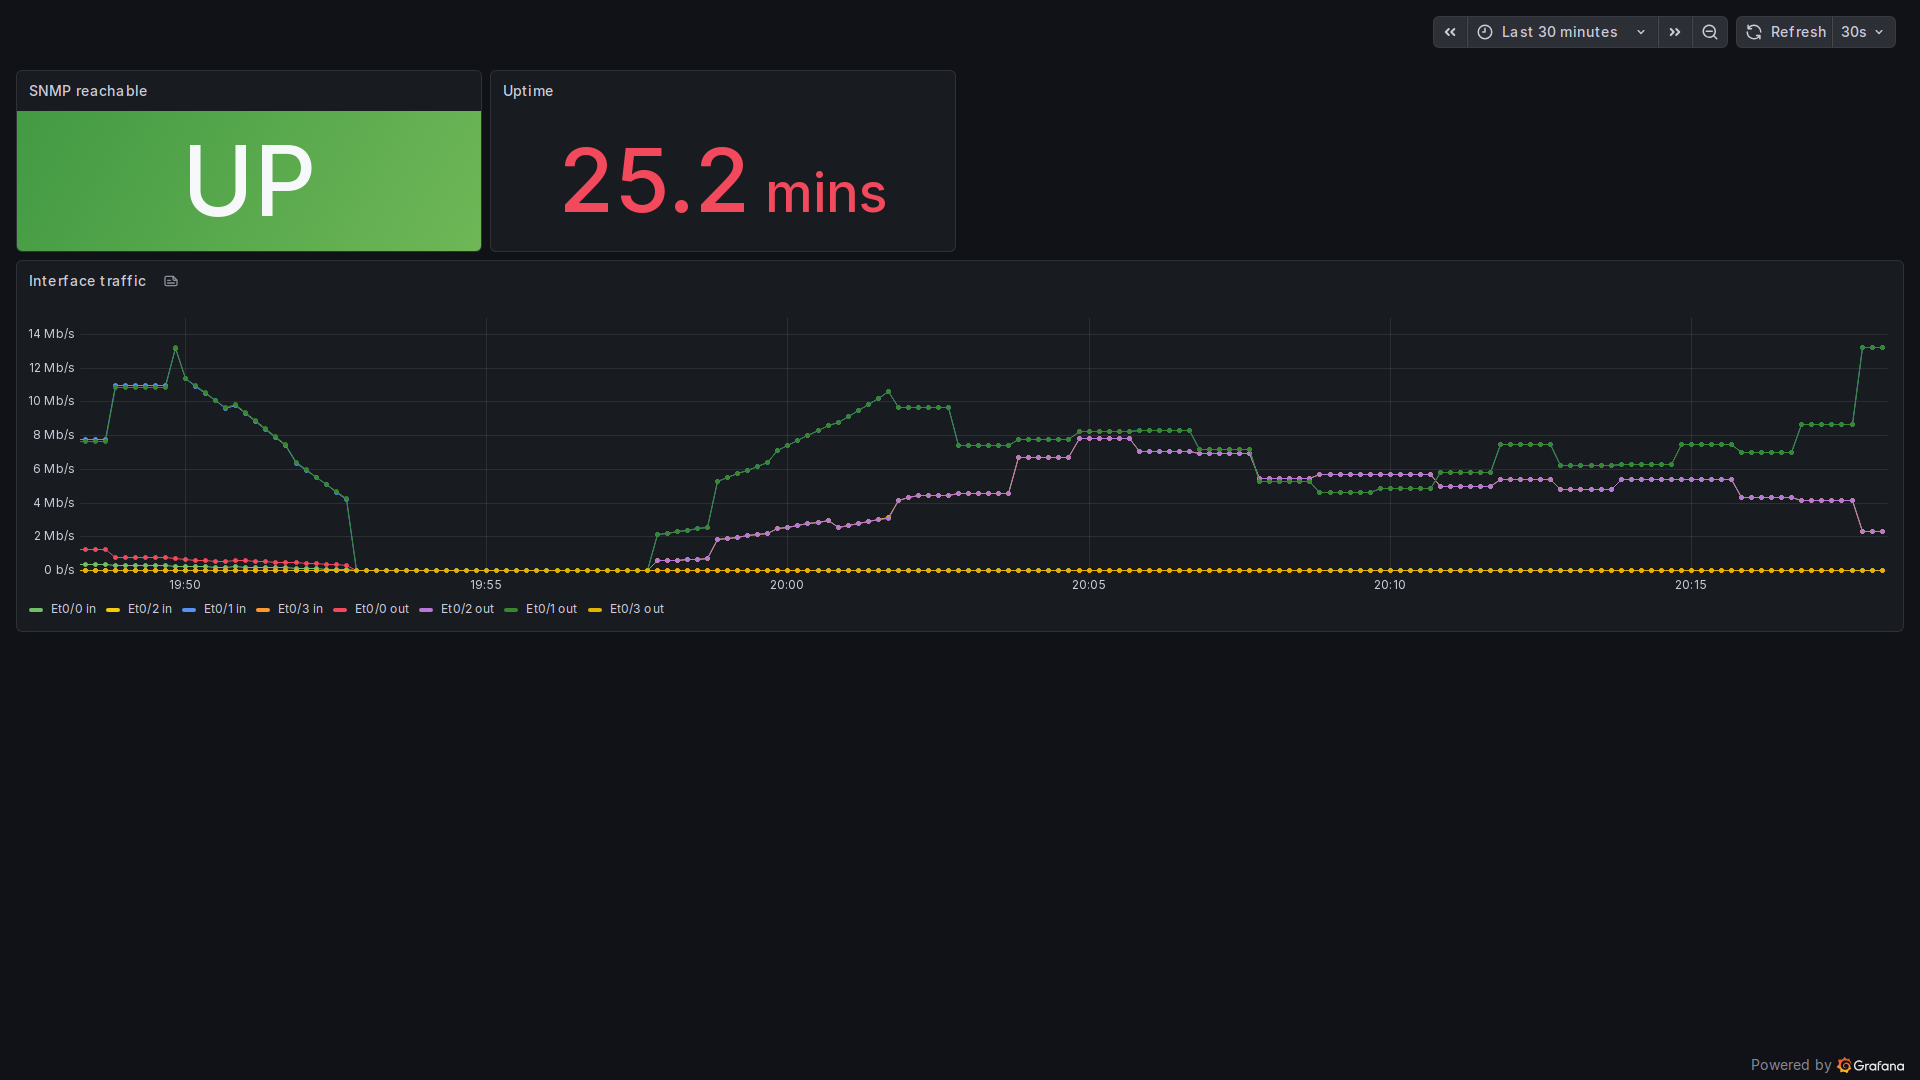
This post moves the dashboards into Git. Grafana loads them from files using file provisioning, and Ansible generates one dashboard per router and switch from the inventory. It was built in my home lab with Grafana 13.0.2, ansible-core 2.21.5, two Cisco IOS XE routers (wan-rtr1, wan-rtr2), a switch (acc-sw1) and a Linux host (web01). The metrics come from the SNMP setup in part 1 and the node_exporter host in part 6.

Three ways to get dashboards into Grafana
- The UI. Fast, and fine for exploring. No history, no review, and it lives only in Grafana's database.
- The HTTP API.
POST /api/dashboards/dbwith JSON. Scriptable, but the dashboard is still editable in the UI, so the copy in Git and the copy in Grafana drift apart. - File provisioning. Grafana reads JSON files from a folder on disk and keeps them in sync. With
allowUiUpdates: falsethe UI can't save over them. Git is the only way in.
I went with provisioning. The API is still useful once, to export the dashboards I'd already built.
The repo layout
grafana-as-code/
├── provisioning/
│   └── dashboards/noc.yaml        # tells Grafana where to look
├── dashboards/
│   ├── network/                    # -> "Network" folder in Grafana
│   │   ├── code-wan-edge.json      # exported from the UI once
│   │   ├── code-wan-rtr1.json      # generated by Ansible
│   │   ├── code-wan-rtr2.json
│   │   └── code-acc-sw1.json
│   └── linux/                      # -> "Linux" folder
│       └── code-web01.json
└── ansible/
    ├── inventory.yml
    ├── deploy-dashboards.yml
    └── templates/device.json.j2
On the Grafana server, provisioning/dashboards is what Grafana sees as /etc/grafana/provisioning/dashboards, and the dashboards folder is what it sees as /var/lib/grafana-dashboards. In production that second folder is a checkout your CI updates; here it's the repo itself.
The provisioning file
apiVersion: 1
providers:
  - name: noc-network
    orgId: 1
    folder: Network
    type: file
    disableDeletion: true
    allowUiUpdates: false
    updateIntervalSeconds: 30
    options:
      path: /var/lib/grafana-dashboards/network
  - name: noc-linux
    orgId: 1
    folder: Linux
    type: file
    disableDeletion: true
    allowUiUpdates: false
    updateIntervalSeconds: 30
    options:
      path: /var/lib/grafana-dashboards/linux
One provider per folder is the simplest way to land files in named Grafana folders. Grafana also has foldersFromFilesStructure, which maps subfolders automatically, but two explicit providers are easier to read. updateIntervalSeconds: 30 means Grafana re-reads the folder every 30 seconds, so a git pull shows up without a restart. disableDeletion: true stops anyone deleting a provisioned dashboard from the UI.
Getting the existing dashboards out
I already had a WAN edge dashboard and the web01 one from the previous post. A short Python script pulled them out over the API (GET /api/dashboards/uid/<uid>) and wrote them into the repo. Three edits matter:
- Drop
idandversion. They belong to one Grafana database, and leaving them in causes conflicts on another server. - Give each one a new, stable
uid(code-wan-edge,code-web01). The uid is the dashboard's identity and its URL, so pick it on purpose. - Add an
as-codetag, so anyone looking at a dashboard can tell where it came from.
Datasource references use fixed uids (prom, loki), which I set when I created the datasources. If your datasources have random uids, fix that first, or every exported dashboard will break on the next server. Datasources can be provisioned from YAML the same way.
One template, one dashboard per device
The inventory is what an Ansible user would already have for the network:
all:
  vars:
    grafana_url: http://127.0.0.1:3000
  children:
    routers:
      hosts:
        wan-rtr1: {mgmt_ip: 10.66.20.11}
        wan-rtr2: {mgmt_ip: 10.66.20.12}
    switches:
      hosts:
        acc-sw1: {mgmt_ip: 10.66.20.21}
The Jinja2 template is a normal dashboard JSON with the device filled in. Here's the important part:
{
  "uid": "code-{{ item }}",
  "title": "{{ item }} - interfaces (from Git)",
  "tags": ["as-code", "{{ hostvars[item].group_names[0] }}"],
  ...
  "targets": [{"refId": "A",
    "expr": "up{job=~\"snmp-cisco-.*\",instance=\"{{ hostvars[item].mgmt_ip }}\"}"}]
  ...
  {"refId": "A",
   "expr": "rate(ifHCInOctets{instance=\"{{ hostvars[item].mgmt_ip }}\",ifName=~\"Et.*\"}[5m]) * 8",
   "legendFormat": "{{ '{{ifName}}' }} in"}
The classic trap: Grafana's own legend syntax is {{ifName}}, which Jinja2 will try to evaluate. Escape it as {{ '{{ifName}}' }} so the literal braces survive.
The playbook
- name: Build and load Grafana dashboards from Git
  hosts: localhost
  gather_facts: false
  vars:
    repo: "{{ playbook_dir | dirname }}"
    grafana_user: admin
    grafana_password: "{{ lookup('env', 'GRAFANA_PASSWORD') }}"
  tasks:
    - name: Render one dashboard per router and switch
      ansible.builtin.template:
        src: device.json.j2
        dest: "{{ repo }}/dashboards/network/code-{{ item }}.json"
      loop: "{{ groups['routers'] + groups['switches'] }}"

    - name: Find every dashboard file in the repo
      ansible.builtin.find:
        paths: "{{ repo }}/dashboards"
        patterns: "*.json"
        recurse: true
      register: dash_files

    - name: Check every dashboard file is valid JSON with a uid
      ansible.builtin.assert:
        that: (lookup('file', item.path) | from_json).uid is defined
        quiet: true
      loop: "{{ dash_files.files }}"
      loop_control:
        label: "{{ item.path | basename }}"

    - name: Ask Grafana to reload file-provisioned dashboards
      ansible.builtin.uri:
        url: "{{ grafana_url }}/api/admin/provisioning/dashboards/reload"
        method: POST
        user: "{{ grafana_user }}"
        password: "{{ grafana_password }}"
        force_basic_auth: true
        status_code: 200

    - name: List the dashboards Grafana now has from Git
      ansible.builtin.uri:
        url: "{{ grafana_url }}/api/search?tag=as-code"
        user: "{{ grafana_user }}"
        password: "{{ grafana_password }}"
        force_basic_auth: true
      register: found

    - name: Show them
      ansible.builtin.debug:
        msg: "{{ found.json | map(attribute='title') | list }}"
The password comes from an environment variable, never from the repo. In a real pipeline use a Grafana service account token with the narrowest role that can reload provisioning, and keep it in your CI secret store or Ansible Vault.
The JSON check is there because of how provisioning fails. A broken file doesn't produce an error you'll see. Grafana logs it and quietly keeps the old version or skips the dashboard. Failing the playbook before the reload is much better than finding out from an empty screen. My first version used with_fileglob for this and found nothing, because fileglob looks relative to the playbook's files/ directory. find with an explicit path is more predictable.
export GRAFANA_PASSWORD='<GRAFANA_PASSWORD>'
ansible-playbook -i ansible/inventory.yml ansible/deploy-dashboards.yml
TASK [Check every dashboard file is valid JSON with a uid] *********************
ok: [localhost] => (item=code-web01.json)
ok: [localhost] => (item=code-acc-sw1.json)
ok: [localhost] => (item=code-wan-rtr1.json)
ok: [localhost] => (item=code-wan-rtr2.json)
ok: [localhost] => (item=code-wan-edge.json)
TASK [Ask Grafana to reload file-provisioned dashboards] ***********************
ok: [localhost]
TASK [Show them] ***************************************************************
ok: [localhost] => {
"msg": [
"acc-sw1 - interfaces (from Git)",
"WAN edge (SNMP) - from Git",
"wan-rtr1 - interfaces (from Git)",
"wan-rtr2 - interfaces (from Git)",
"web01 (node_exporter) - from Git"
]
}
PLAY RECAP *********************************************************************
localhost : ok=6 changed=1 unreachable=0 failed=0 skipped=0That's the second run, so only one task reports changed. Add a router to the inventory and the next run creates its dashboard. Nobody opens Grafana.
What Git gives you
c063119 Match SNMP job and use 5m rate window
e851970 Validate dashboard JSON before reload
7ce01f7 Grafana dashboards and provisioning as code
That top commit is a good example of why this is worth doing. The first generated dashboards had two problems. The SNMP reachable panel showed two series, because up{instance="10.66.20.11"} matched both the SNMP job and a probe job that scrape the same address. And the traffic panel was empty, because a [1m] rate over a 60-second SNMP scrape often has only one sample in the window. The fix was job=~"snmp-cisco-.*" and [5m], made once in the template, and every device dashboard got it on the next run. In the UI that would have been the same edit on every dashboard, by hand.
Things to know before you commit to this
- The UI becomes read-only for these dashboards. People can still edit and "Save as" a copy, or export JSON and open a pull request. That's the workflow you want, but tell the team first.
- Exported JSON is noisy. Grafana rewrites a lot of fields on save. Sort keys (I used
sort_keys=True) so diffs show real changes. - Big fleets need more than one template. One per role (core, access, WAN, Linux) with Jinja2 conditionals for optional panels works better than one giant template.
- Grafana has newer options. Grafana 12 and 13 add Git Sync and a dashboard schema v2. I stayed with classic file provisioning because it's stable, works on any recent version and needs nothing outside Grafana. Look at the newer features if you're starting fresh.
Next in this series: probing the WAN from the outside with the Prometheus blackbox exporter.
Now live: Probing the WAN with the blackbox exporter, ICMP, SSH and HTTP probes in Grafana.