
SNMP tells you what a router thinks of itself. Interface up, CPU fine, no errors. It can't tell you whether a user can actually reach anything through it. A router with a perfect SNMP dashboard can still be dropping traffic because of an ACL, a routing change or a broken upstream.
The Prometheus blackbox exporter answers the other question: can I reach it, and how long does it take? It sends real ICMP, TCP and HTTP probes and reports success and timings as metrics. This post adds it to the stack from earlier in the series, built in my home lab with blackbox_exporter 0.29.1, Prometheus and Grafana 13.0.2, probing two Cisco IOS XE routers (wan-rtr1 10.66.20.11, wan-rtr2 10.66.20.12), a switch (acc-sw1 10.66.20.21) and the Linux web server from part 6 (web01 10.66.20.31).

How blackbox exporter works
It's different from the other exporters in this series. node_exporter and the SNMP exporter describe one thing. The blackbox exporter is a prober you point at targets. Prometheus calls /probe?module=icmp&target=10.66.20.11, the exporter sends the ping right then, and returns metrics such as probe_success and probe_duration_seconds. One exporter can probe hundreds of targets. The probe runs from where the exporter sits, so put it where your users are, or run one per site.
The modules
# blackbox.yml
modules:
  icmp:
    prober: icmp
    timeout: 3s
    icmp:
      preferred_ip_protocol: ip4
  tcp_ssh:
    prober: tcp
    timeout: 3s
    tcp:
      query_response:
        - expect: "^SSH-2.0-"
  http_2xx:
    prober: http
    timeout: 5s
    http:
      valid_status_codes: [200]
      preferred_ip_protocol: ip4
A few choices worth explaining:
preferred_ip_protocol: ip4. The default prefers IPv6. On an IPv4-only management network that's a probe that fails or waits for nothing.expect: "^SSH-2.0-". A plain TCP connect only proves something answered on port 22. Checking the SSH banner proves it's the SSH server. The IOS XE routers sendSSH-2.0-Cisco-1.25, which matches.- Timeouts shorter than the scrape interval. Prometheus scrapes every 15 seconds; a probe that waits longer than that overlaps the next one.
ICMP needs raw sockets. Run the exporter as root, or give the binary cap_net_raw, or ICMP probes will fail with a permissions error while TCP and HTTP work fine. That's a confusing one the first time.
The Prometheus side: relabeling
This is the part everyone copies without reading. Here are the three jobs. The YAML anchor (&bbrelabel) means the relabel block is written once:
- job_name: blackbox-icmp
  scrape_interval: 15s
  metrics_path: /probe
  params: {module: [icmp]}
  static_configs:
  - targets: [10.66.20.11, 10.66.20.12, 10.66.20.21, 10.66.20.31]
  relabel_configs: &bbrelabel
  - source_labels: [__address__]
    target_label: __param_target
  - source_labels: [__param_target]
    target_label: instance
  - target_label: __address__
    replacement: 10.66.20.47:9115
- job_name: blackbox-ssh
  scrape_interval: 15s
  metrics_path: /probe
  params: {module: [tcp_ssh]}
  static_configs:
  - targets: ["10.66.20.11:22", "10.66.20.12:22", "10.66.20.21:22"]
  relabel_configs: *bbrelabel
- job_name: blackbox-http
  scrape_interval: 15s
  metrics_path: /probe
  params: {module: [http_2xx]}
  static_configs:
  - targets: ["http://10.66.20.31/"]
  relabel_configs: *bbrelabel
Read the relabel rules in order. The thing in targets is what you want probed, but Prometheus would normally scrape that address. So:
- Copy the target into the
targetURL parameter. - Copy it into the
instancelabel too, so graphs say "10.66.20.11" and not the exporter's address. - Replace the scrape address with the blackbox exporter itself (10.66.20.47:9115).
Get step 3 wrong and Prometheus tries to scrape port 9115 on your router. Get step 2 wrong and every series has the same instance label.
Check it straight away. You can call the exporter by hand with debug=true to see exactly what the probe did:
curl -s 'http://10.66.20.47:9115/probe?module=tcp_ssh&target=10.66.20.11:22&debug=true'That prints the metrics the probe would return, preceded by a probe log. On 0.29.1 at the default log level the log section came back empty for me, so try raising the exporter to --log.level=debug if you want to see each step. Even without the log, probe_failed_due_to_regex tells you whether the banner check is the thing failing. It's the fastest way to understand a failing probe.
The dashboard
Probe status
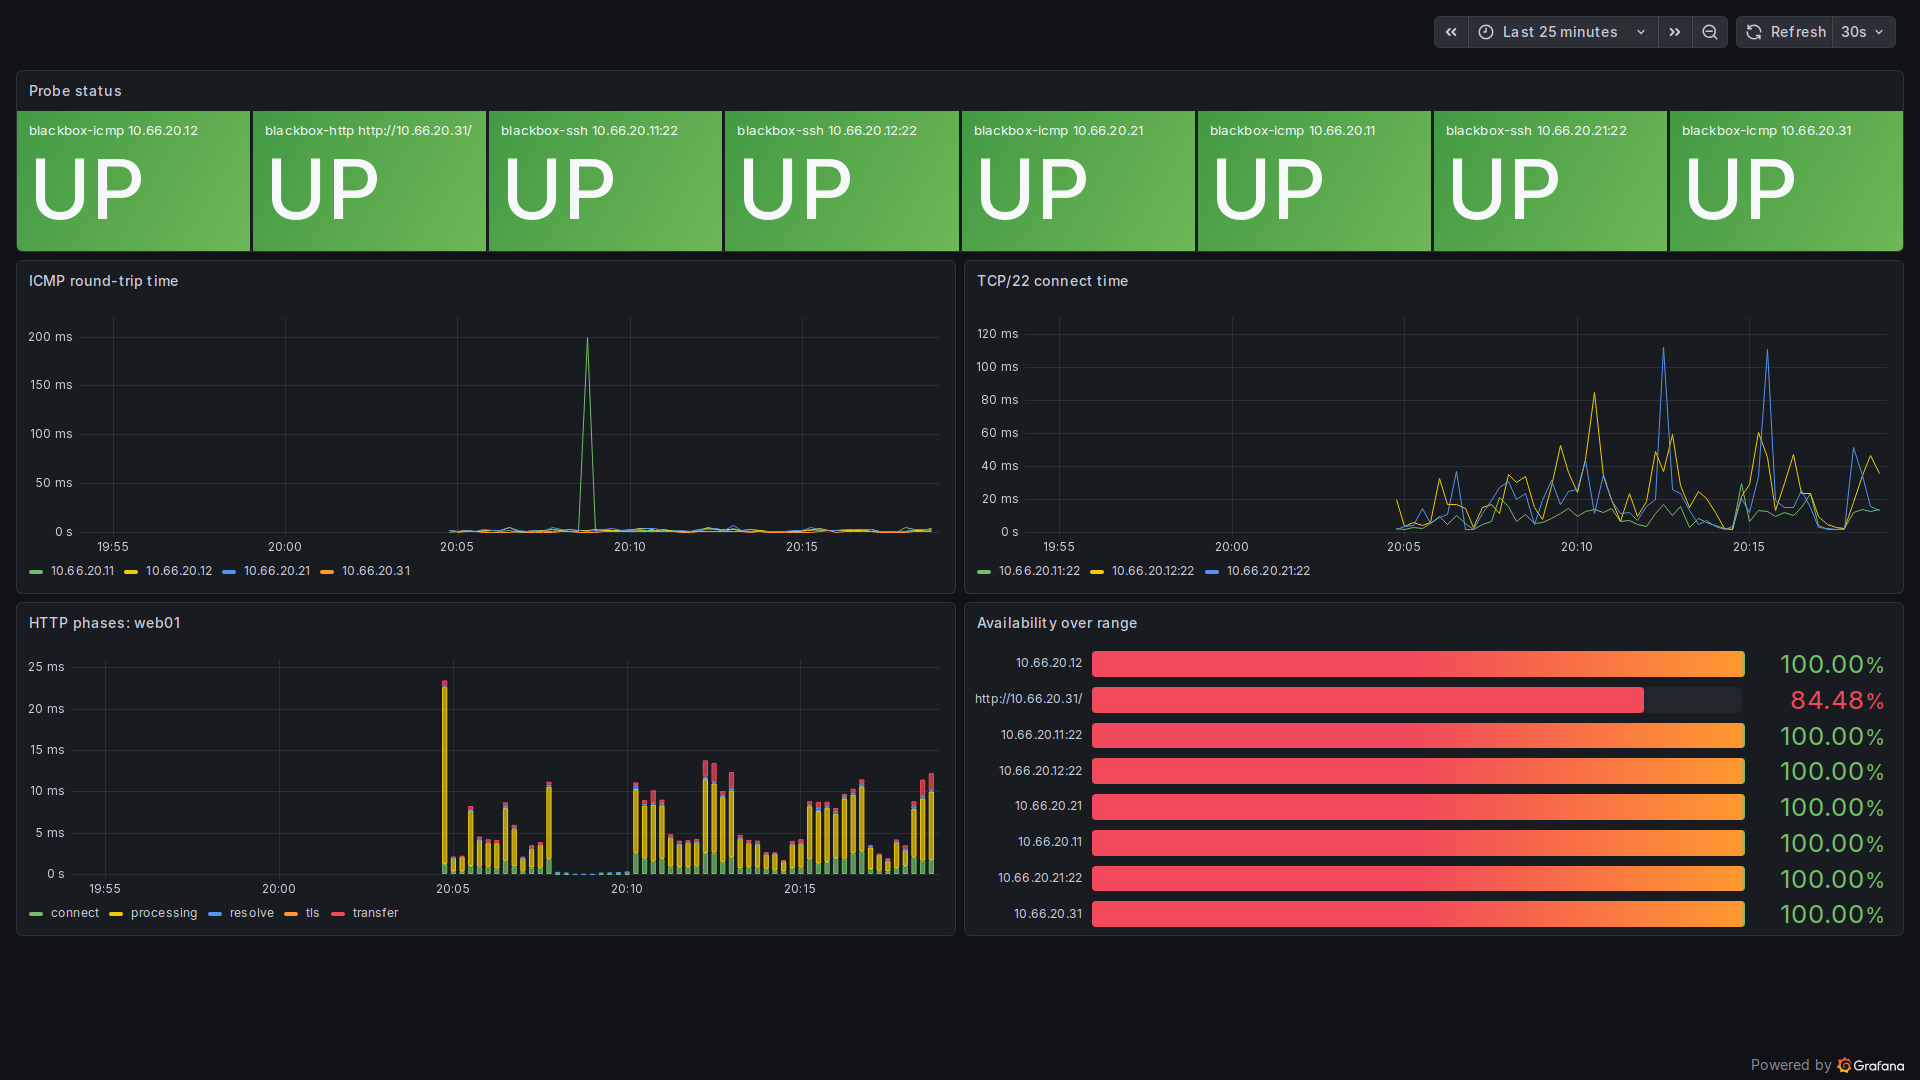
probe_success as a stat panel, one tile per job and target, with value mappings 1 = UP (green) and 0 = DOWN (red). This row is what you look at from across the room.
ICMP round-trip time
probe_icmp_duration_seconds{phase="rtt"}The ICMP prober splits the time into phases (resolve, setup, rtt). rtt is the ping time. Mostly flat under a few milliseconds here, with one 200 ms spike on 10.66.20.11 around 20:08. That was the router busy with something else; a router's control plane answers pings at low priority, so one spike from a router target means much less than the same spike from a host behind it.
TCP/22 connect time
probe_duration_seconds{job="blackbox-ssh"} is the whole probe: connect and read the banner. It's 10 to 110 ms and jumpy, which is normal for an IOS XE SSH process under the load I was generating. Watch the trend and the failures, not the individual spikes.
HTTP phases
probe_http_duration_seconds{job="blackbox-http"}Stacked bars by phase: resolve, connect, tls, processing, transfer. This is the most useful panel for "the app is slow": if connect grows, it's the network; if processing grows, it's the server. Here processing dominates, which is right for a small web server on a quiet LAN. TLS is zero because web01 serves plain HTTP. The gap just after 20:07 is the outage.
Availability over the range
avg_over_time(probe_success[$__range]) * 100Because probe_success is 1 or 0, its average is the fraction of probes that passed. $__range makes it follow the dashboard time picker. Thresholds: red below 99, orange to 99.9, green above.
The outage I caused
To prove the dashboard catches something, I stopped the web server on web01 for about two minutes and started it again. The HTTP tile went DOWN, the phase bars stopped, and availability over the 25-minute window dropped to 84.48%. The router and switch probes didn't move, which is exactly the point: SNMP and ICMP would have said the network was fine, and it was. The server wasn't.
What the screenshot doesn't show well
- The bars are all red-orange. I used the gradient display mode, which colours the bar along its length from the bottom threshold. The number on the right is coloured correctly, the bar isn't a useful signal. Basic mode with threshold colours is better. I'll come back to this in the screen design post.
- Everything is one hop away. The exporter and all targets share a management network, so these are LAN timings. Real value comes from probing across the WAN: put a blackbox exporter at a branch and probe the data centre, and the other way round.
- Availability over 25 minutes is noisy. One failure moves it a lot. For SLA reporting use a day or a month, and record the probe results with a recording rule.
Alerting on it
The alert rule from part 4 works with a different query: probe_success == 0 with a pending period of a minute or two, so one lost ping doesn't wake anyone. Add a latency rule on probe_icmp_duration_seconds{phase="rtt"} across the WAN, averaged over five minutes, and you'll catch a congested link before users complain.
Next in this series: putting it all together in one NOC dashboard, with Zabbix, Prometheus and Loki side by side.
Now live: Grafana NOC dashboard: Zabbix, Prometheus and Loki on one screen puts these probes next to Zabbix problems and syslog on one NOC view.