
Every earlier part of this series added one more data source. Zabbix polls the routers and the Linux servers. Prometheus scrapes the SNMP exporter, node_exporter and the blackbox probes. Loki stores syslog. Each has its own dashboard. Nobody on a NOC shift wants to click between five tabs to find out whether something is broken, though.
This post puts all three on one Grafana dashboard. I built it in my home lab with Grafana 13.0.2, Zabbix 7.0 and the Zabbix plugin from Alexander Zobnin, Prometheus and Loki. It covers two Cisco IOS XE WAN routers, an access switch and a Linux web server. While I was building it, a real fault appeared. It's a good test of whether the combined view is worth having.

Why mix three tools at all
Each tool is good at a different thing, and the series has used each one for what it does best:
- Zabbix already has trigger logic, severities, acknowledgements and host templates. Its problems are the closest thing in the lab to a ticket queue. That logic doesn't need rebuilding in Grafana; the Zabbix plugin can just show it.
- Prometheus holds the time series: SNMP interface counters from the SNMP exporter post, probe results from the blackbox exporter post and host metrics from node_exporter. PromQL makes it easy to turn those into a single number like "devices up".
- Loki holds the router syslog from the Loki post. When a number goes red, the log lines are usually the explanation.
Grafana is the one place they all meet. Since Grafana 10, any panel can use any datasource, so the dashboard doesn't care where each panel's data lives.
The layout
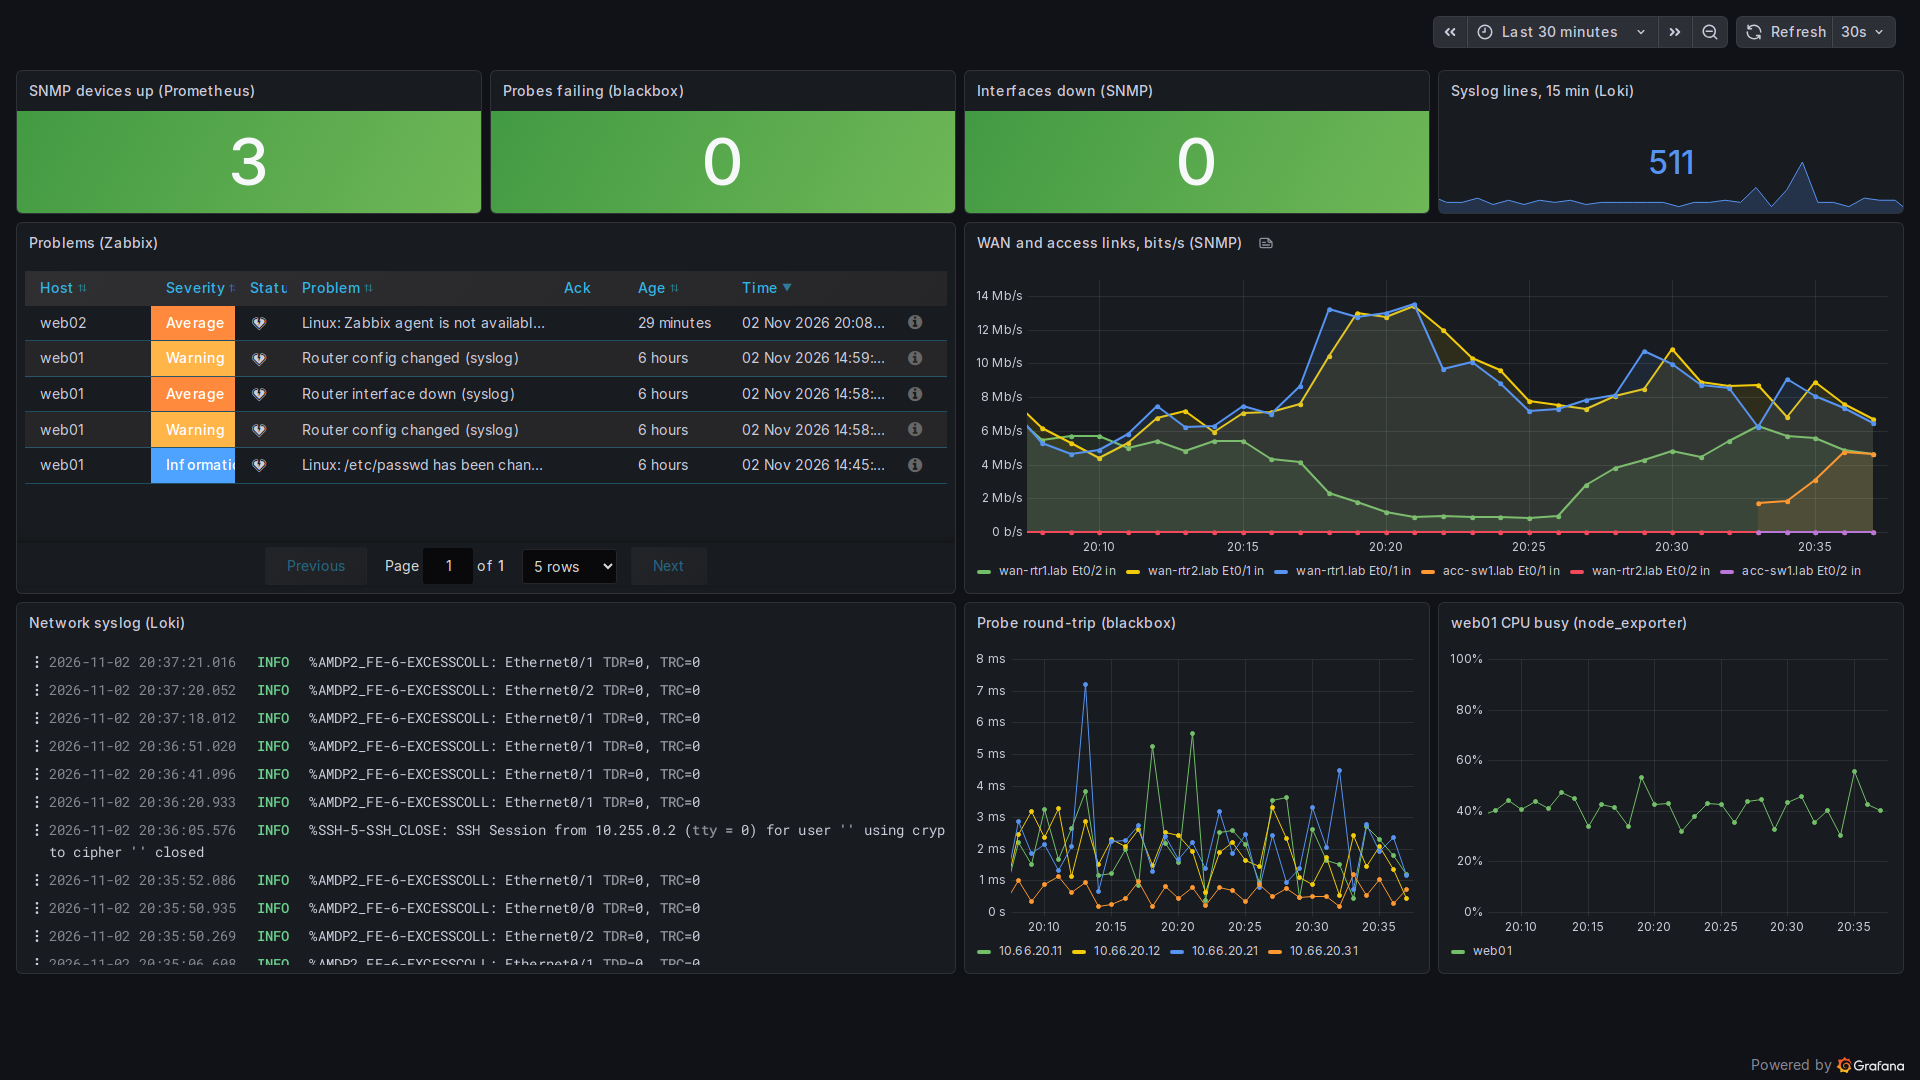
The dashboard has three rows, and the first one answers the most urgent question:
- Top row: is anything broken? Four stat tiles: SNMP devices up (Prometheus,
sum(up{job=~"snmp-cisco-.*"})), probes failing (blackbox,count(probe_success == 0) or vector(0)), interfaces down (SNMP, admin up but oper down) and syslog lines per minute with a 15-minute sparkline (Loki). - Middle row: what and where? The Zabbix problems table on the left. WAN and access link traffic from SNMP on the right.
- Bottom row: why? The Loki syslog stream, probe round-trip time and the web server's CPU.
The or vector(0) on the probe tile matters. Without it, a healthy network returns no series, and the tile says "No data" instead of a reassuring green 0.
Every panel title ends with its source in brackets, like Problems (Zabbix) or Network syslog (Loki). It looks fussy, but when two panels disagree, the first question is always "where does this one come from?" A mixed dashboard should answer that without anyone opening the panel editor.
Adding the Zabbix problems panel
The Zabbix plugin ships its own Problems panel type. I copied the panel from the Zabbix overview dashboard built earlier in the series, then changed the host group and host filters from dashboard variables to the regex /.*/ so it shows everything:
"targets": [{
  "datasource": {"type": "alexanderzobnin-zabbix-datasource", "uid": "zabbix"},
  "queryType": "5",
  "group": {"filter": "/.*/"},
  "host":  {"filter": "/.*/"},
  "options": {"acknowledged": 2, "minSeverity": 0, "sortProblems": "default"}
}]
I also tried a fifth tile that counted open Zabbix problems. It didn't work. On this plugin version, a problems query only renders in the plugin's own table panel. A stat panel shows "No data", even with a reduce transformation in front of it. Grafana's query API rejects it too, with non-metrics queries are not supported. So I dropped the tile, and the table is the source of truth for Zabbix. If you need a Zabbix problem count as a number, you have two options: alert on it in Zabbix itself, or poll it through the Zabbix API into Prometheus. I haven't built either here.
A real fault, caught by both sides
Partway through the build, the lab restarted and came back broken. This is the dashboard the first time I loaded it:
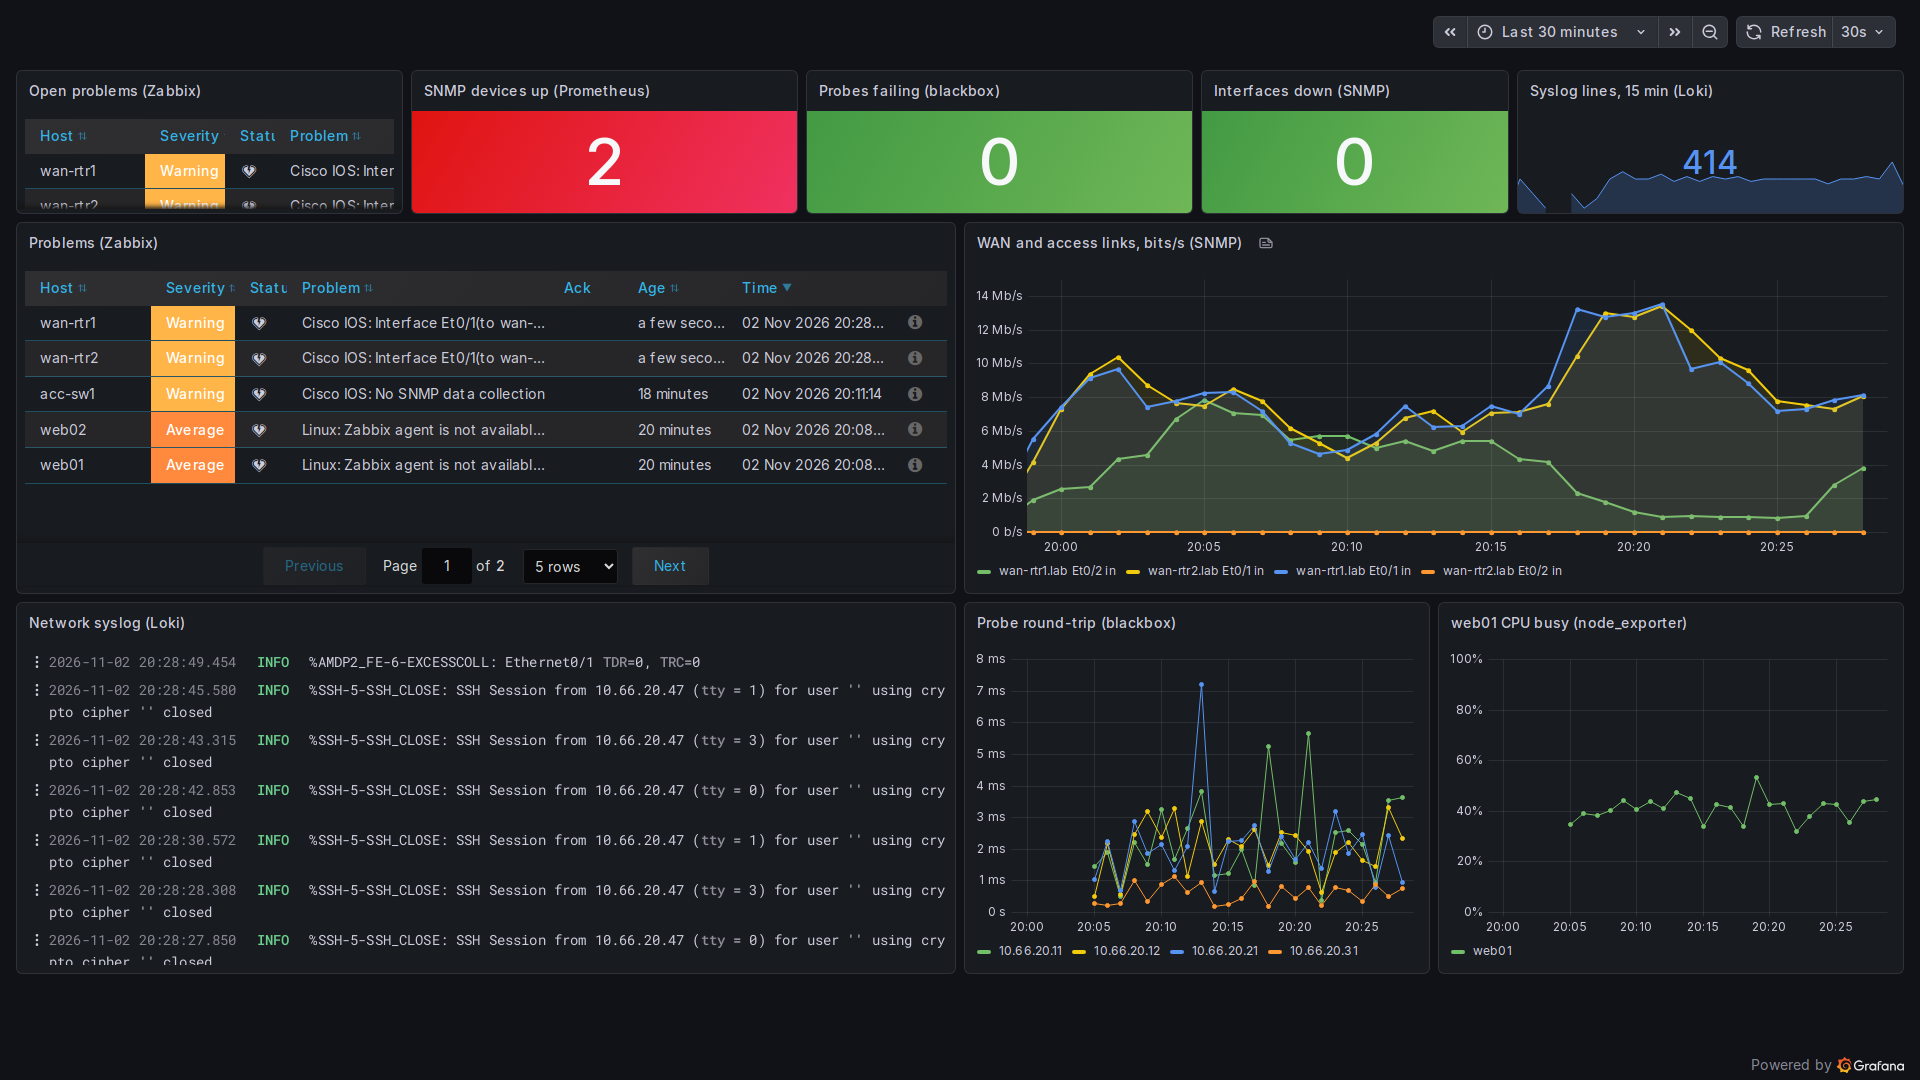
Two separate tools, polling separately, said the same thing about acc-sw1:
- Prometheus:
up{job="snmp", instance="10.66.20.21"}was 0, so the devices-up tile went red at 2. - Zabbix: acc-sw1: No SNMP data collection.
Since both tools failed at the same time, the problem was almost certainly on the switch and not in either poller. On the switch, SNMPv3 requests were being rejected for authentication. Removing and re-adding the SNMPv3 user (the same snmp-server user ... v3 auth sha ... line from the SNMP post, with the real secret) fixed it. Both tools went green within one poll cycle.
Two more things were wrong, and both are worth writing down:
- Management IP drift. After the restart, the Zabbix server and the test mail server had swapped management addresses. The routers' SNMP ACL only permits the Zabbix server's address, so Zabbix lost SNMP to the routers too, and alert email was pointed at the wrong host. I pinned both addresses back. If your monitoring server's address can change, your device ACLs will break when it does.
- A stale host. web02 was found by Zabbix network discovery earlier and no longer exists. It still shows Zabbix agent is not available. In production, I'd disable it. I left it in the screenshot because stale discovered hosts are a real thing NOC screens have to deal with.
The High bandwidth warnings on the WAN routers in the fault screenshot are synthetic. Load generators in the lab push traffic over the WAN links so the graphs have something to show. Don't read them as a real capacity problem.
Filtering probe noise out of syslog
The first version of the Loki panel was useless. The blackbox SSH probe from part 8 opens a TCP session to each router every 15 seconds and closes it straight away. Each close produces a %SSH-5-SSH_CLOSE log line, so the log panel was mostly probe noise. The fix is one regex line filter in LogQL that drops sessions from the probe's address:
{job="network-syslog"} !~ "SSH_CLOSE: SSH Session from 10.66.20.47"Filter on the specific source and not on SSH_CLOSE in general. An SSH session from somewhere unexpected is exactly the kind of line a NOC should see. The interface errors that remain in the panel (EXCESSCOLL) are from the lab's virtual interfaces. They're real log lines, just not interesting ones.
Building it as code
Like the dashboards in the dashboards-as-code post, this one is built by a short Python script against the Grafana HTTP API. Panels are defined in a helper, posted with overwrite: true and given a fixed uid, so rebuilding is safe:
add("SNMP devices up  (Prometheus)", "stat", PROM, 0, 0, 6, 4,
    [{"refId": "A", "expr": 'sum(up{job=~"snmp-cisco-.*"})'}],
    defaults={"thresholds": th((None, "red"), (3, "green"))})
api("POST", "dashboards/db", {"dashboard": dash, "overwrite": True})
The threshold says red below 3, green at 3. That is hard-coded for three devices. A better version would compare against the number of targets defined, but for a fixed lab this is honest and easy to read.
What I'd change for production
- Get the Zabbix problem count into a number tile, through Zabbix's own API or an exporter, so the top row covers all three tools.
- Put the device count threshold in a variable rather than hard-coding 3.
- Add links from each tile to the detailed dashboard behind it.
The point stands without those changes, though. One screen showed the acc-sw1 fault from two directions, and the logs were one panel away. The next part takes this dashboard to an actual wall screen. On a TV across the room, most of this detail stops working.
Now live: Grafana NOC wall screen design turns this dashboard into something readable from across the room.