
The NOC dashboard from the last part works well on a laptop. Put it on a TV across the room and it stops working. Panel titles become grey smudges, the log lines can't be read, and the one red number you need to see is the same size as everything else.
A wall screen is a different product from a working dashboard. This post covers how I redesigned one for that job, built in my home lab with Grafana 13.0.2 on top of the same Zabbix, Prometheus and blackbox data, for two Cisco IOS XE WAN routers, an access switch and a Linux web server.

The starting point
This is the Zabbix overview dashboard from earlier in the series at the same 1920x1080 resolution. It's a good dashboard for investigating. It's a bad one for a wall:
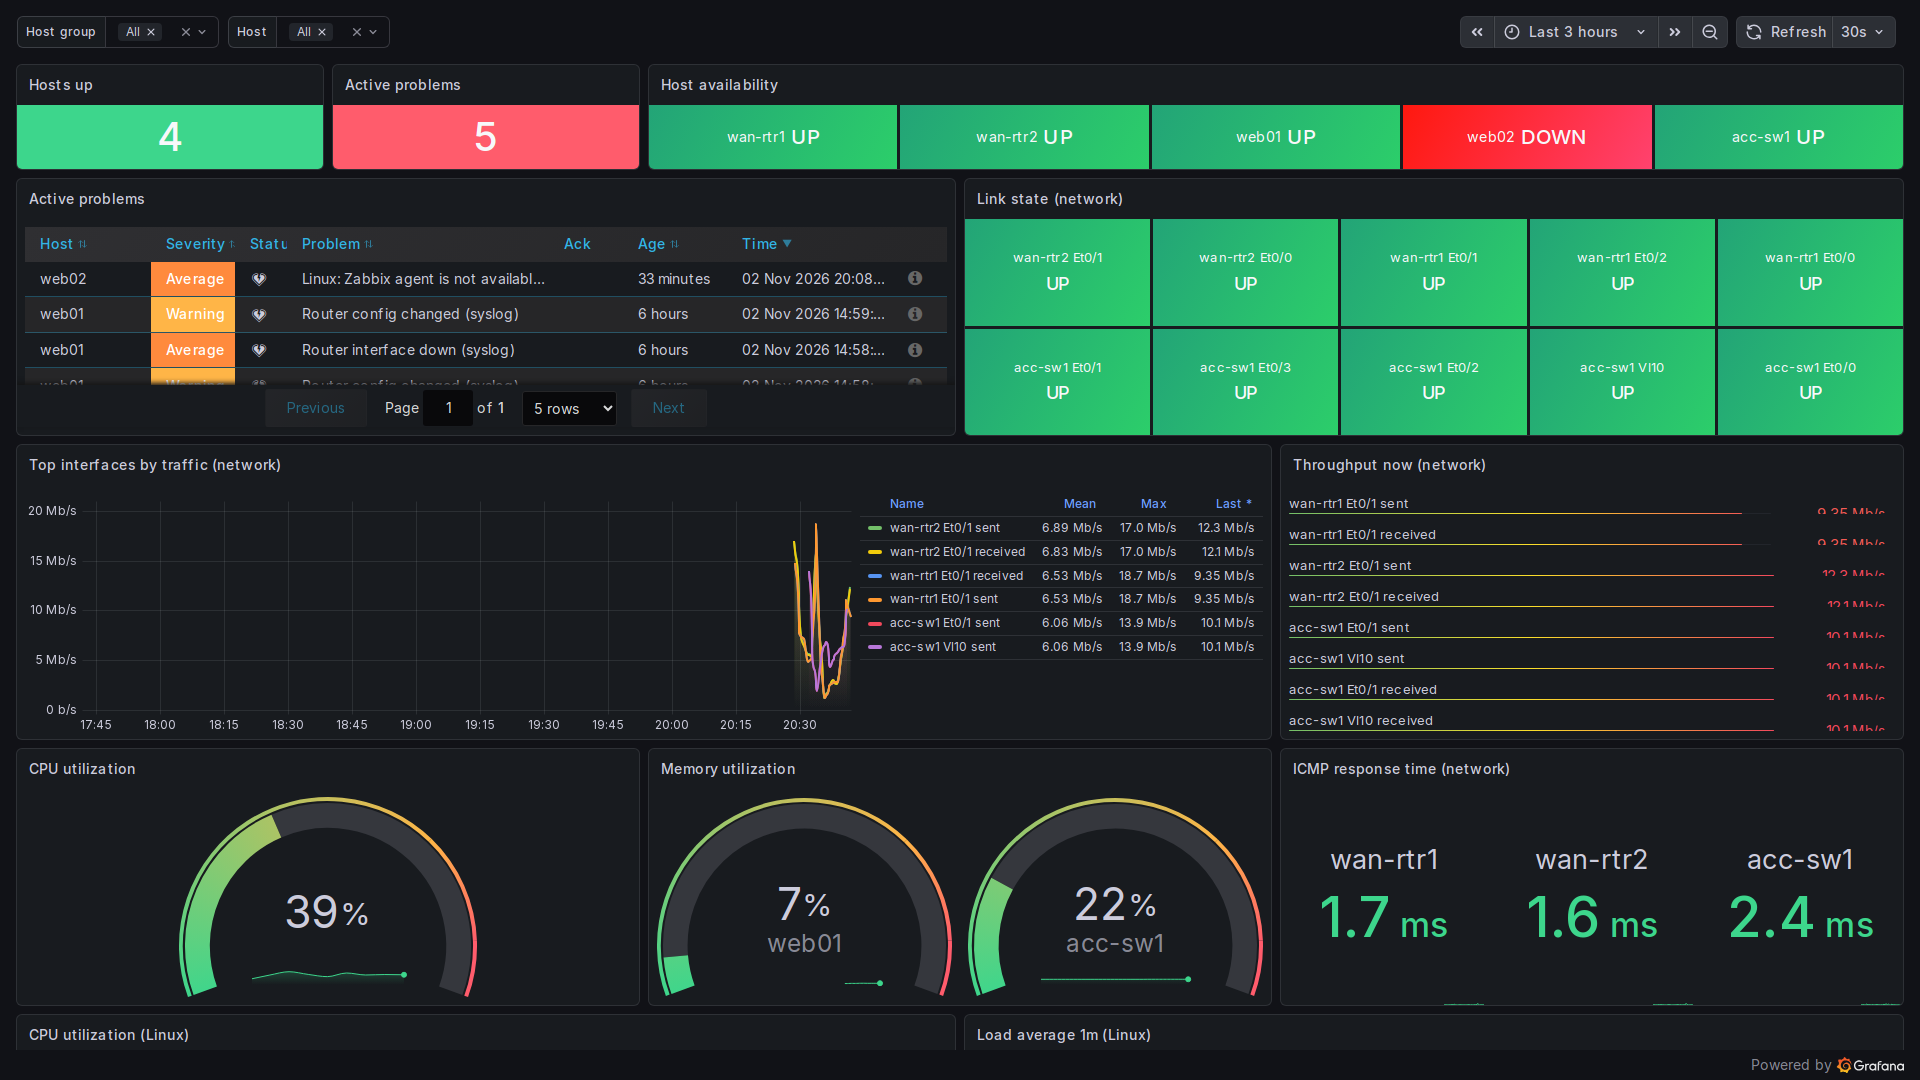
Here's what goes wrong at a distance:
- Everything is green and the same size. Ten link tiles all say UP. They take a third of the screen to say nothing.
- Small text. The throughput list and the table columns can't be read from more than a metre or two away.
- It scrolls. The Linux row is cut off at the bottom. A wall screen can't be scrolled, so anything below the fold doesn't exist.
- Template variables. The host group and host pickers at the top are useful at a desk and only add clutter on a wall.
The rules I used
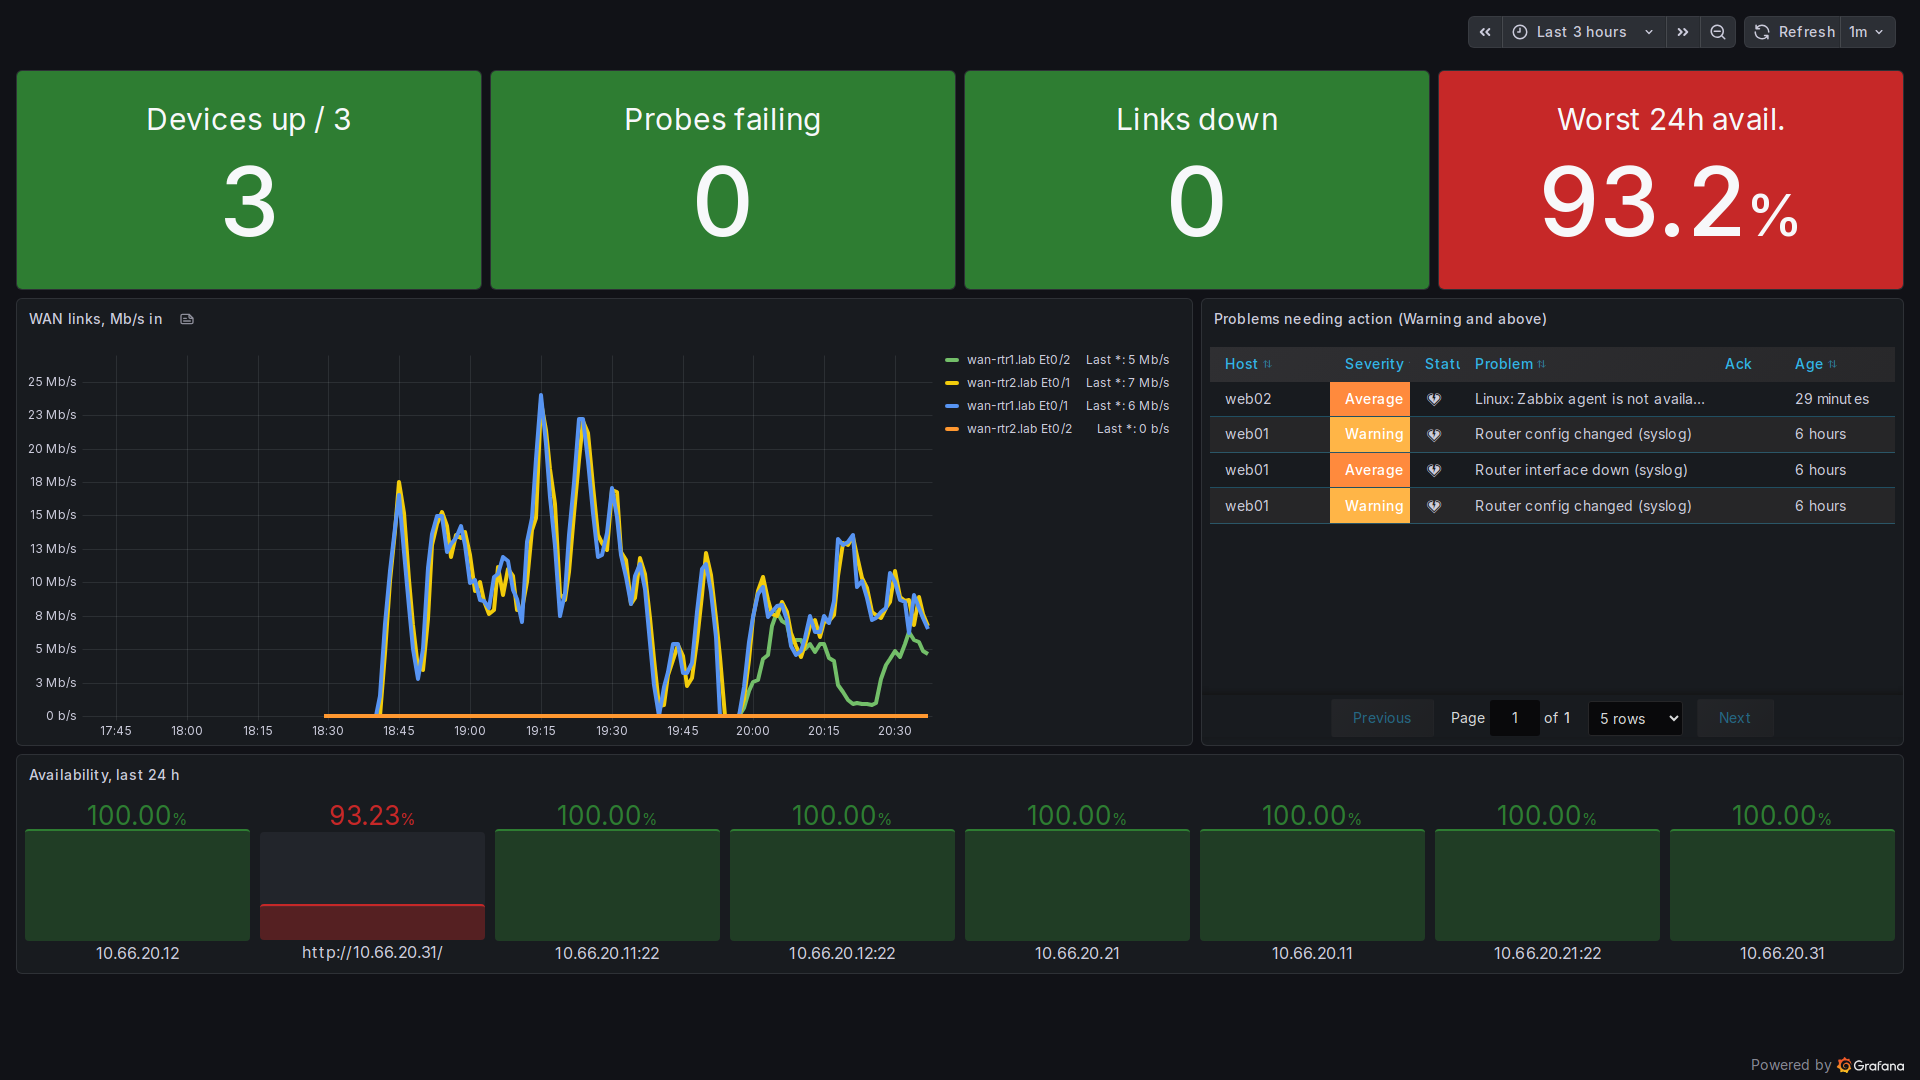
- Answer one question first. The top row is four tiles: devices up out of 3, probes failing, links down and worst availability over 24 hours. Each tile has a solid colour background, a 30px title and a 96px value.
- Colour means action. Green is fine, red is "someone look at this". No gradients, no decorative colour. If a tile is red, there's a reason.
- Fit on one screen. The whole layout fits in 1920x1080 in kiosk mode, with nothing below the fold.
- Thick lines, few series. The WAN graph shows only the four WAN interfaces, with
lineWidth: 4and the legend on the right, showing the last value. - Filter the list. The Zabbix problems panel uses
minSeverity: 2, so it only shows Warning and above. Information-level noise stays on the working dashboard. - A slow refresh. One minute, over three hours. A wall shows trends and current state, not the last 30 seconds.
The tiles
Each tile is a stat panel with the value and name shown inside the tile, so the title is part of the coloured block. The thresholds are explicit:
"options": {
  "colorMode": "background_solid",
  "graphMode": "none",
  "textMode": "value_and_name",
  "text": {"titleSize": 30, "valueSize": 96}
},
"thresholds": {"steps": [
  {"color": "red", "value": null},
  {"color": "green", "value": 3}
]}
Use background_solid, not background. The default mode adds a gradient that looks nice up close but makes the colour harder to read at a distance. I also turned off the sparkline (graphMode: none). A tiny line inside a big number is just noise from across a room.
The availability tile uses the blackbox data from the blackbox exporter post:
avg_over_time(probe_success[24h]) * 100The tile shows the minimum across all probes. In the screenshot it's red at 93.2%, because I took the web server's HTTP service down on purpose for a couple of minutes while writing that post. It's a real dip, not a staged one, but it's a lab outage I caused.
Fixing the bar gauges
In the blackbox post I used gradient bar gauges for availability and said I'd come back to them. The gradient display mode colours the bar from green to red along its length. A 100% bar then contains red at its far end and looks worse than it is. On a wall, that's misleading.
The wall uses displayMode: basic. Each bar is one flat colour, chosen by its threshold, so a red bar always means a probe below target. In the screenshot, only the HTTP probe is red.
What I left off
- Logs. The Loki syslog panel from the NOC dashboard is gone. Log lines can't be read from a distance, and a scrolling list is distracting. The logs are one click away on the working dashboard.
- Per-host CPU and memory. These are useful when investigating, not for spotting a problem.
- A Zabbix problem count tile. I wanted a fifth tile with the number of open Zabbix problems. As in the last part, the Zabbix plugin's problems query only renders in its own table panel on this version, so the stat tile showed "No data". I removed it. The problems list is still on screen, and it's the honest source.
Honest caveats
- The WAN traffic is synthetic. Load generators in the lab push traffic over the links so the graph has shape.
- web02 in the problems list is a stale host from Zabbix network discovery, not a real outage. On a production wall, I'd disable it so it doesn't train people to ignore red.
- The "devices up / 3" threshold is hard-coded for three devices.
- I designed and checked this from screenshots at 1920x1080. I haven't tested it on a physical TV at distance, so the font sizes are a starting point, not a tested standard.
Wrapping up the series
That's the last part of this Grafana series. It started with SNMP into Prometheus and ends with a screen built to be read from across a room. The dashboards are built as code, as covered in the dashboards-as-code post, so the working NOC view and this wall can both be rebuilt from scripts.