
Suricata runs as an inline IPS on Linux by taking packets from NFQUEUE: an nftables forward rule queues traffic to queue 0, Suricata starts with -q 0, and a drop rule's verdict stops the packet. Built in my home lab between two Cisco IOL routers, one UDP datagram matching SID 6100001 reached the sensor's eth1, never left eth2, logged [Drop] in fast.log and never reached the server. Clean probes before and after still echoed.
The matching payload also echoed before IPS activation and again after I removed the queue rule. That combination ties the observed loss to the inline inspection path and shows ordinary forwarding kept working. It's one controlled lab signature with a made-up test string, not a test of real threat blocking.
Lab topology: a routed Suricata sensor between two IOL routers
Five nodes formed a routed chain: Alpine client → IOL R1 → Suricata NFQUEUE sensor → IOL R2 → Alpine UDP echo server. The sensor forwarded IPv4 between eth1 and eth2 as a routed Layer 3 hop, not a bridge. Unlike passive Suricata on a SPAN port, this sensor sits in the forwarding path, so its verdict decides whether a packet continues.
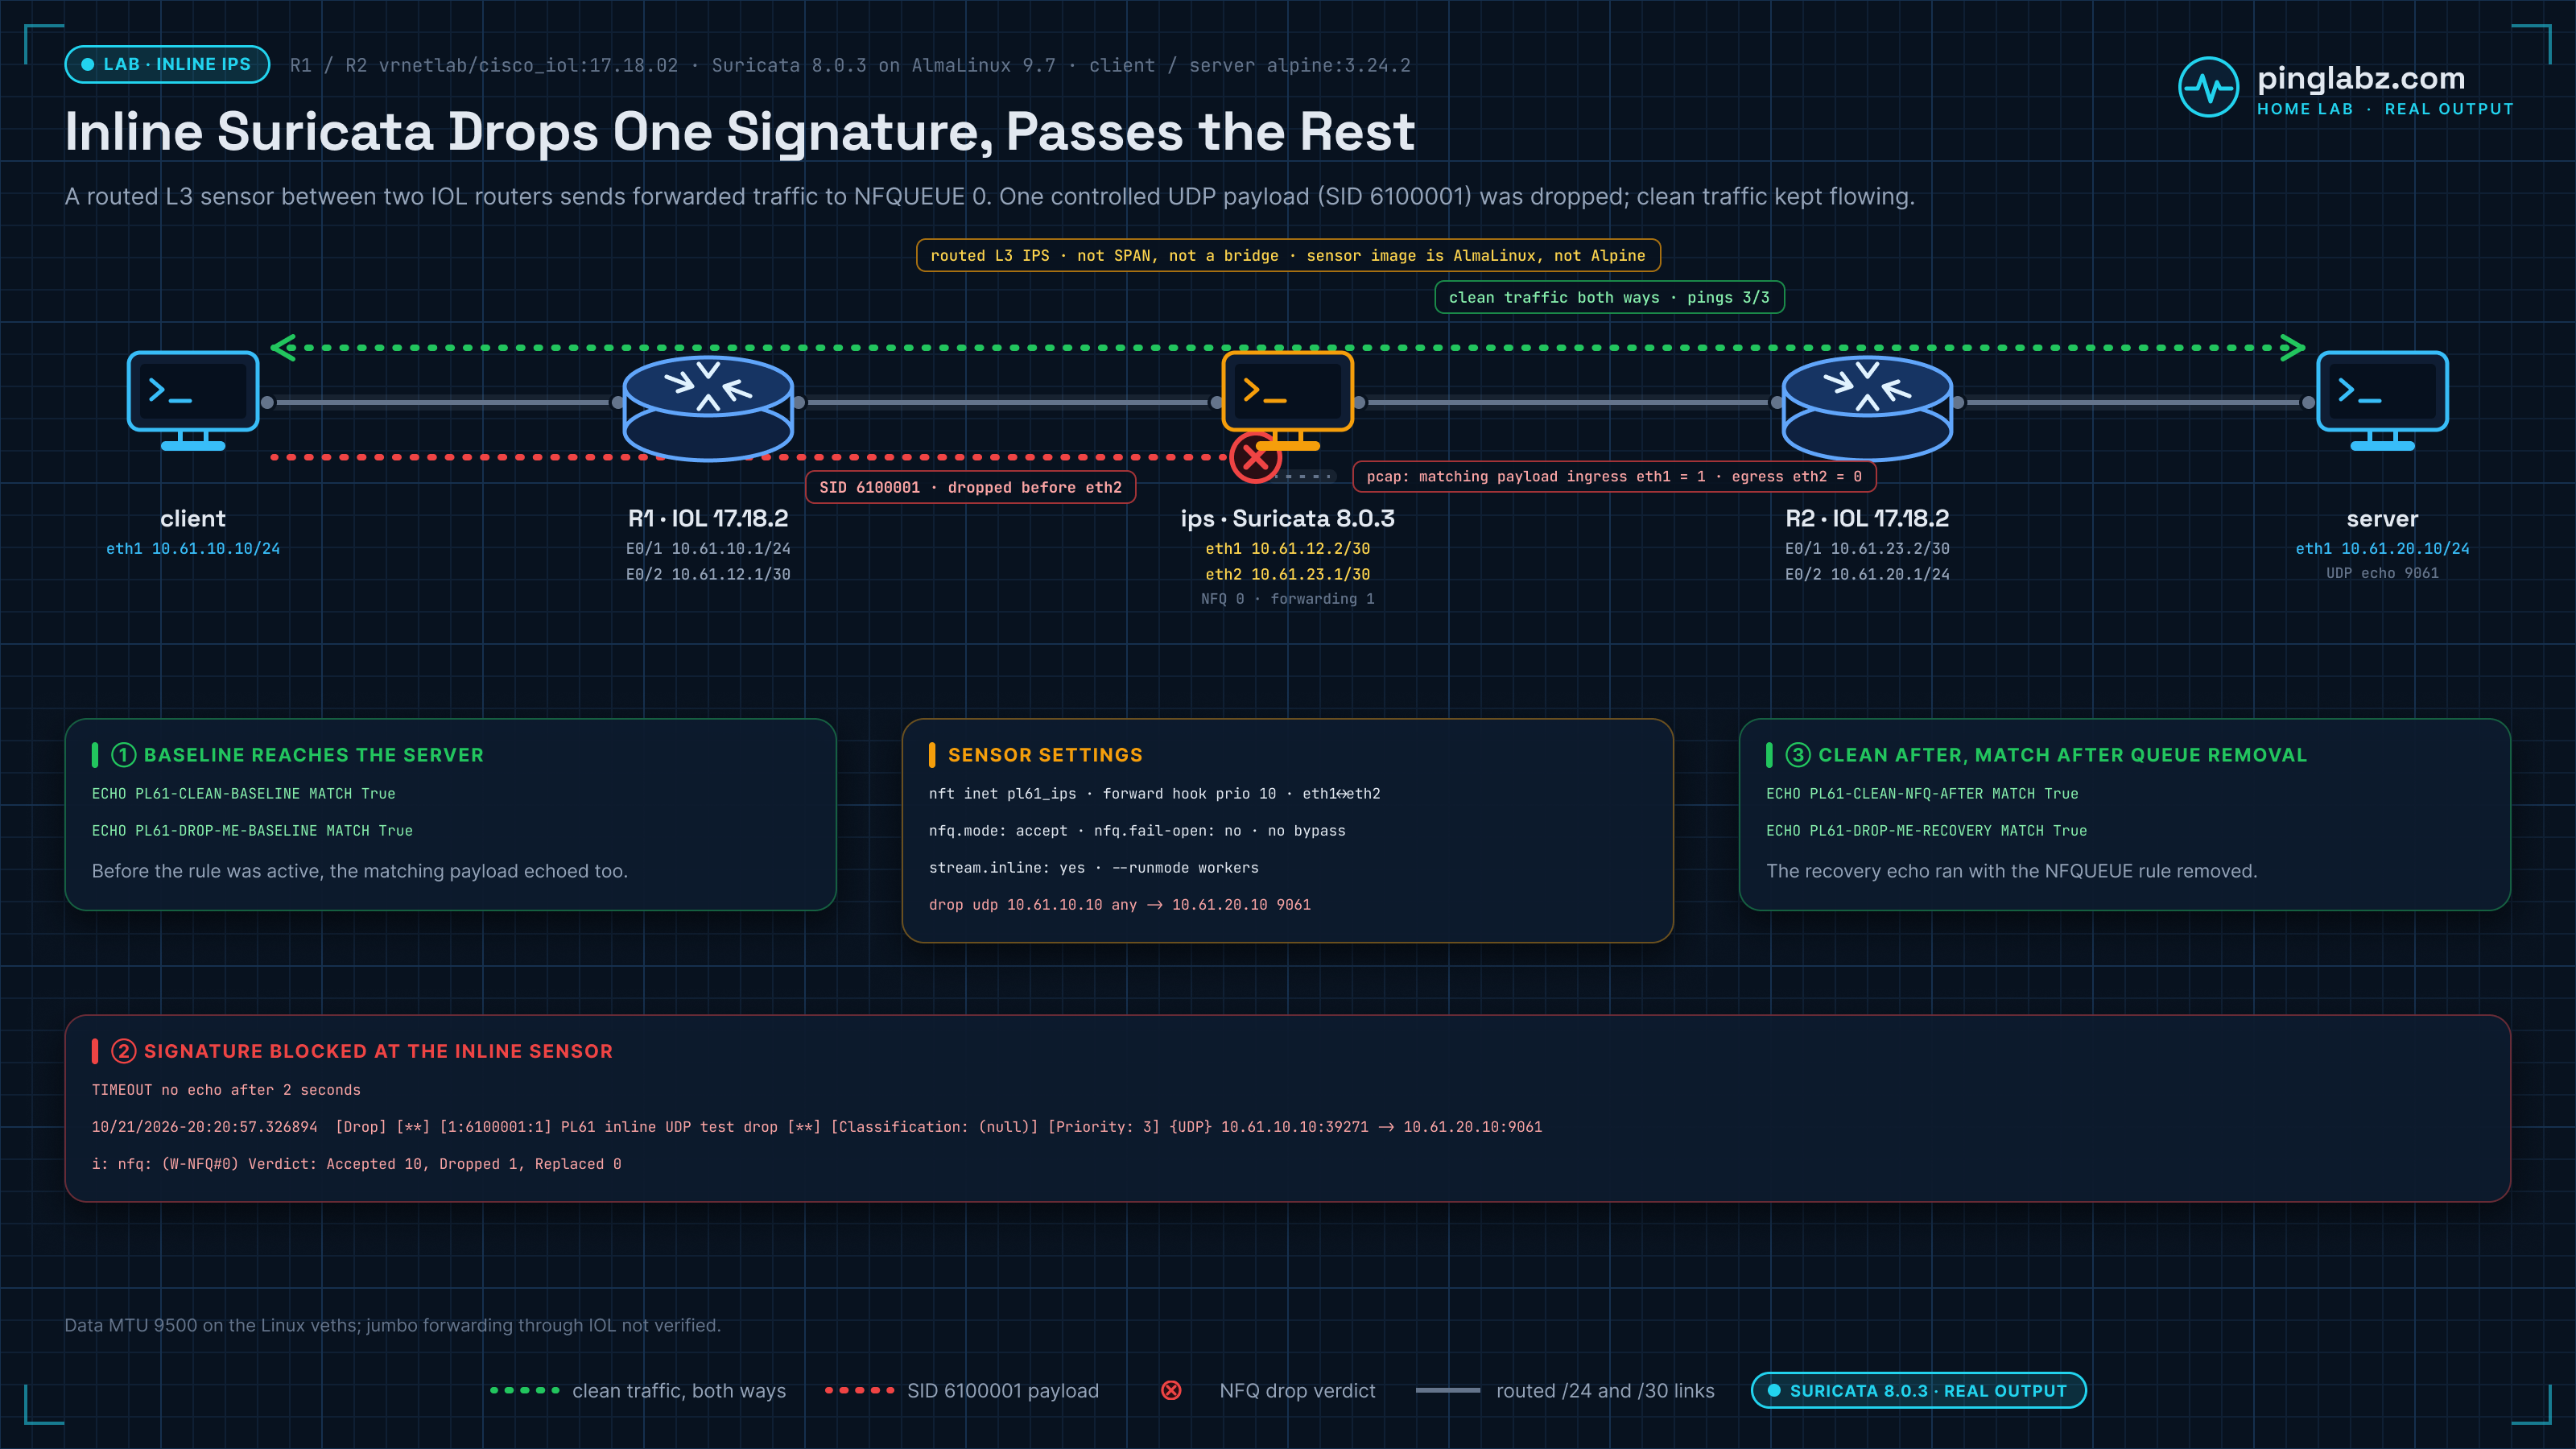
| Node | Data interfaces and addresses |
|---|---|
| Client | eth1: 10.61.10.10/24 |
| R1 | E0/1: 10.61.10.1/24; E0/2: 10.61.12.1/30 |
| Suricata IPS | eth1: 10.61.12.2/30; eth2: 10.61.23.1/30 |
| R2 | E0/1: 10.61.23.2/30; E0/2: 10.61.20.1/24 |
| Server | eth1: 10.61.20.10/24; UDP/9061 echo |
Both routers ran IOS 17.18.2 from vrnetlab/cisco_iol:17.18.02 (Cisco IOL in containerlab). The client and server ran Alpine 3.24.2. The sensor image, jasonish/suricata:8.0.3, ran Suricata 8.0.3 on AlmaLinux 9.7. Management used a separate path; the test used specific data routes.
nftables queue rule, drop signature and suricata.yaml
R1 routed the server subnet through sensor eth1, and R2 routed the client subnet back through sensor eth2:
ip route 10.61.20.0 255.255.255.0 10.61.12.2
ip route 10.61.10.0 255.255.255.0 10.61.23.1
The first line is from R1, the second from R2. The sensor had IPv4 forwarding enabled, a route to 10.61.10.0/24 through 10.61.12.1, and a route to 10.61.20.0/24 through 10.61.23.2. The client routed the server subnet through 10.61.10.1, and the server routed the client subnet through 10.61.20.1.
A dedicated nftables table queued only traffic forwarded between the sensor's two data interfaces:
table inet pl61_ips {
    chain forward {
        type filter hook forward priority 10; policy accept;
        iifname "eth1" oifname "eth2" counter queue num 0
        iifname "eth2" oifname "eth1" counter queue num 0
    }
}
The sensor image has no nft, so I loaded the table from the host into the sensor's network namespace with nsenter -n. The host firewall wasn't touched.
The complete test signature:
drop udp 10.61.10.10 any -> 10.61.20.10 9061 (msg:"PL61 inline UDP test drop"; content:"PL61-DROP-ME"; sid:6100001; rev:1;)
The rule matches the literal string PL61-DROP-ME in UDP from this client to this server on port 9061. It's a lab-only string, not malware. The baseline, inline and recovery probes all contained it.
The relevant sensor settings:
stream:
  inline: yes
nfq:
  mode: accept
  fail-open: no
The same YAML enabled EVE alert, drop and stats output, plus fast.log. With no bypass on the queue rule and fail-open: no, queued traffic should stop if Suricata isn't running, per Suricata's IPS guide. I didn't test that here: Suricata was never stopped while traffic was flowing through the queue. Router and address configurations stayed the same through baseline, inline and recovery; only adding and removing the queue table changed whether forwarded traffic went through inspection.
Baseline: prove that the matching payload can pass
Before inspection, the client got all three ping replies. Both clean and signature-matching UDP payloads echoed, and the server log recorded them. The matching baseline probe returned:
ECHO PL61-DROP-ME-BASELINE MATCH True
This baseline gives the later timeout its meaning. A stopped echo service, a missing route or a broken UDP path could also produce silence. Successful baseline delivery shows the matching bytes were deliverable before the queue was in place.
Gotcha: --runmode single isn't available for NFQ
My first start requested --runmode single. Suricata's NFQ capture rejected it:
E: runmodes: The custom type "single" doesn't exist for this runmode type "NFQ". Please use --list-runmodes to see available custom types for this runmode
--list-runmodes showed workers as a supported NFQ runmode. That isn't a bug: Suricata's runmode docs note NFQ setups use autofp by default, and workers is the other supported option. The failed start also left a stale PID file, which blocked the next start until I confirmed no Suricata process was running and removed it. No test traffic was sent during that failed interval, so it doesn't count toward the result.
Start Suricata on queue 0 with --runmode workers
The working start, in its general form:
suricata -c suricata.yaml -S pl61.rules -q 0 --runmode workers
Suricata reported:
i: threads: Threads created -> W: 1 FM: 1 FR: 1 Engine started.
I also checked /proc/net/netfilter/nfnetlink_queue for a kernel listener on queue 0 before sending traffic. A preflight test had already confirmed that nft queueing worked, and the Suricata build reported NFQueue support. An image that merely contains the binaries isn't proof that either part works.
Verify the drop: pcaps, fast.log, EVE and the NFQ verdict
With the listener active, a clean UDP probe echoed. The matching inline probe, from source port 39271, then returned:
TIMEOUT no echo after 2 seconds
Suricata's fast.log line names the rule and the flow:
10/21/2026-20:20:57.326894 [Drop] [**] [1:6100001:1] PL61 inline UDP test drop [**] [Classification: (null)] [Priority: 3] {UDP} 10.61.10.10:39271 -> 10.61.20.10:9061
The EVE JSON records show one alert with action blocked and one drop event with reason rules, both for SID 6100001. They describe the same packet, not two dropped datagrams. EVE's pkt_src: wire/pcap just means a real packet, not a pseudo-packet; Suricata uses that label for every capture method, including NFQ.
Paired tcpdump captures on both sensor interfaces give the boundary check. My verification script counted:
PCAP sensor eth1: 5 UDP packets; matching test payload ingress = 1
PCAP sensor eth2: 4 UDP packets; matching test payload egress = 0
Each clean control added a request and an echo on both interfaces; the one matching request makes five on eth1 and four on eth2. Both captures reported zero kernel drops. The server log didn't contain the inline matching payload, and a second clean probe right afterward echoed.
The NFQ shutdown summary:
i: nfq: (W-NFQ#0) Verdict: Accepted 10, Dropped 1, Replaced 0
The accepted total covers all queued traffic, not just the UDP packets in the capture filter, so don't compare 10 directly with the five and four UDP packets. The run recorded zero NFQ errors.
Remove the queue rule and the same payload passes
Recovery deleted only table inet pl61_ips in the sensor namespace. With no queue rule, forwarded packets no longer went to Suricata at all, and the matching recovery probe echoed:
ECHO PL61-DROP-ME-RECOVERY MATCH True
That echo doesn't mean Suricata let the payload through; the packet never reached Suricata, because the queue rule was gone.
| Phase | Probe | Result |
|---|---|---|
| Before IPS | Matching baseline payload | Echo |
| NFQ active | Clean probe before | Echo |
| NFQ active | Matching inline payload | Timeout; ingress 1, egress 0 |
| NFQ active | Clean probe after | Echo |
| Queue table removed | Matching recovery payload | Echo (not inspected) |
Removing the queue restored delivery without changing addressing, routes or the echo service. The matching baseline and recovery payloads, plus the clean controls on either side, attribute this one packet's loss to the rule verdict.
What this lab didn't test
This is one controlled UDP signature through a routed Layer 3 NFQUEUE sensor, not a transparent bridge, a throughput test or a measure of real threat blocking. TCP/HTTP, IPv6, load, and the behavior when Suricata is down or the queue fills (fail-open: no was set but not exercised) weren't tested. The Linux data veths had an MTU of 9500, but this small-packet test didn't verify jumbo frames through IOL. Source port 39271 was ephemeral; it identifies the recorded probe and isn't part of the configuration.
Key takeaways
- A timeout becomes convincing drop evidence when the ingress packet, the missing egress packet, the rule verdict and the server's non-receipt all agree, while clean controls keep passing.
- An alert is not a block. Check for the [Drop] action and the NFQ "Dropped" count; the same distinction applies to Snort 3 Detection vs Prevention on FMC.
- Confirm the queue listener and a supported NFQ runmode before you read anything into traffic loss. A rule file and a queue rule alone aren't enough.
- Use nft monitor trace to confirm packets are actually hitting the queue rule, and Community ID to line Suricata events up with other sensors.