
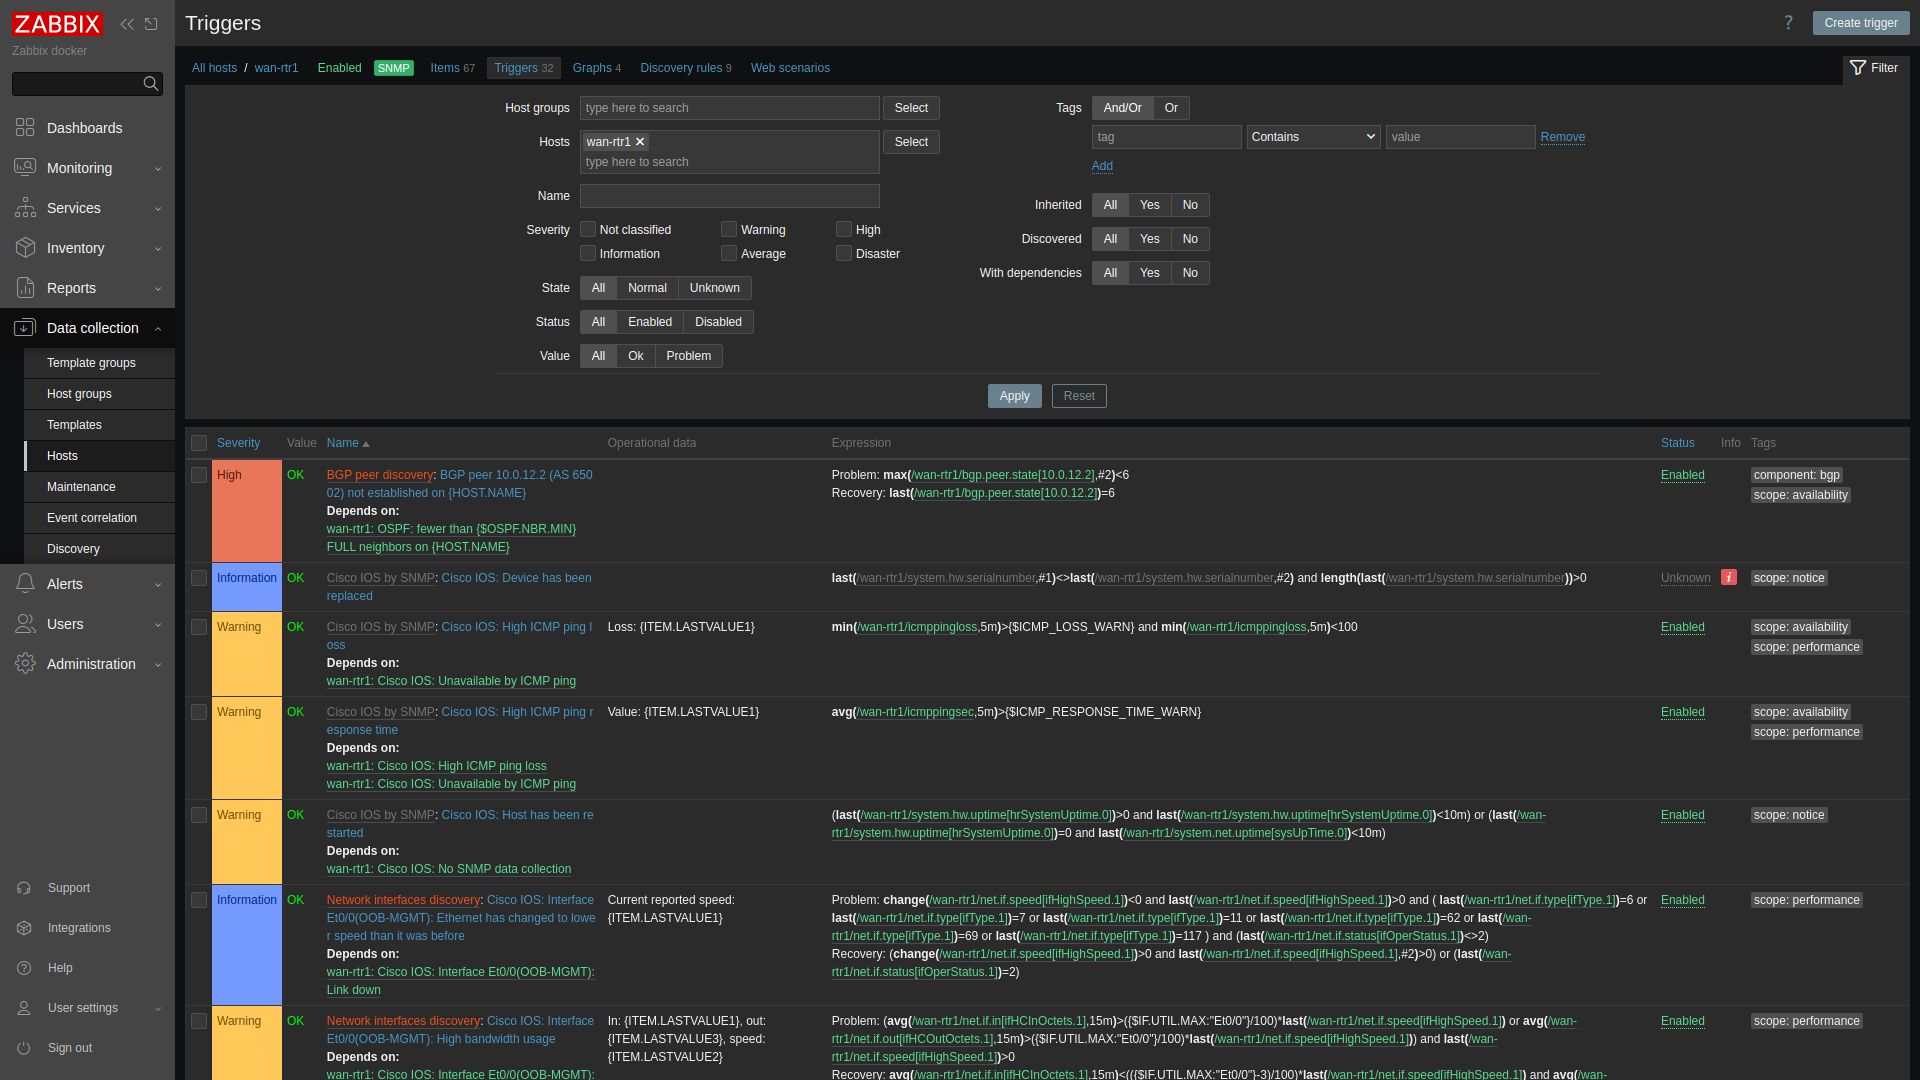
Linking a new Cisco router or switch to the stock Cisco IOS by SNMP template in Zabbix 7.0 gives you a lot of items and triggers straight away. On my first router it was 67 items and 32 triggers. On the access switch it was 71 items and 29 triggers. Some of those triggers matter a lot. Others will page you for nothing. This checklist sorts them, and it's based only on what I saw fire, or fail to collect, on two devices built in my home lab: Cisco IOS XE 17.18.2, monitored with Zabbix 7.0 LTS over SNMPv3.
This post is part of the Zabbix network monitoring series.
This is part 5 of the series. Earlier parts: triggers and dependencies, email alerts and escalation, syslog and SNMP traps and discovery and API onboarding.

First ten minutes: check that the data exists
Before you think about alerts, open Latest data for the new host and look for empty values. On my devices several things the template expects simply weren't there:
- Hardware model name and Hardware serial number went unsupported on both devices with "No Such Object".
- Uptime (hardware) read 0, while Uptime (network) was fine.
- The CPU, memory, fan, PSU and temperature discovery rules found nothing, so those devices had no CPU or memory items and no environment triggers at all.
That last point is the dangerous one, because nothing tells you about it. A missing CPU trigger doesn't show up as a problem. If your hardware does return those tables you'll get the items. If it doesn't, you need to know before you rely on them. A quick test from the Zabbix server:
snmpwalk -v3 -l authPriv -u <SNMP_USER> -a SHA -A <AUTH_PASS> -x AES -X <PRIV_PASS> \
  <DEVICE_IP> 1.3.6.1.4.1.9.9.109.1.1.1   # cpmCPUTotalTable
Disable the unsupported items, or leave them and accept the grey "unsupported" count. Either way, write down what isn't collected.
Alert on these
All of these fired during the lab for a real reason, and every time I wanted to know.
| Trigger | Times it fired | Why keep it |
|---|---|---|
| WAN link down (my own item on the uplink) | 7 | The one that matters most |
| Interface Et0/1: Link down | 5 | An uplink, so it counts |
| Unavailable by ICMP ping | 3 | The device is gone |
| No SNMP data collection | 1 | Reachable but blind, for example after a credential change |
| Host has been restarted (uptime < 10m) | 7 | Every one was a real reload |
| BGP peer not established / OSPF fewer than expected FULL | 2 each | Routing loss shows up before users call |
| High ICMP ping loss | 1 | Early warning before full loss |
Use dependencies so a dead device gives you one problem, not ten. Interface, SNMP and routing triggers should depend on "Unavailable by ICMP ping". Part 1 covers how to set that up, and the SNMPv3 setup guide covers adding the device.
Tune these before go-live
High bandwidth usage
This fired 9 times in total across interfaces, and none of them was real. Every interface on my devices reported ifSpeed as 10000000, which is 10 Mbps, so ordinary lab traffic crossed 90 percent. Check what speed your device reports. If it's wrong, set the real bandwidth on the interface (bandwidth under the interface on IOS XE), or override the speed per interface with the template's context macros. Don't just raise the threshold.
Error rate on the management port
"High error rate" fired twice on the out-of-band management interface and once each on two others. Errors on an uplink deserve a ticket. Errors on the management port usually don't deserve a page. Lower that one's severity, or exclude the interface with the interface discovery filter macros.
Admin-down and unused ports
Interface discovery picked up Et0/3, which was admin down with no description. The template's {$NET.IF.IFADMINSTATUS.NOT_MATCHES} macro was still at its default value of CHANGE_IF_NEEDED, so nothing was filtered. On a 48-port access switch that becomes a lot of items. I'd only alert on link down for ports that have a description. That's a good habit anyway: describe uplinks, and leave user ports quiet.
"Ethernet has changed to lower speed"
This one is fine on uplinks. On access ports it just tracks laptops going to sleep. Scope it with tags or the description filter.
Safe to ignore
- Device has been replaced (serial number changed). It can't work when the serial item is unsupported, which it was here. Disable it, or keep it only where the serial is collected.
- Raw SNMP walk items. These are master items that feed the discovered items. They hold no useful values themselves, so there's no need to graph or alert on them.
The checklist
- Link the template, wait one discovery cycle, then open Latest data and list every empty or unsupported item.
- Confirm CPU, memory and environment items exist. If they don't, say so in the host description.
- Check the reported interface speed against reality, and fix bandwidth before trusting utilisation triggers.
- Set interface discovery macros so unused and admin-down ports stay out.
- Keep link down for described uplinks only. Lower severity for management-port errors.
- Make interface, SNMP and routing triggers depend on ICMP availability.
- Bounce one uplink on purpose and confirm you get exactly one email (part 2) and one trap or syslog line (part 3).
Next in the series: keeping the Zabbix database under control, with housekeeping, retention, backups and the upgrade path.
Now live: Zabbix housekeeping, backups and the 7.0 LTS upgrade path finishes the series.