
This is the hub for the PingLabz flow visibility series. SNMP tells you a link is busy. Flow data tells you who is making it busy, and that's the question you get asked during an outage. These five posts were built in my home lab with two Cisco IOS XE 17.18.2 routers exporting NetFlow v9 to open source collectors.
The first post sets up Akvorado v2026.10.1: the exporter config on the router, SNMPv3 interface enrichment, classifiers, the Sankey view and top talkers. It also covers the ClickHouse crash on CPUs without AVX2 and how I fixed it. The second post uses that setup to answer "who is eating the WAN?" with boundary filters and path drill-down. It also shows the double-counting trap you fall into when you count flows on both ends of a link, and how to check the router's own flow cache.
The third post feeds the same flows into Akvorado and into a lighter GoFlow2 plus Loki stack. The byte totals match exactly. The memory doesn't: about 2.4 GiB against 146 MiB. I compare storage and LogQL against SQL, and show where the lighter stack stops being enough.
The last two posts go past bandwidth. Port scans and ping sweeps barely show up in traffic graphs, but counting distinct ports and hosts per source in ClickHouse finds them quickly. pmacct's nfacctd 1.7.9 turns the same NetFlow into per-minute CSV files and a SQLite table, which suits scripts and reports better than dashboards. I cross-checked its numbers against Akvorado.
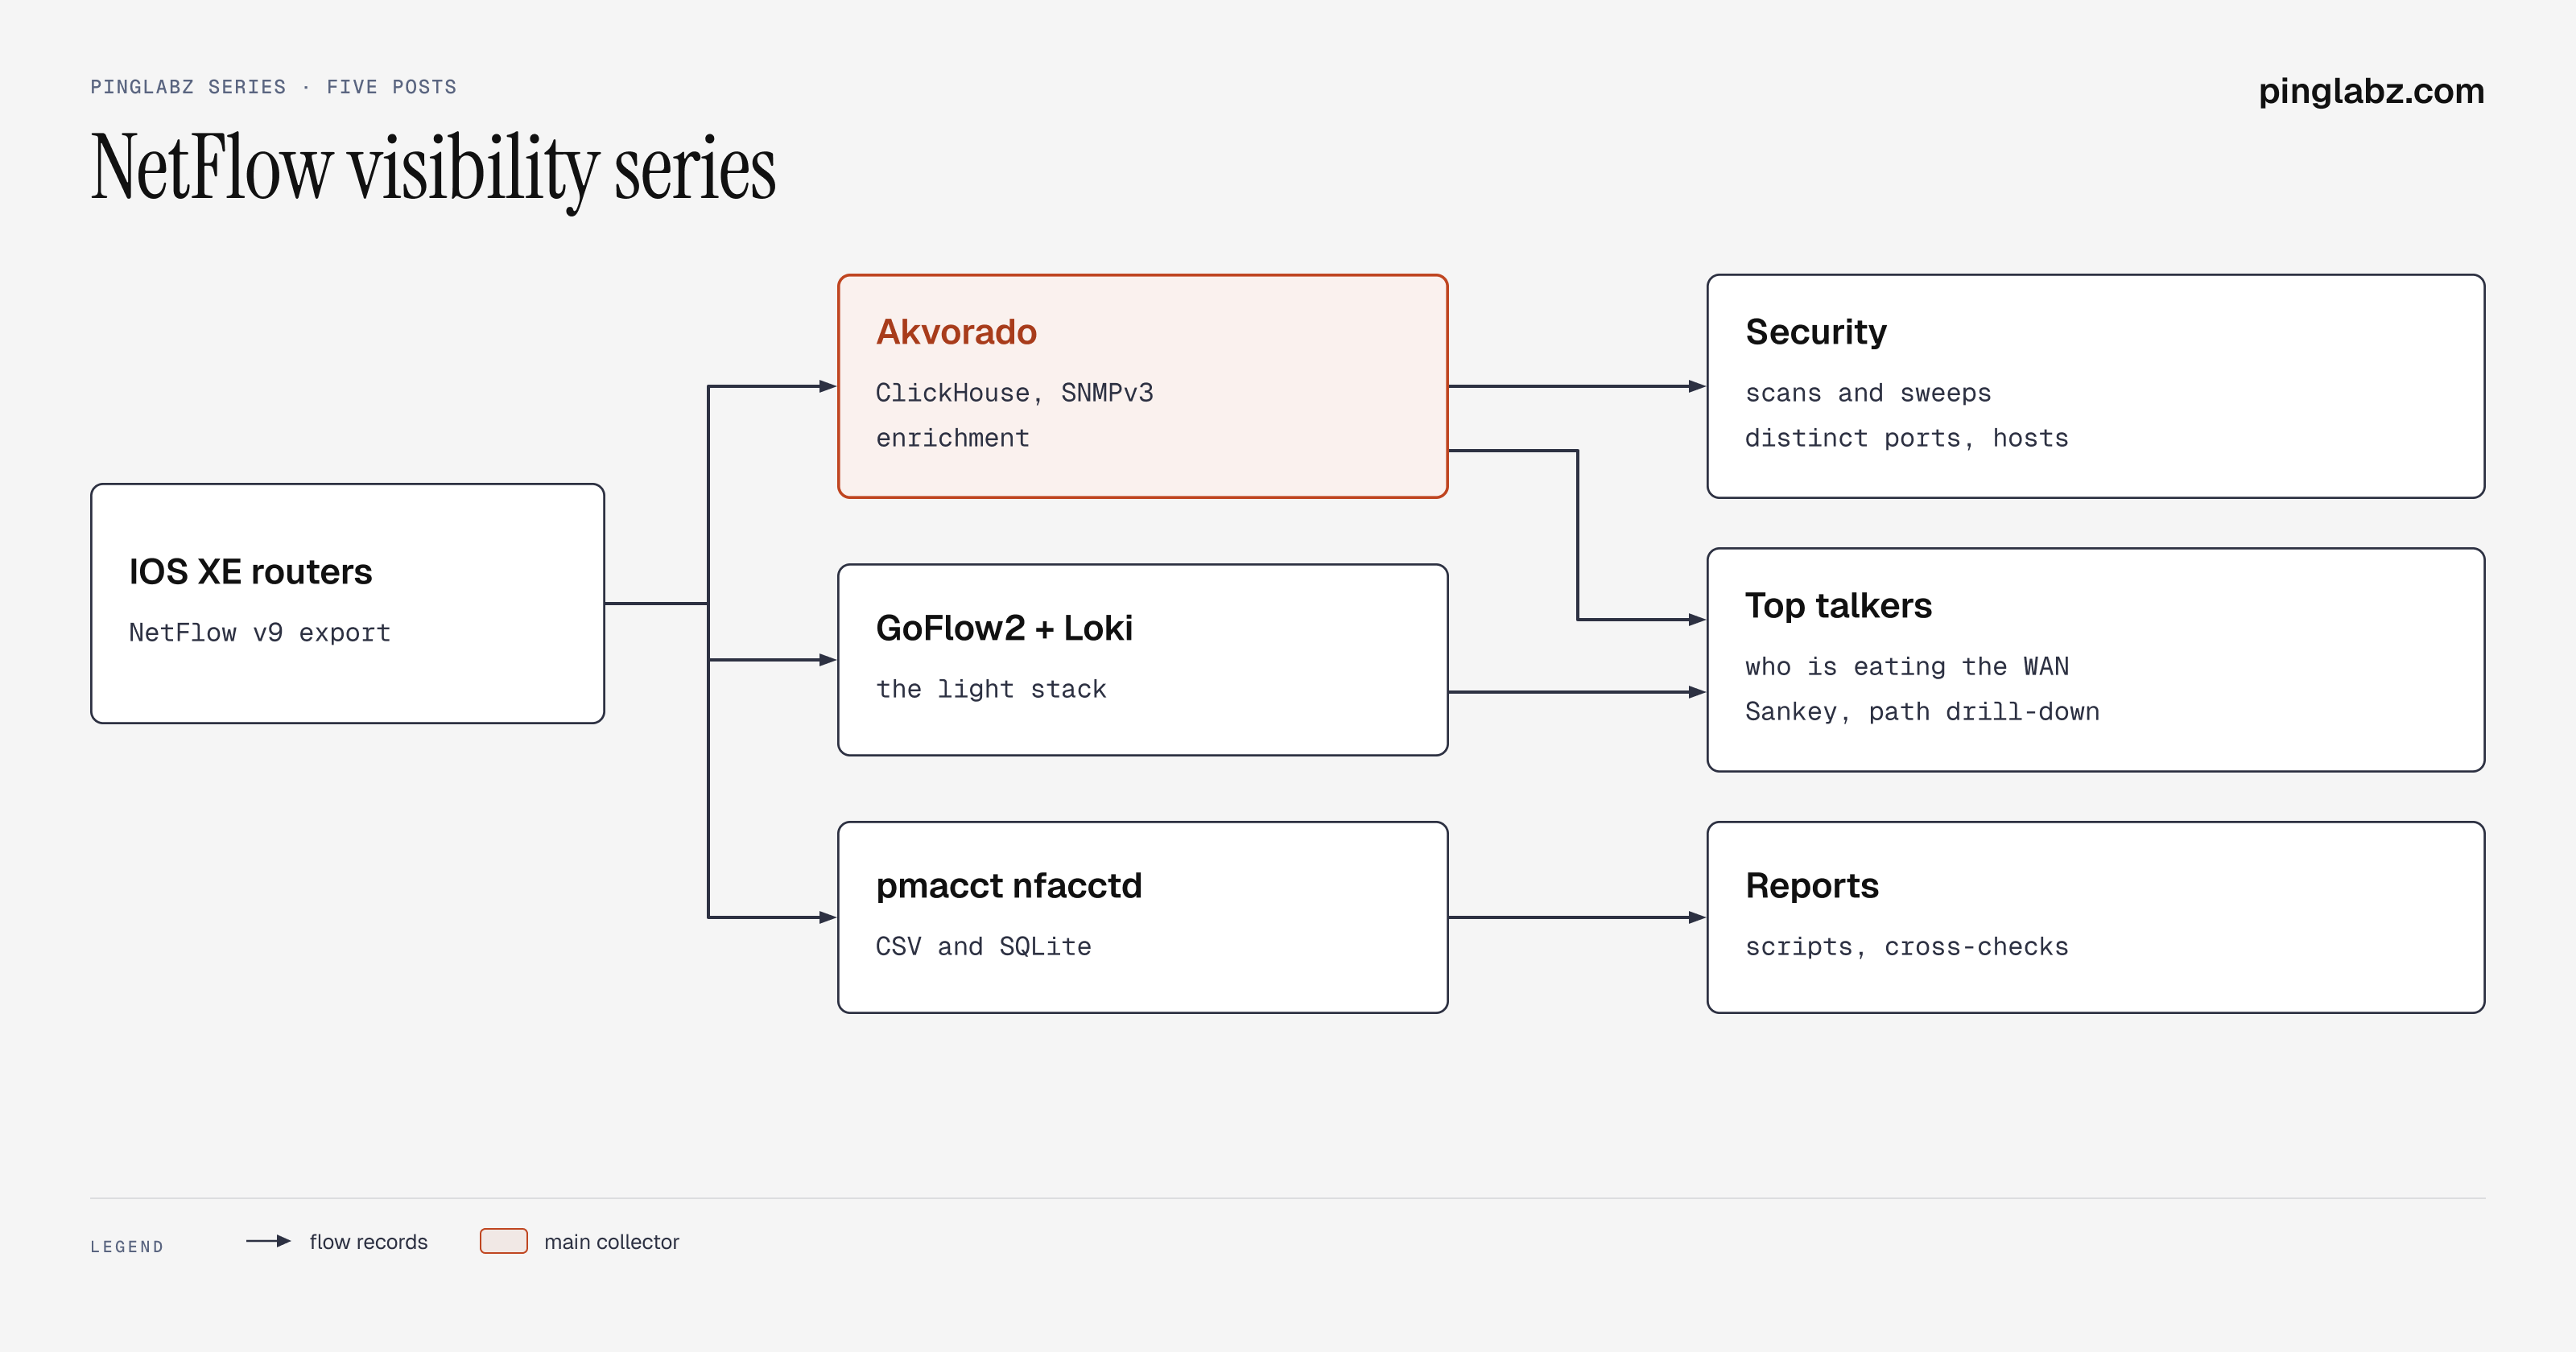
The series in reading order
- Akvorado on Cisco IOS XE: NetFlow Analytics with ClickHouse. NetFlow v9 into Akvorado with SNMPv3 enrichment, classifiers, Sankey, and the ClickHouse AVX2 fix.
- Troubleshooting with NetFlow: Who Is Eating the WAN?. Finding the host hogging a WAN link, and avoiding the double-counting trap.
- Akvorado vs GoFlow2 + Loki: Same NetFlow, Two Stacks. The same flows into two stacks: matching totals, very different memory, and where the light one runs out.
- Security from NetFlow: spotting scans and sweeps on Cisco IOS XE. Counting distinct ports and hosts per source to find scans and sweeps.
- pmacct nfacctd: NetFlow accounting to CSV and SQL on Linux. nfacctd to per-minute CSV and SQLite, cross-checked against Akvorado.
Where to start
Who this is for: engineers who already export NetFlow or IPFIX and want more than a pie chart. Start with part 1, or with part 3 if you're still choosing a collector. For flows inside Grafana, see the NetFlow post in the Grafana series.