
Flow data is usually sold as a capacity tool: who is using the WAN and when. The same records are also a cheap security sensor. A port scan, a ping sweep or a cleartext login protocol all leave a clear shape in NetFlow, even though the router never looks at a payload. I ran a scan and a sweep across two Cisco IOS XE 17.18.2 routers and looked for them in Akvorado and ClickHouse. All of it was built in my home lab, and all of the traffic is synthetic.
The collector setup is in Akvorado on Cisco IOS XE. For the bandwidth side of the same data, see Troubleshooting with NetFlow: who is eating the WAN? and Akvorado vs GoFlow2 and Loki.

The versions
- Cisco IOS XE 17.18.2 on wan-rtr1 and wan-rtr2, exporting NetFlow v9 with Flexible NetFlow on input only.
- Akvorado v2026.10.1 (AGPL-3.0) with ClickHouse 26.3 for the raw queries.
- An IOS XE access switch (acc-sw1, 10.0.10.2) behind wan-rtr1 as the target.
What I generated
From wan-rtr2's Loopback0 (10.255.0.2) a small script did two things. First it ran a ping sweep of 10.0.10.1 to 10.0.10.40. Then it made a telnet connection attempt to 10.0.10.2 on every TCP port from 1 to 120. That's a slow, noisy, old-school scan, which is fine here because the point is the shape it leaves in the flows. Normal background traffic (SSH, HTTP, NETCONF and some bulk pings) kept running the whole time.
One detail matters for reading the results. Each router only monitors input. wan-rtr2 originates the scan, so it never sees it coming in. wan-rtr1 sees the scan arrive on its WAN link, and both routers see the replies going back.
Why the graphs don't show it
The first thing I tried was the normal traffic view, filtered to the scanner:
SrcAddr = 10.255.0.2 AND Proto = 6 AND ExporterName = 'wan-rtr1.lab'Akvorado wants the protocol as a number here. Proto = TCP gives "Invalid filter expression".
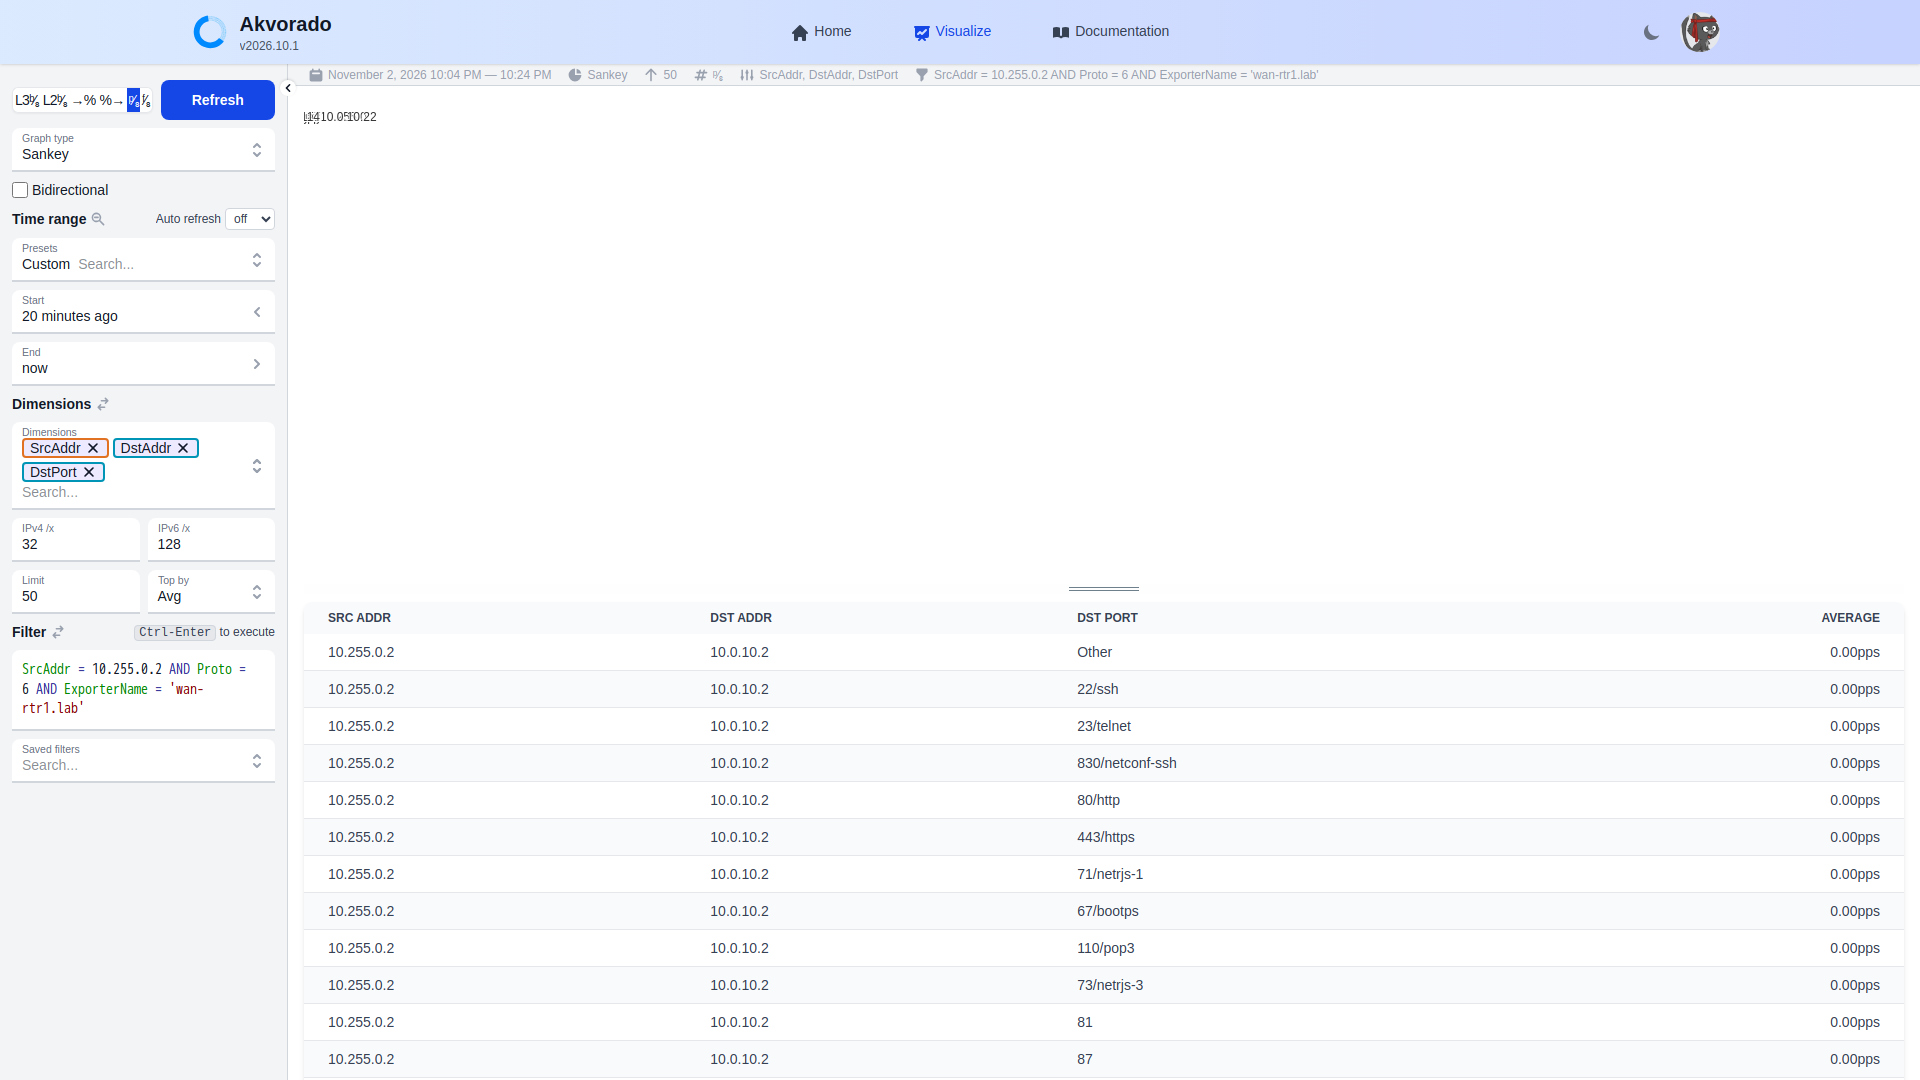
The table is the giveaway: dozens of destination ports from one source to one host. But every rate is 0.00 pps. A scan is one tiny packet per port, so in any bits-per-second or packets-per-second graph it disappears into the floor. Volume dashboards are built to find hogs, and a scan is the opposite of a hog. To find one you have to count distinct things instead of adding up bytes.
Counting distinct ports and hosts
This is the query I'd keep. It counts distinct destination ports and hosts per source over the last 12 minutes and keeps anything that touches more than 20 ports or 10 hosts:
SELECT replaceOne(toString(SrcAddr), '::ffff:', '') AS src,
       ExporterName AS exporter,
       dictGetOrDefault('protocols', 'name', Proto, '') AS proto,
       uniqExact(DstPort) AS ports,
       uniqExact(DstAddr) AS hosts,
       count() AS flows,
       sum(Packets) AS pkts,
       round(sum(Bytes) / sum(Packets)) AS avg_pkt
FROM flows
WHERE TimeReceived > now() - INTERVAL 12 MINUTE
GROUP BY src, exporter, proto
HAVING ports > 20 OR hosts > 10
ORDER BY ports DESC, hosts DESC
I run it with clickhouse-client inside the ClickHouse container. Akvorado stores IPv4 addresses as IPv4-mapped IPv6, hence the replaceOne. The output:
src         exporter      proto  ports  hosts  flows  pkts    avg_pkt
10.0.10.2   wan-rtr1.lab  TCP    144    1      145    157     41
10.0.10.2   wan-rtr2.lab  TCP    144    1      145    157     41
10.255.0.2  wan-rtr1.lab  TCP    121    1      145    177     50
10.255.0.2  wan-rtr1.lab  ICMP   2      42     108    551558  1096
Four rows, and three of them are the scan:
- 10.255.0.2 TCP, 121 ports, 1 host. That's the scan itself: ports 1 to 120 plus the background sessions. 177 packets over 145 flows is barely more than one packet per flow, with an average packet of 50 bytes. That's a SYN that got refused.
- 10.0.10.2 TCP, 144 ports, on both routers. These are the replies (RSTs from the switch). Their "destination port" is the scanner's ephemeral source port, which changes on every attempt. So the victim looks like a scanner too.
- 10.255.0.2 ICMP, 42 hosts. That's the sweep of 40 addresses plus two hosts from the background pings. The big packet count also comes from the background bulk pings, not from the sweep.
To tell the scanner from the victim, look at which side has the low, well-known ports. The scanner's destination ports are 1 to 120. The victim's destination ports are all above 1024. In a real network you'd also exclude your own monitoring servers and vulnerability scanners from the query, because they trip it every day.
Drilling into one scanner
Once you have a suspect, break it down by port:
SELECT DstPort, count() AS flows, sum(Packets) AS pkts, sum(Bytes) AS bytes
FROM flows
WHERE TimeReceived > now() - INTERVAL 12 MINUTE
  AND ExporterName = 'wan-rtr1.lab'
  AND SrcAddr = toIPv6('::ffff:10.255.0.2') AND Proto = 6
GROUP BY DstPort ORDER BY DstPort
A trimmed version of what came back:
DstPort  flows  pkts  bytes
1        1      1     52
2        1      1     52
...
21       1      1     52
22       4      36    1506
23       11     11    ...
24       1      1     52
...
80       8      8     ...
...
120      1      1     52
830      5      5     ...
Closed ports all look identical: one flow, one packet, 52 bytes. The router answered with a reset and that was it. Port 22 stands out with 36 packets and 1.5 KB across 4 flows, so it's open and something actually talked to it. Ports 23, 80 and 830 have extra flows from the background script, which connects to them on a schedule.
That gives you an open-port list for the target without touching it, which is useful for both sides.
The sweep
The ICMP sweep is easier to see visually. A Sankey of source to destination for ICMP from 10.255.0.2 fans out to every address it tried:
SrcAddr = 10.255.0.2 AND Proto = 1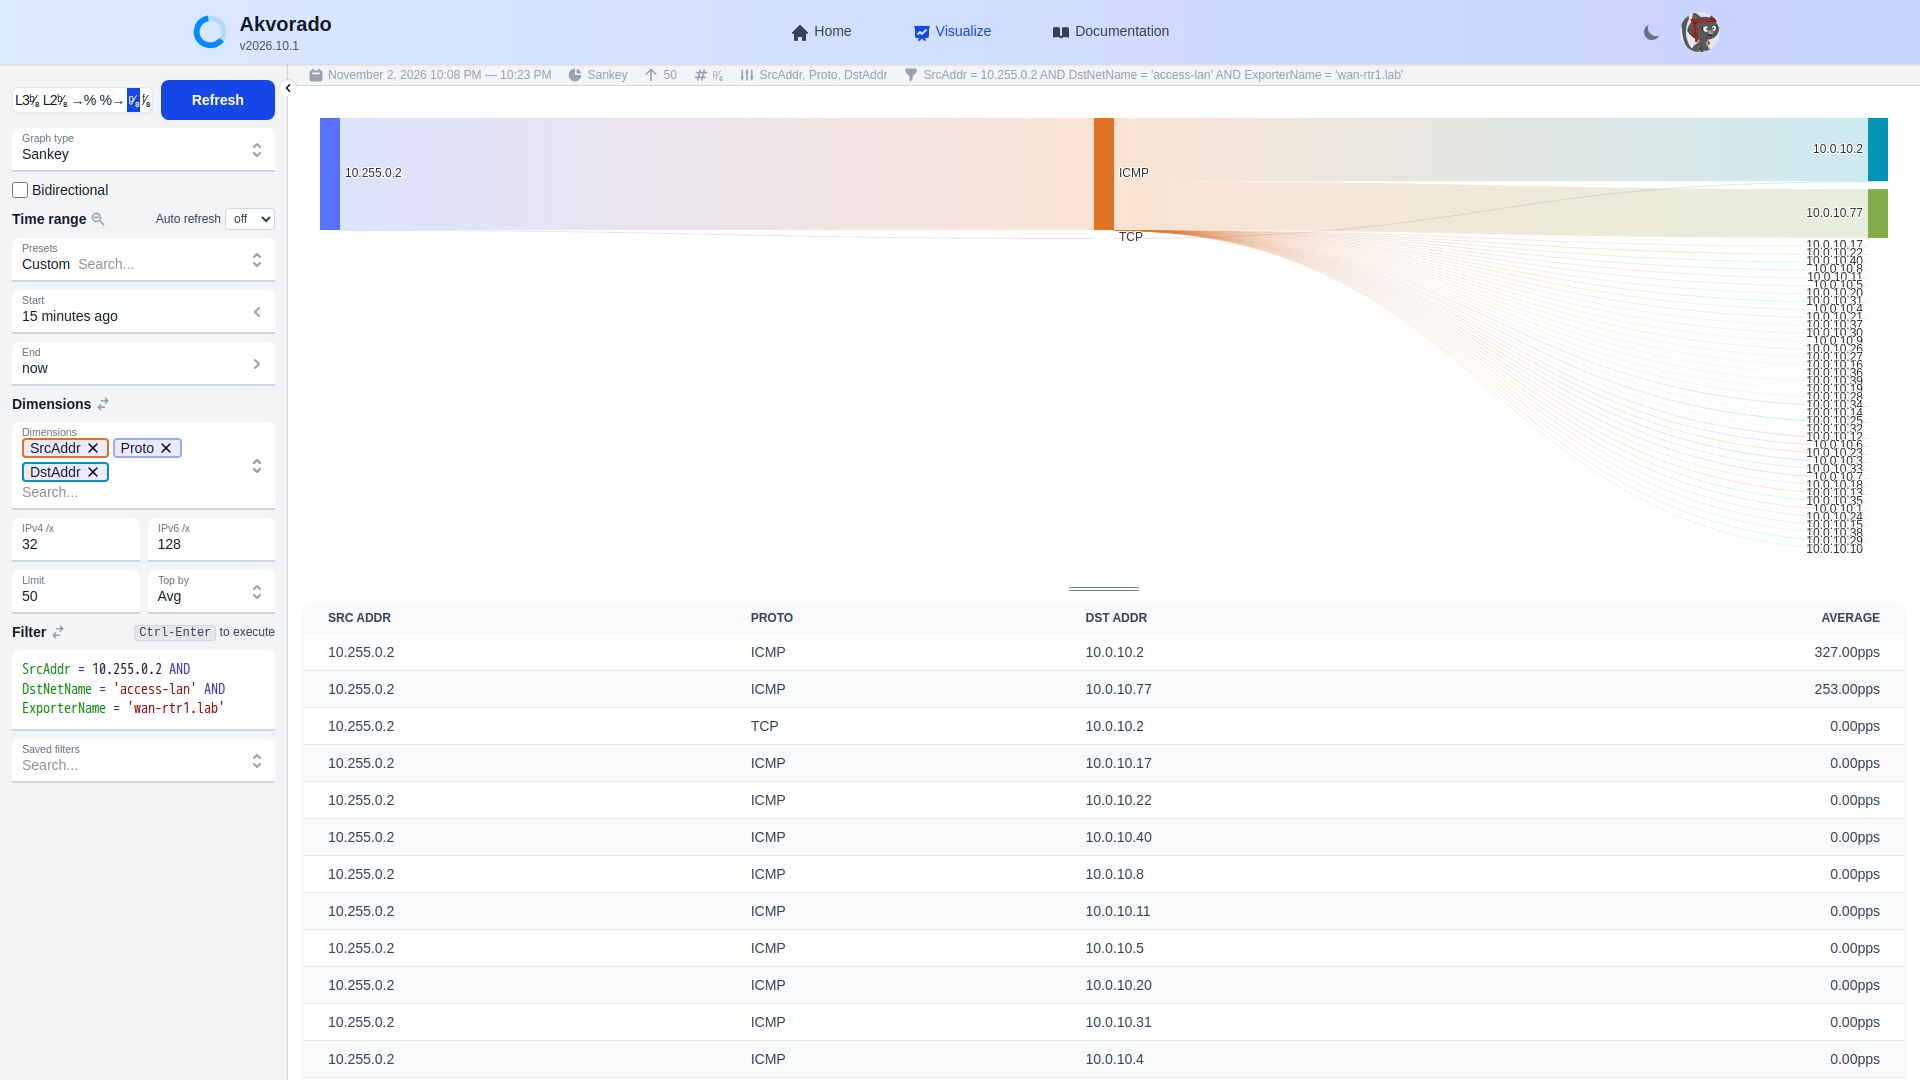
A sweep shows as one source and many destinations with roughly the same small amount of traffic each. Live hosts get an echo reply back, so you can count replies the same way to see which addresses answered.
Cleartext protocols are a finding too
The port breakdown turned up flows to TCP 23 (telnet) and 80 (HTTP) on a network device. Here that's my own background script, but in a real network any steady flow to port 23 on a router or switch is worth a ticket. Telnet sends the login in clear text. A quick check is to filter on DstPort = 23 across all exporters and list the sources.
What flow data can't do
- It can't see payload. You know a connection happened, not what was said. This isn't an IDS.
- Akvorado doesn't store TCP flags by default, so you can't directly tell a SYN-only flow from a full session. Tiny packets and one-packet flows are the stand-in.
- With input-only monitoring, the router that originates traffic doesn't see it. Pick your monitoring points with that in mind.
- Sampling would make a slow scan nearly invisible. These routers export every packet, so every probe showed up.
- The flow export timers add delay. This is for finding things within minutes, not blocking them.
For router-side configuration see Flexible NetFlow on Cisco IOS XE, and NetFlow versions compared if you're choosing between v9 and IPFIX. To graph flows in Grafana, see NetFlow and IPFIX in Grafana.
Next in this series: I skipped ntopng because collecting NetFlow needs the commercial nProbe. Now live instead: pmacct nfacctd: NetFlow accounting to CSV and SQL.