
Not every flow question needs a dashboard. Sometimes you just want to know how many bytes each host sent per minute, written to a file or a SQL table you can query later. That's what pmacct is for. Its NetFlow daemon, nfacctd, aggregates flows on the keys you choose and writes the result to CSV, SQLite, MySQL, PostgreSQL or Kafka. I pointed the same two Cisco IOS XE 17.18.2 routers at it, next to Akvorado, and compared the numbers. All of it was built in my home lab, and the traffic is synthetic.
The earlier posts in this series cover Akvorado on Cisco IOS XE and Akvorado vs GoFlow2 and Loki.

Why not ntopng?
I planned an ntopng post for this slot. ntopng Community (v7.1, GPL-3.0) is free, but it can't receive NetFlow by itself. Router exports have to go through nProbe, which is a commercial product (Pro starts at €299.95). That breaks the free-tools rule of this series, so I left it out. If you already own nProbe, ntopng is worth a look.
The versions
- pmacct nfacctd 1.8.0-git (build 20260109, commit 77fd693a) from the
pmacct/nfacctd:latestimage. The latest tagged release is 1.7.9. pmacct is GPL-2.0. - SQLite 3.46.1, built into that image.
- Cisco IOS XE 17.18.2 on wan-rtr1 and wan-rtr2, NetFlow v9, input only.
- Akvorado v2026.10.1 with ClickHouse 26.3 for the cross-check.
A third exporter on the routers
Each router already exports to Akvorado and GoFlow2. Flexible NetFlow lets one monitor send to several exporters, so pmacct just gets another one:
flow exporter PMA-EXP
 destination 10.66.20.50
 source Ethernet0/0
 transport udp 2055
 template data timeout 60
 option interface-table
!
flow monitor AKV-MON
 exporter PMA-EXP
On my routers the destination sits in a management VRF, so the real line ends with vrf <MGMT-VRF>. The monitor is already on the WAN interfaces, so nothing else changes.
The nfacctd config
One daemon, three plugins. Each plugin aggregates on its own keys and writes somewhere different:
daemonize: false
nfacctd_port: 2055
nfacctd_ip: 0.0.0.0
plugins: memory[mem], print[csv], sqlite3[db]

aggregate[mem]: peer_src_ip, src_host, dst_host, proto, dst_port
imt_path[mem]: /var/pmacct/mem.pipe

aggregate[csv]: peer_src_ip, src_host, dst_host, proto, dst_port
print_output[csv]: csv
print_output_file[csv]: /var/pmacct/out/flows-%Y%m%d-%H%M.csv
print_refresh_time[csv]: 60
print_history[csv]: 1m
print_history_roundoff[csv]: m

aggregate[db]: peer_src_ip, src_host, dst_host, proto, dst_port
sql_db[db]: /var/pmacct/pmacct.db
sql_table[db]: acct
sql_optimize_clauses[db]: true
sql_refresh_time[db]: 60
sql_history[db]: 1m
sql_history_roundoff[db]: m
sql_num_protos[db]: true- memory keeps a running table you can query live with the
pmacctclient. - print writes one CSV per minute.
- sqlite3 writes one row per key per minute into a table.
peer_src_ip is the exporter's address, so you can tell wan-rtr1 (10.66.20.11) from wan-rtr2 (10.66.20.12). I ran it as a container with the config and output directory mounted at /var/pmacct.
The table schema
With sql_optimize_clauses on, nfacctd only writes the columns that match your aggregate, and you create the table yourself. My first attempt used the old column name port_dst, and the log filled with no such column: dst_port. Current builds want dst_port:
CREATE TABLE acct (
  peer_ip_src CHAR(15) NOT NULL DEFAULT '0.0.0.0',
  ip_src CHAR(45) NOT NULL DEFAULT '0.0.0.0',
  ip_dst CHAR(45) NOT NULL DEFAULT '0.0.0.0',
  ip_proto INT NOT NULL DEFAULT 0,
  dst_port INT NOT NULL DEFAULT 0,
  packets INT NOT NULL,
  bytes BIGINT NOT NULL,
  stamp_inserted DATETIME NOT NULL DEFAULT '0000-00-00 00:00:00',
  stamp_updated DATETIME,
  PRIMARY KEY (peer_ip_src, ip_src, ip_dst, ip_proto, dst_port, stamp_inserted)
);
Live view and CSV
The memory plugin answers straight away. The bandwidth-hog test from the top-talkers post was running, and 10.0.10.77 is at the top on both routers:
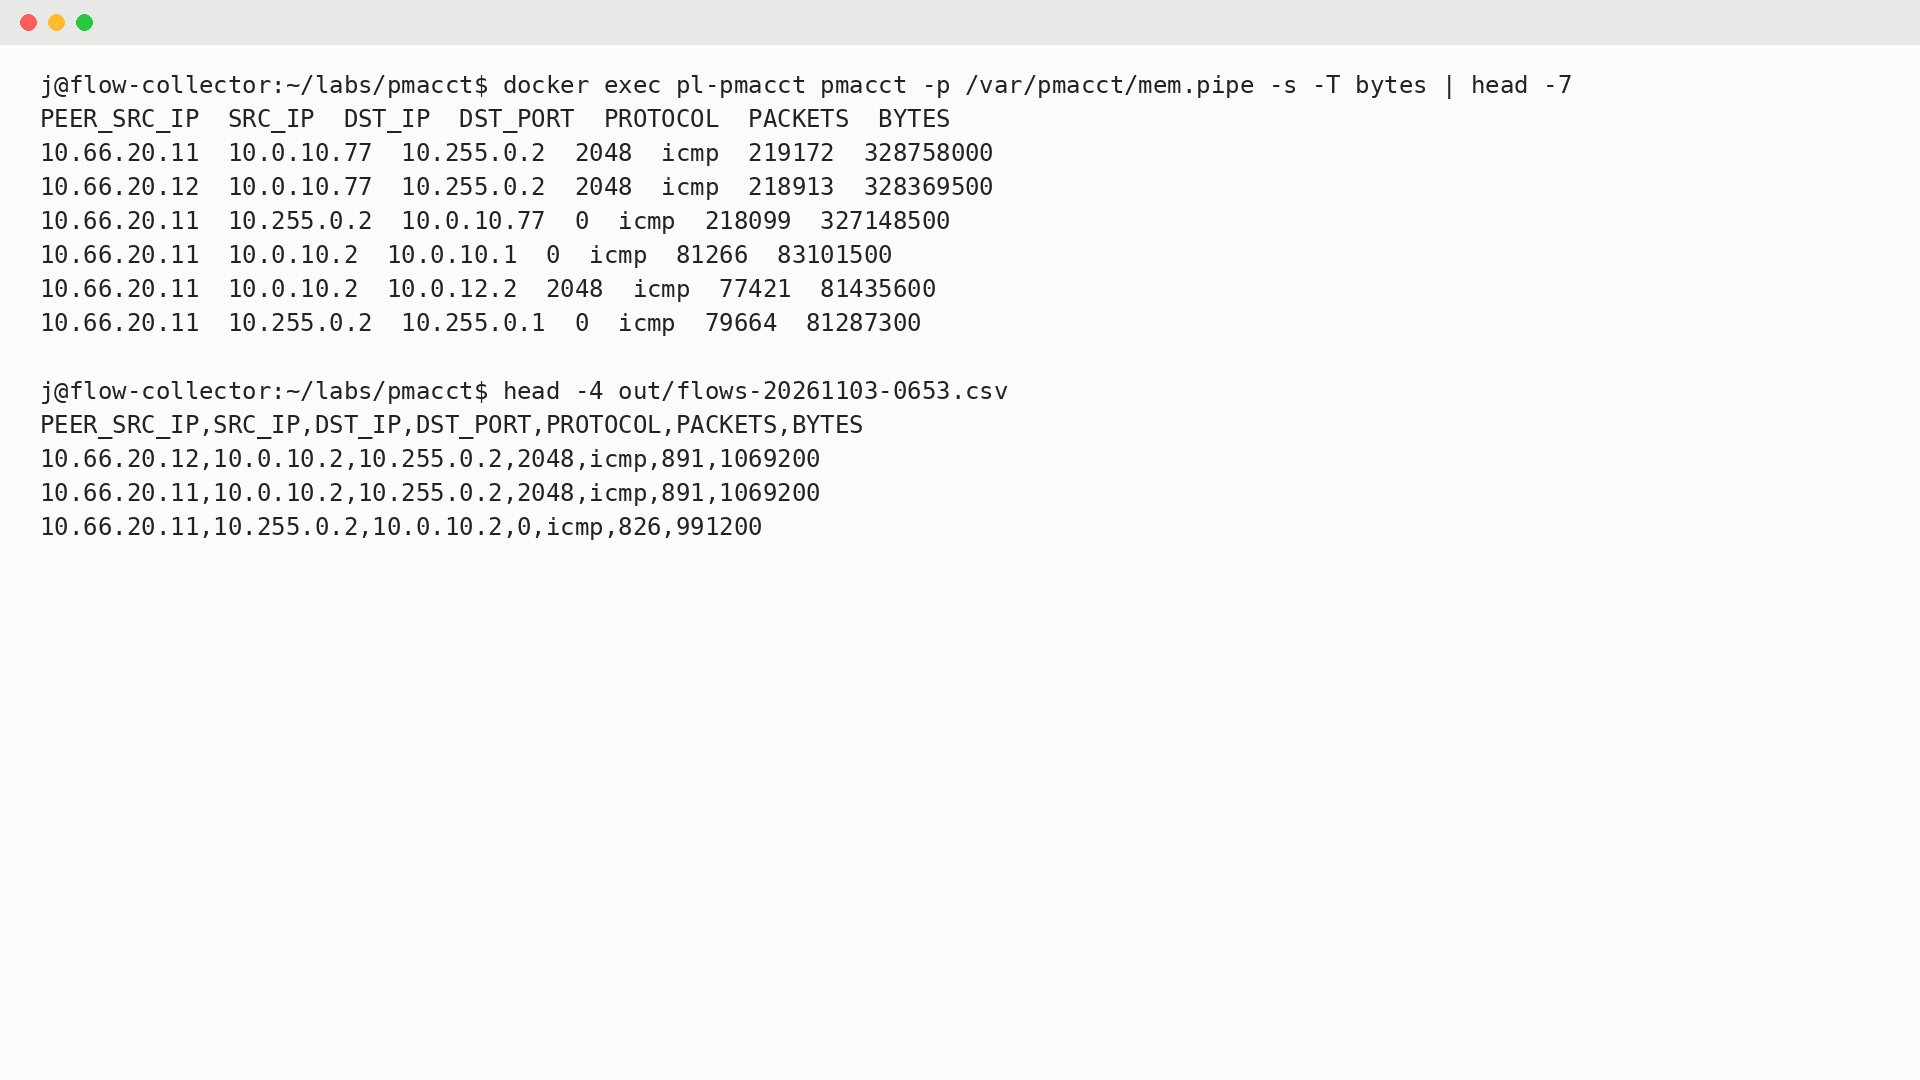
PEER_SRC_IP  SRC_IP      DST_IP      DST_PORT  PROTOCOL  PACKETS  BYTES
10.66.20.11  10.0.10.77  10.255.0.2  2048      icmp      219172   328758000
10.66.20.12  10.0.10.77  10.255.0.2  2048      icmp      218913   328369500
10.66.20.11  10.255.0.2  10.0.10.77  0         icmp      218099   327148500
The "port" for ICMP is type times 256 plus code, so 2048 is an echo request and 0 is an echo reply. The same flow shows on both routers because each one monitors its own input.
Querying the SQL table
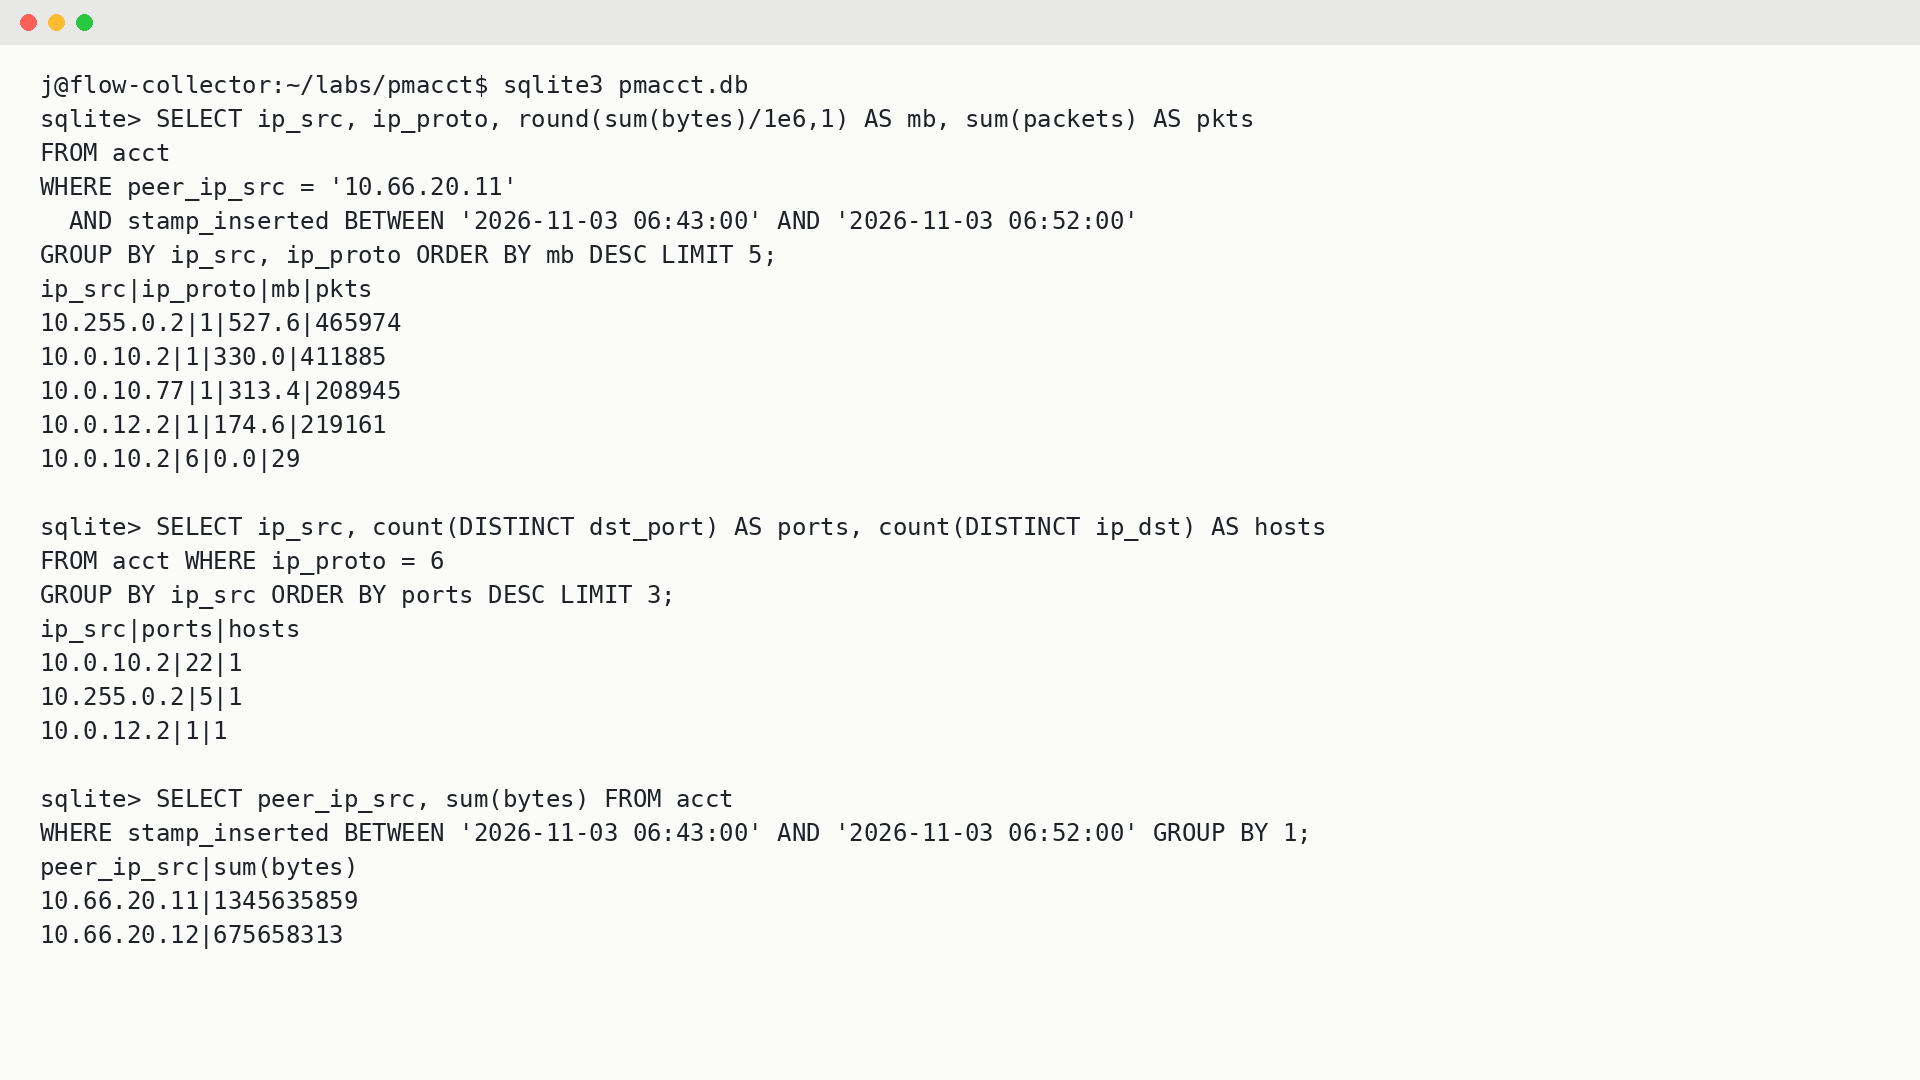
Top sources seen by wan-rtr1 over ten one-minute bins:
SELECT ip_src, ip_proto, round(sum(bytes)/1e6,1) AS mb, sum(packets) AS pkts
FROM acct
WHERE peer_ip_src = '10.66.20.11'
  AND stamp_inserted BETWEEN '2026-11-03 06:43:00' AND '2026-11-03 06:52:00'
GROUP BY ip_src, ip_proto ORDER BY mb DESC LIMIT 5;

ip_src|ip_proto|mb|pkts
10.255.0.2|1|527.6|465974
10.0.10.2|1|330.0|411885
10.0.10.77|1|313.4|208945
10.0.12.2|1|174.6|219161
10.0.10.2|6|0.0|29
The scan trick from the security post works here too: count distinct ports per source. This window had no scan running, so the top answer is 22 ports from 10.0.10.2. Those are reply ports going back to the background sessions, not an attack.
Does it agree with Akvorado?
Total bytes per exporter, same ten minutes:
| Exporter | pmacct (SQLite) | Akvorado (ClickHouse) | Diff |
|---|---|---|---|
| wan-rtr1 | 1,345,635,859 | 1,368,208,789 | 1.7% |
| wan-rtr2 | 675,658,313 | 712,760,853 | 5.2% |
Close, but not to the byte like the GoFlow2 comparison. pmacct puts each flow into a time bin with its own logic, and I filtered Akvorado on TimeReceived, so flows near the window edges land on different sides. This IOS XE image's 1800-second active timeout makes that worse, because one flow record can carry minutes of traffic. Over the whole run the two would converge. For per-minute billing-style numbers, keep the export timers short.
Where pmacct fits
- Good at: lean, scriptable accounting. One small daemon, plain files or SQL out, and you pick the keys. It also does BGP and BMP correlation if you need per-AS or per-prefix numbers.
- Not good at: exploring. There's no UI, so you write the queries. Anything you didn't put in the aggregate is gone.
- Watch out for: pick your aggregate carefully.
src_host, dst_host, dst_porton a busy link creates a lot of rows. SQLite is fine in a lab; use PostgreSQL or Kafka for real volume.
The flow series
That's the end of this run of posts. The full set, in order:
- NetFlow versions compared
- Flexible NetFlow on Cisco IOS XE
- NetFlow and IPFIX in Grafana
- Akvorado on Cisco IOS XE
- Troubleshooting with NetFlow: who is eating the WAN?
- Akvorado vs GoFlow2 and Loki
- Security from NetFlow: spotting scans and sweeps
Now live: Oxidized: automatic IOS XE config backups to Git, the first post in a new open-source config and change-control series.