
"The WAN is slow" is the ticket everyone gets. SNMP tells you the link is busy. It can't tell you who is making it busy. Flow data can, and with a decent flow tool you can get from the complaint to an IP address, a protocol and a pair of interfaces in a few minutes. This post walks through that hunt using Akvorado v2026.10.1 fed by NetFlow v9 from two Cisco IOS XE 17.18.2 routers. All of it was built in my home lab.
The collector setup is in the previous post, Akvorado on Cisco IOS XE. If you need the router side first, see Flexible NetFlow on Cisco IOS XE. For a lighter option without a dedicated flow tool, see NetFlow and IPFIX in Grafana.

The setup, and an honest note about the traffic
The topology is small. An access switch, acc-sw1, holds the user LAN, 10.0.10.0/24. It hangs off wan-rtr1 (AS 65001), which has a WAN link to wan-rtr2 (AS 65002). Both routers export flows for ingress traffic on their WAN and access interfaces.
The traffic is synthetic. Background load comes from scripts that run bursts of pings with random sizes between the LAN, the routers' loopbacks and the WAN link. Separate scripts also open TCP connections to a few ports. To play the bandwidth hog, I added a secondary address on the switch, 10.0.10.77, and had it send 1500-byte pings to wan-rtr2's loopback, 10.255.0.2. Each ping run lasts 40 seconds, with a 17-second pause between runs. That's not a backup job or a video call, but the hunt looks the same either way. You find a source, then a destination, a protocol and a path.
The pauses matter. This IOS XE image has no cache timeout command under the flow monitor, so the defaults apply: a 1800-second active timeout and a 15-second inactive timeout. A flow that never goes idle wouldn't be exported for half an hour. The 17-second gap lets each run expire and be exported.
Step 1: confirm the link is actually busy
Start where the ticket starts. The interface counters on wan-rtr1's WAN link:
wan-rtr1#show interfaces Ethernet0/1 | include rate
  Queueing strategy: fifo
  5 minute input rate 8597000 bits/sec, 1052 packets/sec
  5 minute output rate 8608000 bits/sec, 1052 packets/sec
About 8.6 Mbps each way. Whether that's a problem depends on the circuit, but it's the number SNMP graphs show, and it says nothing about who is sending it.
Step 2: top talkers leaving the site
In Akvorado's Visualize page, set the dimension to SrcAddr and filter on traffic leaving through an external interface:
OutIfBoundary = externalThe "external" boundary comes from the interface classifier in the outlet config from the previous post. Any interface whose description starts with "to wan" is marked external. If your interface descriptions are a mess, this is where you pay for it.
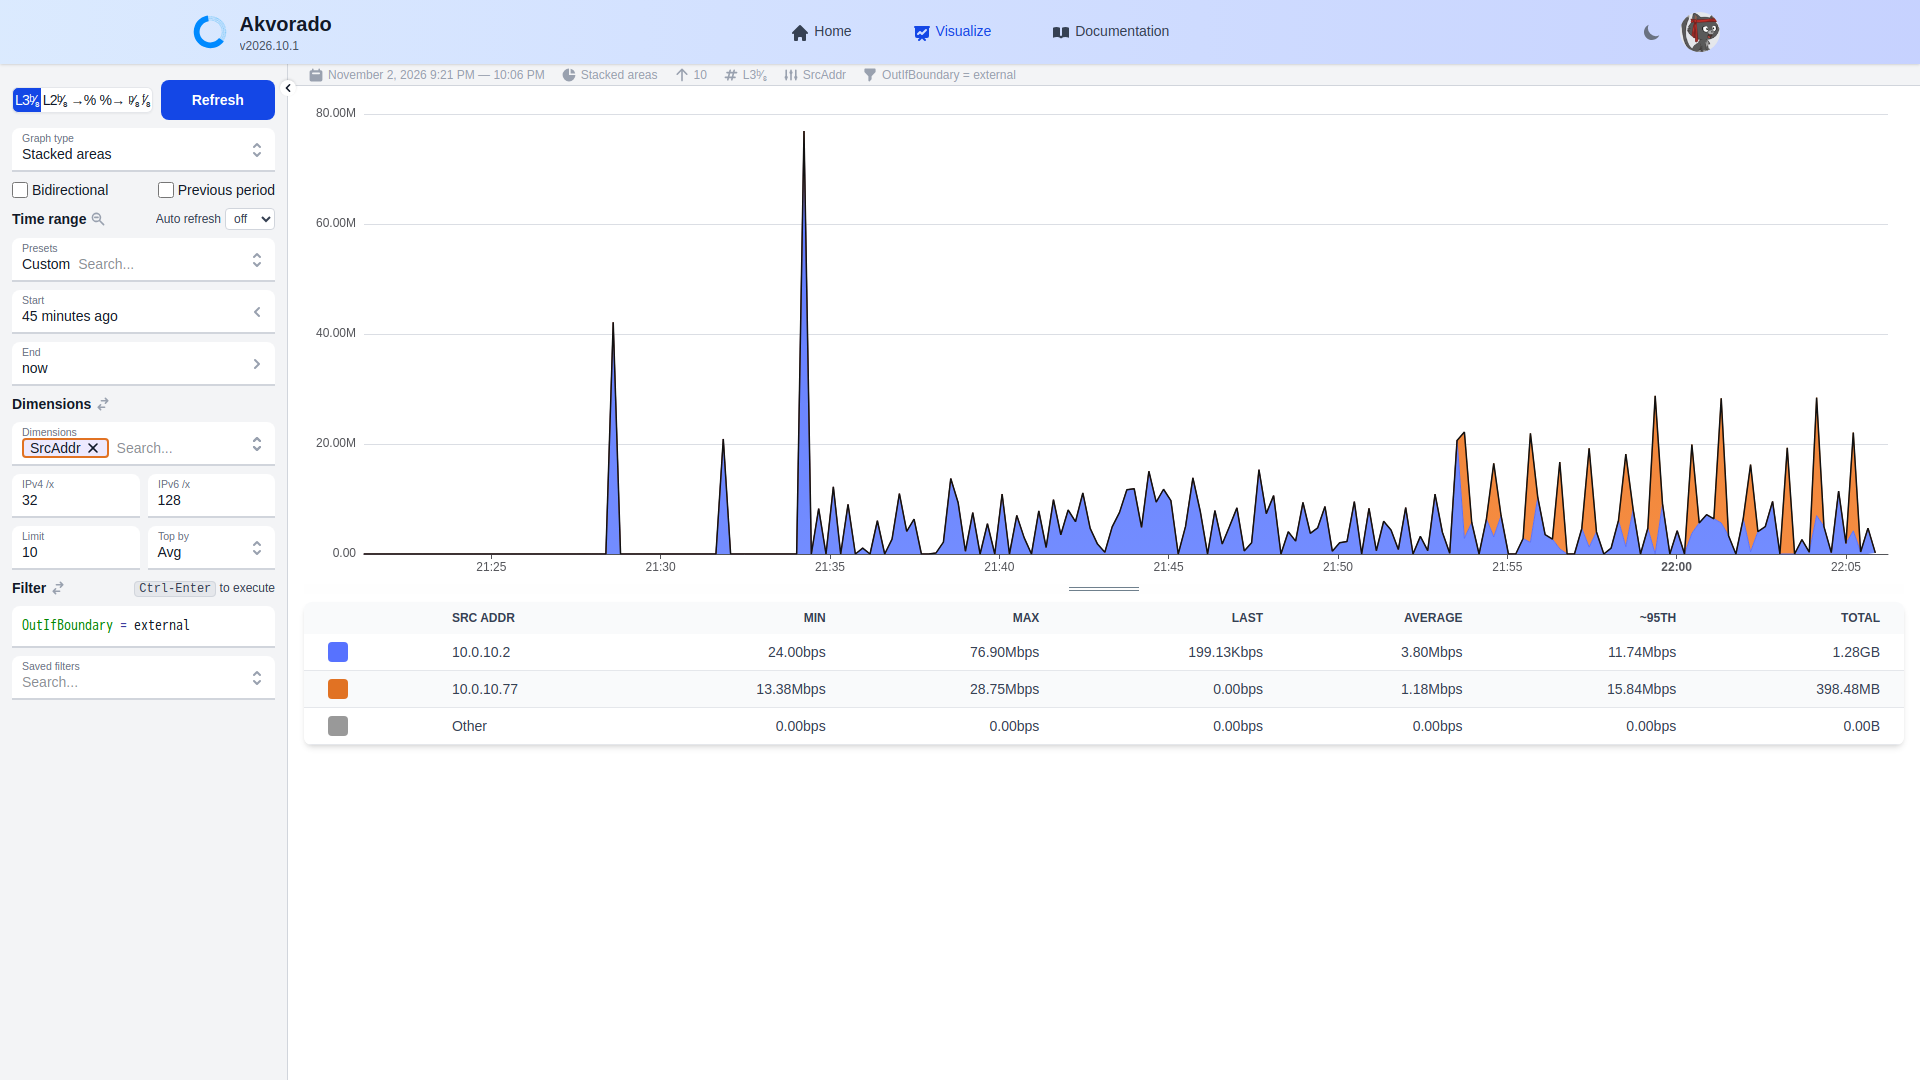
Two things stand out. 10.0.10.2 is the regular background traffic. 10.0.10.77 appears at 21:54 and at its peaks matches or beats everything else. The early spikes around 21:28 and 21:34 are from an earlier test with long ping runs, before I added the pauses.
Read the peaks with care. A flow record covers the whole 40-second run, and Akvorado places it on the graph at the time it was received. So 40 seconds of bytes lands in one short bucket, and the peak (28.75 Mbps for 10.0.10.77) overstates the real rate. The router's cache shows about 25.7 MB over 40 seconds, which works out to roughly 5 Mbps. Shorter active timeouts fix this on platforms that support them. Akvorado's docs suggest 10 seconds.
Step 3: where is it going?
A Sankey diagram answers "from where to where" in one picture. Use the dimensions SrcNetName, SrcAddr and DstAddr with the same filter, over the last 15 minutes:
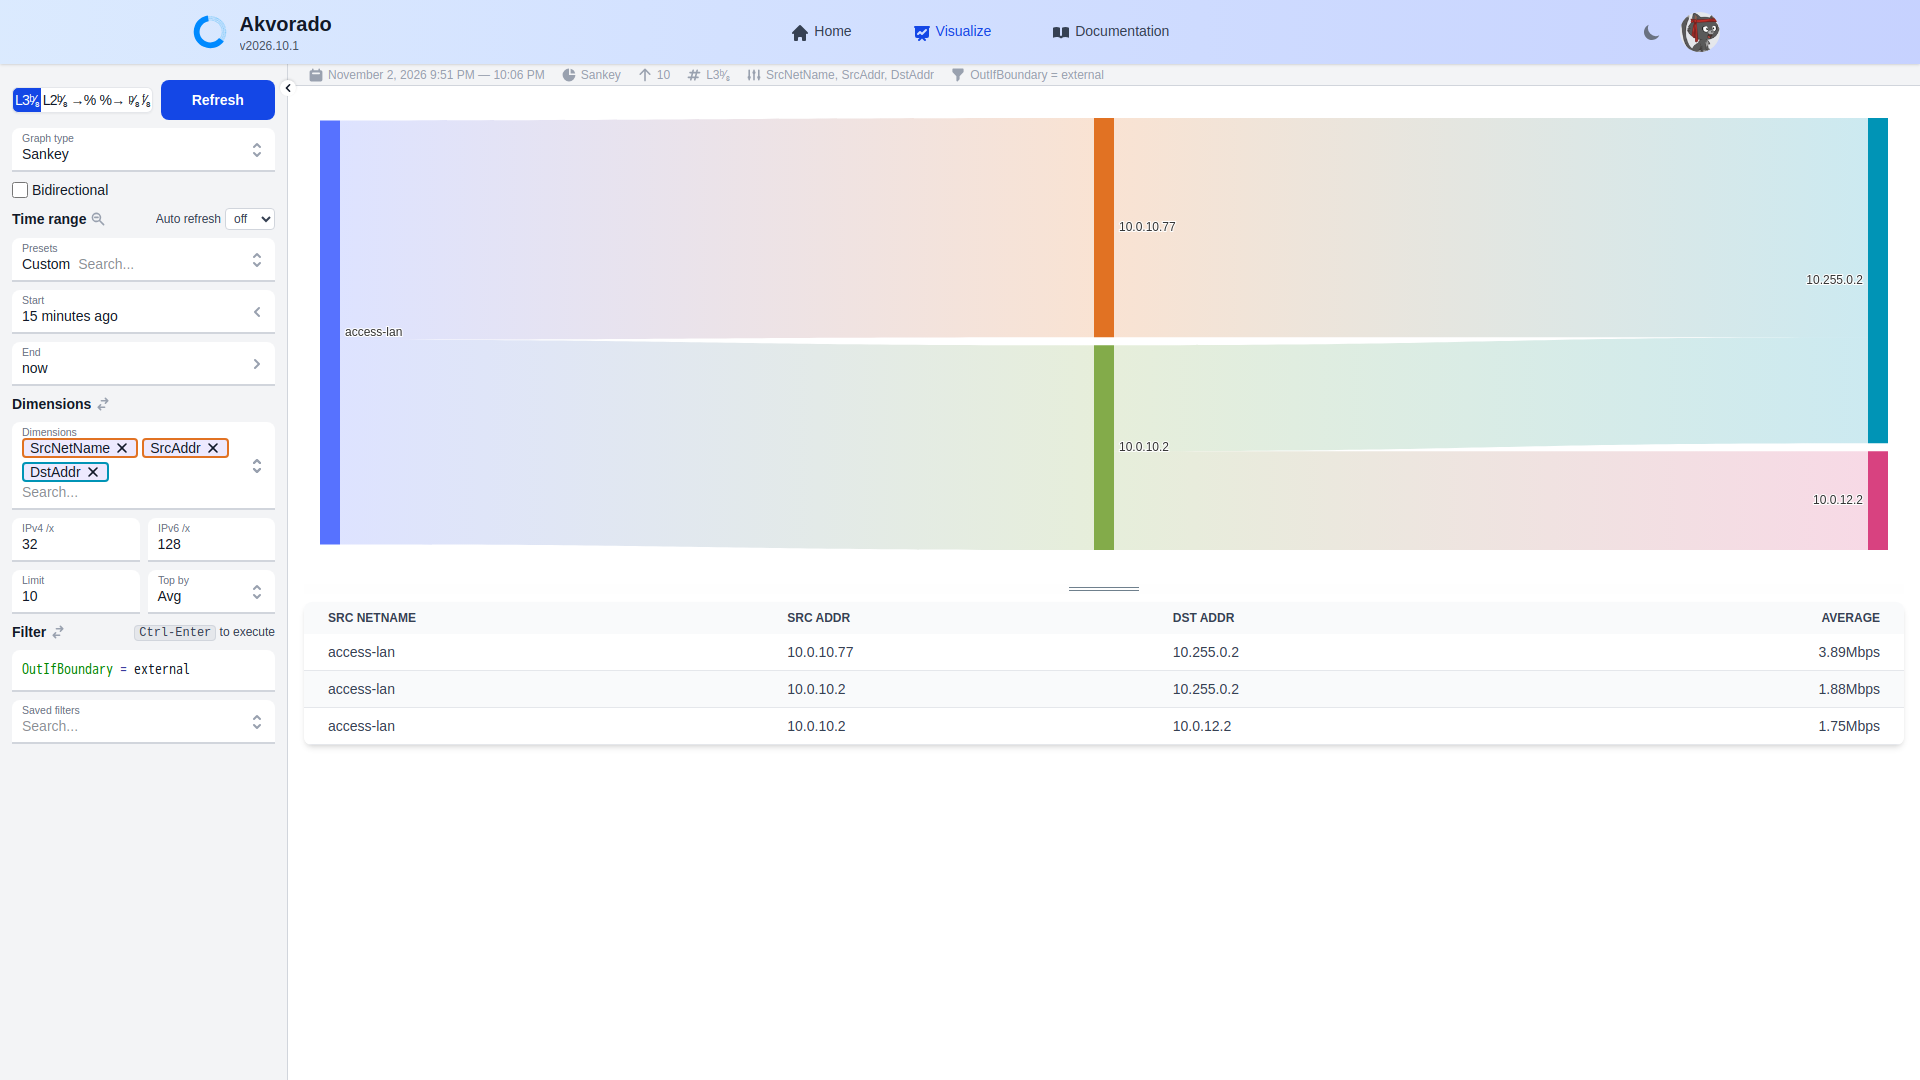
The answer is clear: 10.0.10.77 to 10.255.0.2, averaging 3.89 Mbps over the window. That's more than the next two pairs put together. The "access-lan" label is the network name from the outlet config, so the first column tells you which site or segment the traffic came from before you look at a single address.
Step 4: which path, and what protocol?
Now filter on the suspect and look at the path. Set the dimensions to ExporterName, InIfName and OutIfName:
SrcAddr = 10.0.10.77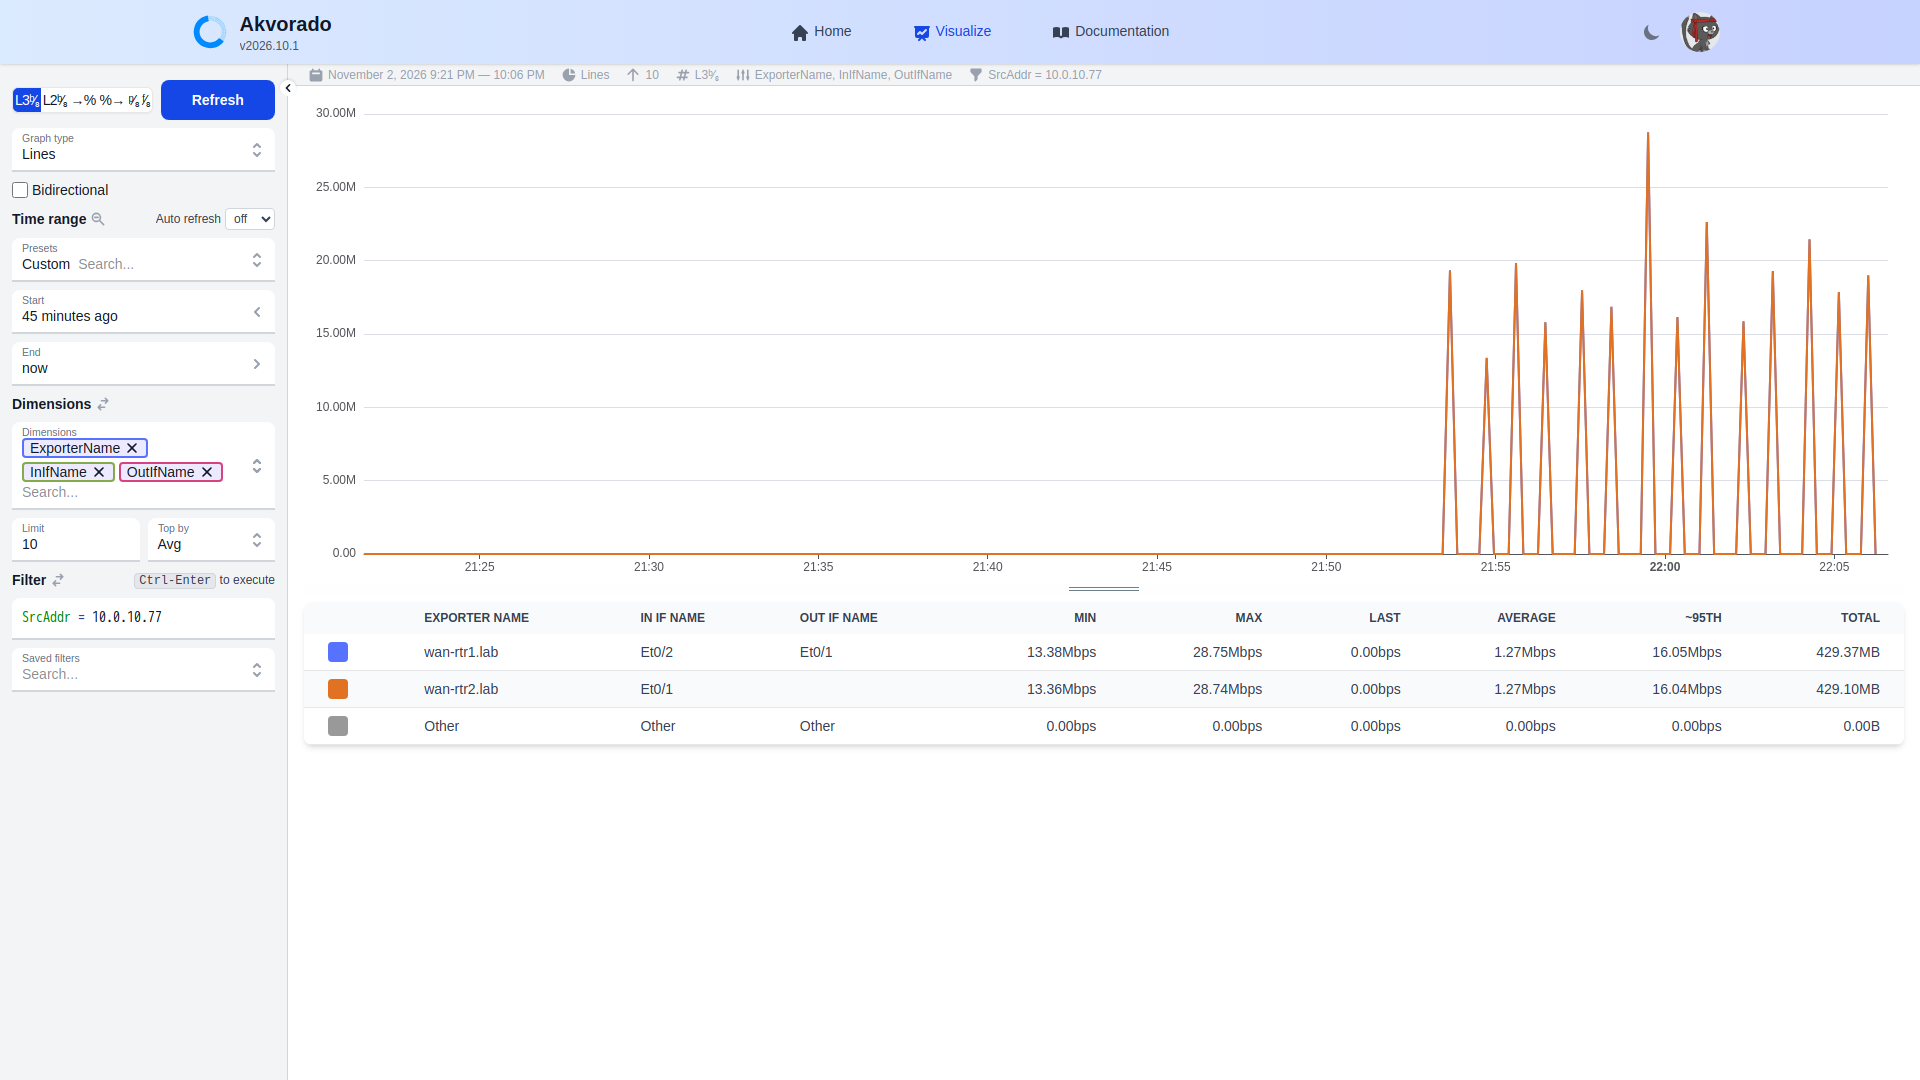
wan-rtr1 sees it come in on Et0/2 (from the access switch) and leave on Et0/1 (the WAN). wan-rtr2 sees it come in on Et0/1 with an empty output interface. That's not a bug. The destination is wan-rtr2's own loopback, so the traffic is delivered to the router itself and never leaves an interface.
Then switch the dimensions to Proto and DstAddr and match both directions:
SrcAddr = 10.0.10.77 OR DstAddr = 10.0.10.77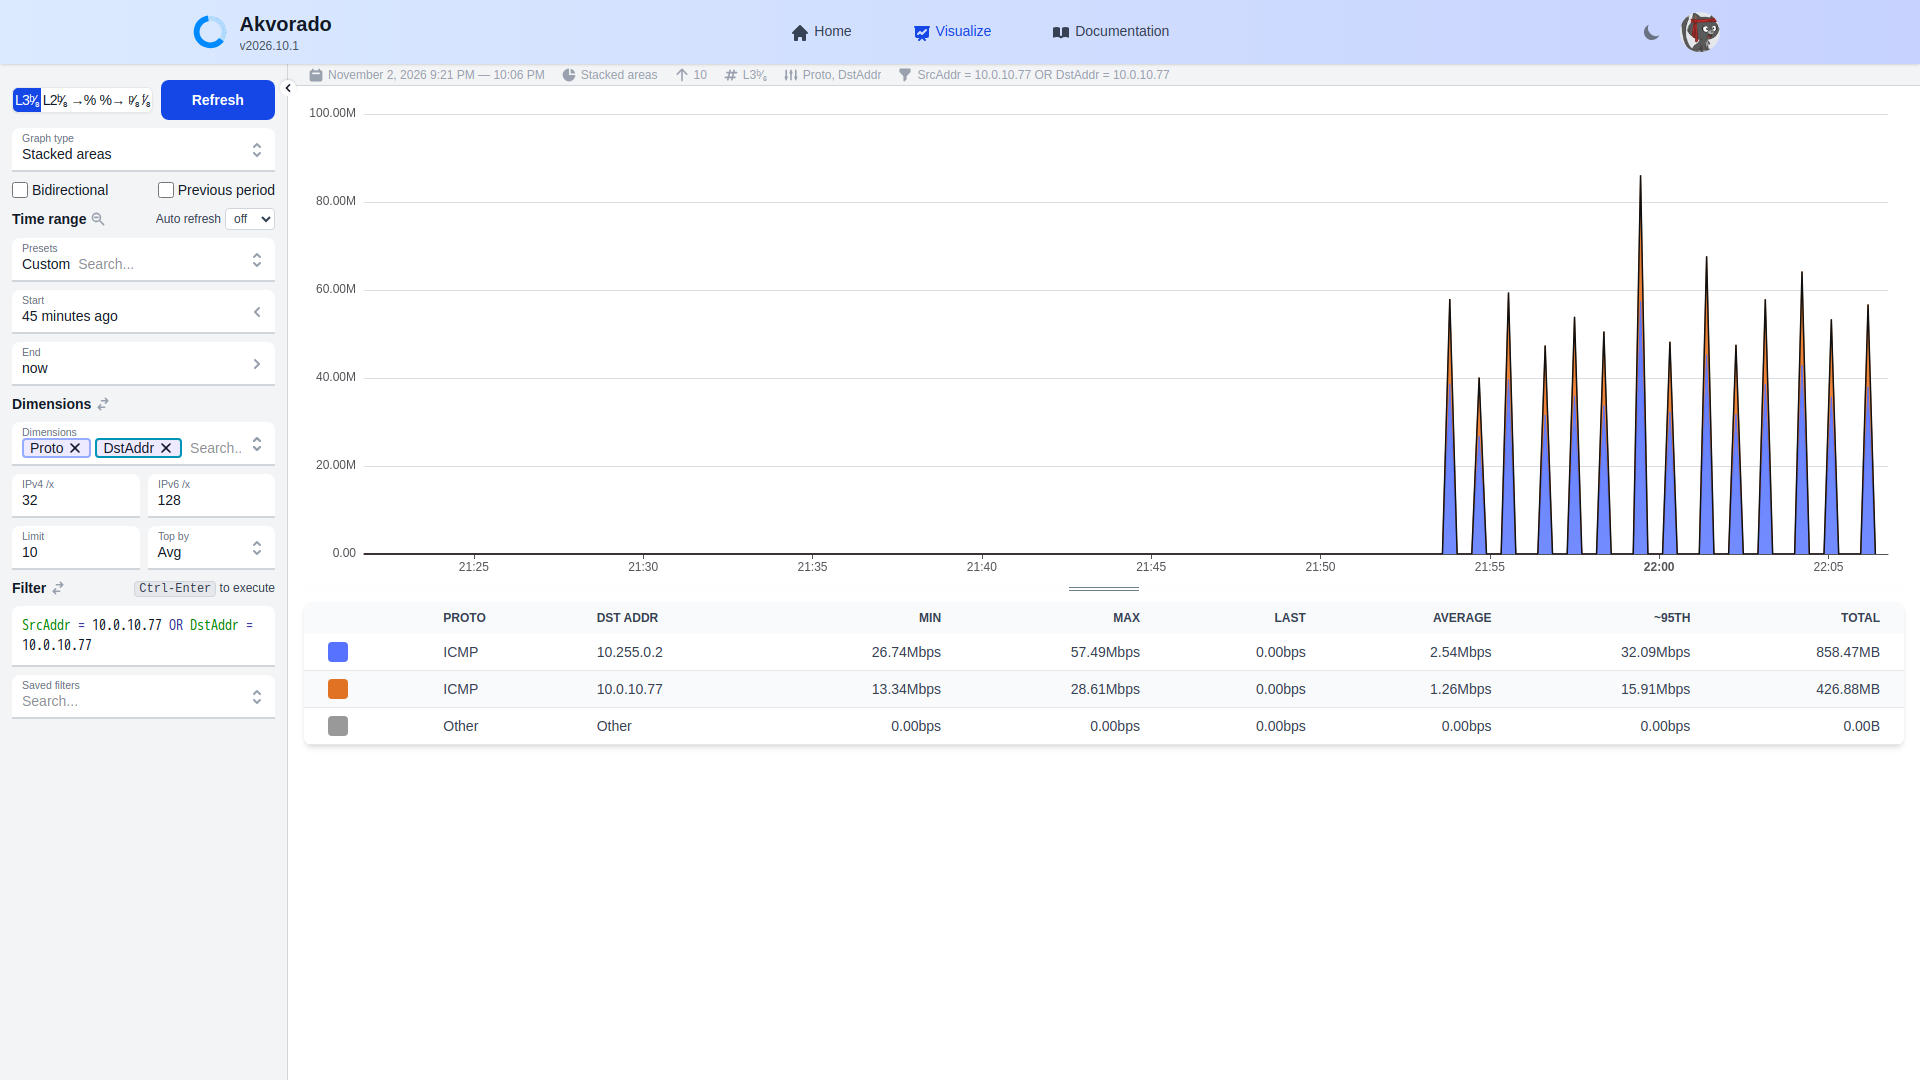
It's all ICMP. The numbers also show the most common flow-analysis mistake. ICMP to 10.255.0.2 totals 858 MB, about twice the 429 MB each router saw on its own. Both routers export the same packets, so a query across all exporters counts them twice. The return traffic is only 427 MB because the replies come from wan-rtr2's loopback. wan-rtr2 didn't receive them on a monitored interface, so only wan-rtr1 exported them, on the way in.
The fix is to pick one exporter or one boundary per question. For "what crossed the WAN", filter on one router's WAN interface, or add ExporterName = 'wan-rtr1.lab'.
Step 5: confirm on the router
Before you call someone about their traffic, check the router itself. The flow cache can sort by bytes:
wan-rtr1#show flow monitor AKV-MON cache sort highest counter bytes long top 5 format table
Processed 12 flows
Aggregated to 12 flows
Showing the top 5 flows

IPV4 SRC ADDR    IPV4 DST ADDR    TRNS DST PORT  INTF INPUT  IP PROT  intf output  bytes long  pkts long  time first    time last
===============  ===============  =============  ==========  =======  ===========  ==========  =========  ============  ============
10.0.10.77       10.255.0.2                2048  Et0/2             1  Et0/1          25669500      17113  05:55:44.559  05:56:24.416
10.255.0.2       10.0.10.77                   0  Et0/1             1  Et0/2          25659000      17106  05:55:44.560  05:56:24.418
10.0.12.2        10.255.0.1                2048  Et0/1             1  Null           13866000       9244  05:56:27.465  05:56:37.307
10.0.10.2        10.255.0.1                2048  Et0/2             1  Null            8404200       6003  05:56:21.527  05:56:31.319
10.255.0.2       10.255.0.1                   0  Et0/1             1  Null            6925500       4617  05:56:16.397  05:56:24.313
I removed the source port, ToS and TCP flags columns to fit the page. The rest is as printed. The router clock is in UTC, so 05:55 here is 21:55 Pacific.
The top row is the hog: 17,113 packets of 1500 bytes in 40 seconds. "Destination port" 2048 is how NetFlow records ICMP: type 8 (echo request) times 256, plus code 0. The replies show 0, which is echo reply. "Null" as the output interface means the router itself was the destination.
The cache only shows what's in memory right now, and flows leave it when they're exported. It's a good cross-check, not a history. For history you need the collector.
Step 6: the same answer in SQL
Akvorado stores flows in ClickHouse, so you can query it directly when the UI doesn't have the view you want. Here are the top pairs leaving through wan-rtr1's external interface over 15 minutes, using one exporter only so nothing is counted twice:
SELECT SrcAddr, DstAddr,
       dictGetOrDefault('protocols', 'name', Proto, '') AS proto,
       formatReadableSize(sum(Bytes * SamplingRate)) AS bytes
FROM flows
WHERE TimeReceived > now() - INTERVAL 15 MINUTE
  AND ExporterName = 'wan-rtr1.lab'
  AND OutIfBoundary = 'external'
GROUP BY SrcAddr, DstAddr, proto
ORDER BY sum(Bytes) DESC
LIMIT 5
SrcAddr DstAddr proto bytes
10.0.10.77 10.255.0.2 ICMP 433.52 MiB
10.0.10.2 10.255.0.2 ICMP 220.83 MiB
10.0.10.2 10.0.12.2 ICMP 183.37 MiB
10.0.10.2 10.255.0.2 TCP 1.80 KiBAddresses are stored as IPv6, so IPv4 shows up as ::ffff:10.0.10.77. I trimmed that prefix and the table borders. SamplingRate is 1 here because I don't sample. Keep it in the query anyway, so the numbers stay right if you turn sampling on later.
A checklist for the next "WAN is slow" ticket
- Confirm the link is busy with interface counters or SNMP before you open the flow tool.
- Filter on the WAN boundary, not on all traffic. Internal traffic between VLANs is noise for this question.
- Group by source, then destination, then protocol and port. One dimension at a time is quicker than a five-column table.
- Pick one exporter per question, or you will double-count traffic seen by two routers.
- Treat graph peaks with long active timeouts as approximate. Use averages and totals to compare talkers.
- Cross-check the top flow in the router's cache before you name names.
What this doesn't cover
Flows tell you who and what. They don't tell you whether the traffic is legitimate or whether the application was slow for another reason. For delay and loss you want something like IP SLA or a synthetic probe. Flows also don't see anything that bypasses the routers you export from, like traffic switched locally on the access switch.
If you're still choosing a NetFlow version for this, NetFlow versions compared covers v5, v9 and IPFIX.
Next in this series: running Akvorado and GoFlow2 with Loki on the same traffic, to see how far a lighter stack gets you.
Now live: Akvorado vs GoFlow2 + Loki compares both stacks on this same traffic.