
The Grafana and Loki flow setup from earlier in this blog answers "who used the link" well enough for one router. Once you want to slice traffic by interface, network, protocol and exporter in a few clicks, you want a real flow tool. This post feeds NetFlow v9 from two Cisco IOS XE 17.18.2 routers into Akvorado v2026.10.1, an open source flow collector that enriches every flow with SNMP interface data and stores it in ClickHouse. Everything here was built in my home lab, and every screenshot is from that build.
If Flexible NetFlow is new to you, start with Flexible NetFlow on Cisco IOS XE and NetFlow versions compared. The Loki version of this is NetFlow and IPFIX in Grafana. This post is the first in a short series on flow visibility.

What Akvorado is, and what it costs
Akvorado is written by Vincent Bernat and released under the AGPL-3.0 licence. There's no paid edition and no feature gate. If you modify it and offer it as a service to others, the AGPL asks you to publish your changes. Running it internally to watch your own network asks nothing of you.
It is several services, not one binary:
- inlet receives NetFlow v5/v9, IPFIX and sFlow and writes the raw packets to Kafka.
- outlet decodes them, polls exporters over SNMP for interface names, descriptions and speeds, runs your classification rules and writes rows to ClickHouse.
- orchestrator hands configuration to the other services and creates the ClickHouse tables.
- console is the web UI: a home page, and a Visualize page with time series, Sankey and grid views.
The upstream quickstart runs all of this, plus Kafka, ClickHouse, Redis and a Traefik reverse proxy, with Docker Compose. With my traffic loaded, ClickHouse used about 660 MB of RAM and Kafka about 700 MB. The Akvorado services themselves were 13 to 40 MB each. Plan for 2 GB of RAM and a few GB of disk for a small site. Disk grows with flow count, and ClickHouse compresses well.
The setup
Two routers, wan-rtr1 and wan-rtr2, connected by 10.0.12.0/30. Behind wan-rtr1 sits the access switch acc-sw1 on 10.0.10.0/24. Each router has a loopback in 10.255.0.0/24. Flow and SNMP traffic go over a separate management network, 10.66.20.0/24, which lives in a management VRF on the routers. The Akvorado inlet is 10.66.20.48 and the outlet, which does the SNMP polling, is 10.66.20.49.
One honest note before the screenshots: the traffic is synthetic. Python scripts drive the routers and the switch over SSH and run bursts of pings of different sizes between the LAN, the link and the loopbacks. There's real routing protocol traffic too (OSPF and the BGP session between the routers), but no internet traffic, so the AS and country fields stay empty.
Step 1: install Akvorado
mkdir akvorado && cd akvorado
curl -sL https://github.com/akvorado/akvorado/releases/latest/download/docker-compose-quickstart.tar.gz | tar zxf -
docker compose up -d
Before you run it, look at .env. It picks which compose files load. I commented out the IPinfo GeoIP line because nothing in my lab has a public address. Any change you make to ports or images goes in docker/docker-compose-local.yml, which the upstream files leave for you.
Gotcha: ClickHouse dies with exit code 132
My first start failed. The ClickHouse container kept restarting with status 132 and the log was full of this:
clickhouse-1  | /entrypoint.sh: line 42:    23 Illegal instruction     (core dumped) clickhouse extract-from-config ...
akvorado-clickhouse-1 Restarting (132) 2 seconds ago
Exit code 132 is SIGILL, an illegal CPU instruction. Since 26.6, ClickHouse on x86 needs a CPU with AVX2 (x86-64-v3). My server is an older Xeon E5-2670, which has AVX but not AVX2. The release I downloaded asks for ClickHouse 26.8. The fix is in a comment in the upstream docker-compose-local.yml: pin the last release that still runs on older CPUs.
services:
  clickhouse:
    image: clickhouse/clickhouse-server:26.3
Check your CPU first with grep -o -w avx2 /proc/cpuinfo | head -1. If that prints nothing, pin 26.3. After that, every service came up healthy and the console answered on port 8081.
Two other local changes: Traefik's private dashboard port, 8080, clashed with another web app on the same host, so I moved it. And I gave the inlet and outlet fixed addresses on the management network so the routers can export to a stable IP and the SNMP access list can allow the poller.
Step 2: tell Akvorado about your network
Everything you need to touch is in config/outlet.yaml. Three sections matter.
Networks. Akvorado tags each source and destination address with a name, role and site when it falls inside a prefix you list. This is what makes the Sankey diagram readable.
networks:
  networks:
    10.0.10.0/24: {name: access-lan, role: users, site: home-lab}
    10.0.12.0/30: {name: wan-link, role: wan, site: home-lab}
    10.255.0.0/24: {name: router-loopbacks, role: infra, site: home-lab}
    10.66.20.0/24: {name: oob-mgmt, role: mgmt, site: home-lab}
SNMP credentials. The outlet polls each exporter for interface names, descriptions and speeds. The default config uses SNMPv2c with community public. My routers only allow SNMPv3 with authentication and privacy, so I replaced it:
metadata:
  providers:
    - type: snmp
      credentials:
        10.66.20.0/24:
          user-name: zbxmon
          authentication-protocol: SHA
          authentication-passphrase: <AUTH_PASS>
          privacy-protocol: AES
          privacy-passphrase: <PRIV_PASS>
The key is a prefix, so one block covers every exporter on the management network. Lock the file down with chmod 600, since it now holds real passphrases.
Core settings and classifiers.
core:
  default-sampling-rate: 1
  exporter-classifiers:
    - ClassifySiteRegex(Exporter.Name, "^([^.]+)", "$1")
    - ClassifyRegion("home-lab")
    - ClassifyRole("wan-edge")
  interface-classifiers:
    - Interface.Description startsWith "to wan" && ClassifyConnectivity("wan") && ClassifyExternal()
    - Interface.Description startsWith "to acc" && ClassifyConnectivity("access") && ClassifyInternal()
    - ClassifyInternal()
default-sampling-rate is the one people miss. IOS XE doesn't put the sampling rate in its v9 export, and Akvorado rejects flows that arrive without one. I don't sample, so the rate is 1. If you configure a sampler on the router, set the real value here, or every byte count will be off by that factor.
The interface classifiers read the SNMP interface description. My router links are described to wan-rtr2, to acc-sw1 and so on, so a startsWith match is enough. On a real edge router you'd match descriptions like Transit: ISP-A instead. Interface descriptions suddenly become data, which is a good reason to keep them consistent.
The orchestrator watches the config files and restarts itself when they change. The outlet only reads its config at startup, so restart it too: docker compose restart akvorado-outlet. If a change doesn't seem to apply, check the orchestrator logs for a YAML error.
Step 3: configure the routers
Akvorado's docs say to sample on ingress, on every interface, with 10-second active and inactive timeouts, and their IOS XE example uses NetFlow v9. I don't sample, and I also export the interface table. Here's the config I used on both routers.
flow record AKV-REC
 match ipv4 tos
 match ipv4 protocol
 match ipv4 source address
 match ipv4 destination address
 match transport source-port
 match transport destination-port
 match interface input
 collect interface output
 collect transport tcp flags
 collect counter bytes long
 collect counter packets long
 collect timestamp sys-uptime first
 collect timestamp sys-uptime last
!
flow exporter AKV-EXP
 destination 10.66.20.48 vrf <MGMT-VRF>
 source Ethernet0/0
 transport udp 2055
 export-protocol netflow-v9
 template data timeout 60
 option interface-table
 option sampler-table
!
flow monitor AKV-MON
 exporter AKV-EXP
 record AKV-REC
!
interface Ethernet0/1
 ip flow monitor AKV-MON input
interface Ethernet0/2
 ip flow monitor AKV-MON input
!
ip access-list standard ZBX-SNMP
 40 permit 10.66.20.49
Why each piece is there:
- Input only. If you monitor both directions on every interface, every packet is counted twice. Akvorado gets the output interface from the
collect interface outputfield, so ingress monitoring still tells you where traffic left. vrfon the destination. Without it, the router looks for the collector in the global table and sends nothing, with no error.- The ACL line. The outlet polls SNMP from its own address. If your SNMP group has an access list, the poller must be on it. Otherwise flows arrive but interface names stay blank.
template data timeout 60. After a collector restart, Akvorado can't decode anything until it sees the template again.
The cache timeout problem
Akvorado's docs also suggest cache timeout active 10 and cache timeout inactive 10 under the monitor. The IOS XE 17.18.2 image I used doesn't have the cache command at all:
wan-rtr1(config)#flow monitor AKV-MON
wan-rtr1(config-flow-monitor)#cache ?
% Unrecognized command
So the defaults apply: 15 seconds inactive, 1800 seconds active. The router only reports a flow when it goes quiet for 15 seconds, or after 30 minutes. Akvorado then counts all of that flow's bytes at the moment it arrives. You'll see the effect in the graphs below as spikes. On a Catalyst 9000, ISR or ASR, set both timeouts as the docs say and the graphs smooth out.
Step 4: check the router before the console
wan-rtr1#show flow exporter AKV-EXP statistics
Flow Exporter AKV-EXP:
  Packet send statistics (last cleared 00:11:41 ago):
    Successfully sent:         30                    (5235 bytes)
  Client send statistics:
    Client: Option options interface-table
      Records added:           10
        - sent:                10
    Client: Flow Monitor AKV-MON
      Records added:           41
        - sent:                41
The interface table went out, and every flow record added was also sent. The cache shows what's being tracked right now:
wan-rtr1#show flow monitor AKV-MON cache format table
  Flows added:                                  47
  Flows aged:                                   41
    - Active timeout      (  1800 secs)          0
    - Inactive timeout    (    15 secs)         41

IPV4 SRC ADDR    IPV4 DST ADDR    TRNS SRC PORT  TRNS DST PORT  INTF INPUT  IP PROT  intf output   bytes long
10.0.12.2        10.0.12.1                59034            179  Et0/1             6  Null                7147
10.0.12.2        224.0.0.5                    0              0  Et0/1            89  Null                7200
10.0.10.2        10.255.0.2                   0           2048  Et0/2             1  Et0/1          121312000
10.255.0.2       10.0.10.2                    0              0  Et0/1             1  Et0/2          119255200
Every flow aged out on the inactive timer, none on the active one. Note the BGP session (port 179) and OSPF hellos (protocol 89 to 224.0.0.5) next to the test pings. Output Null means the router itself was the destination.
On the Akvorado side, the quickest check is ClickHouse itself:
docker compose exec clickhouse clickhouse-client -q "
  SELECT ExporterName, InIfName, InIfDescription, count(), sum(Bytes)
  FROM flows WHERE TimeReceived > now() - 600
  GROUP BY 1,2,3 ORDER BY 5 DESC"

wan-rtr2.lab   Et0/1   to wan-rtr1   111   576173453
wan-rtr1.lab   Et0/2   to acc-sw1    106   574673853
wan-rtr1.lab   Et0/1   to wan-rtr2   110   568644306
If InIfName and InIfDescription come back filled in, SNMP polling works. If they're empty, check the SNMP credentials and the access list on the router first.
The console
Traffic over time, by exporter and interface
Open Visualize, pick the ExporterName and InIfName dimensions, and you get a stacked graph of traffic per ingress interface across both routers.
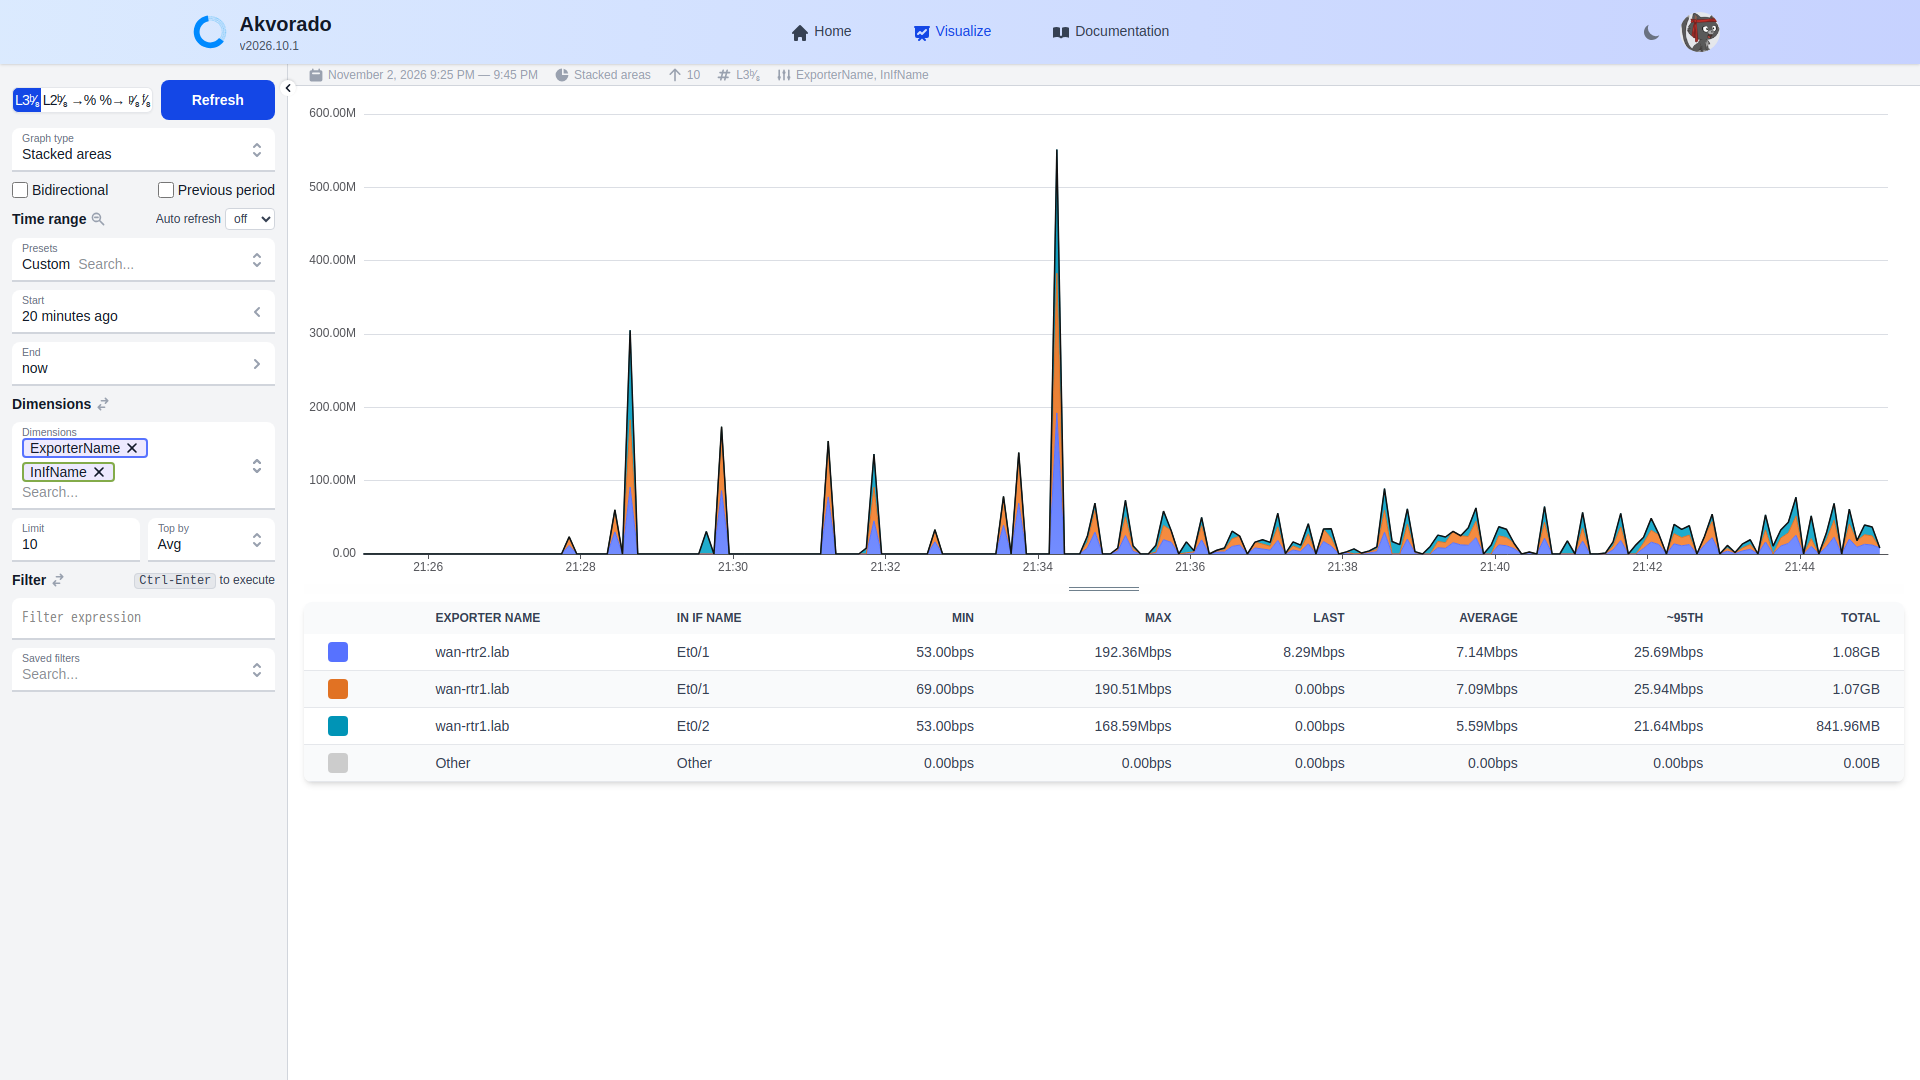
The tall spikes before 21:35 are from my first traffic run, where pings ran for up to 45 seconds with short gaps. With a 15-second inactive timer, those turned into long flows that were reported in one go. After I switched to short bursts with gaps longer than 15 seconds, the graph looks much more like real traffic. That's the cache timeout problem from above, and it's why you should set those timeouts on hardware that supports them.
SNMP enrichment and interface classification
Add InIfDescription, InIfSpeed, InIfConnectivity and InIfBoundary as dimensions and you can see the outlet's work.
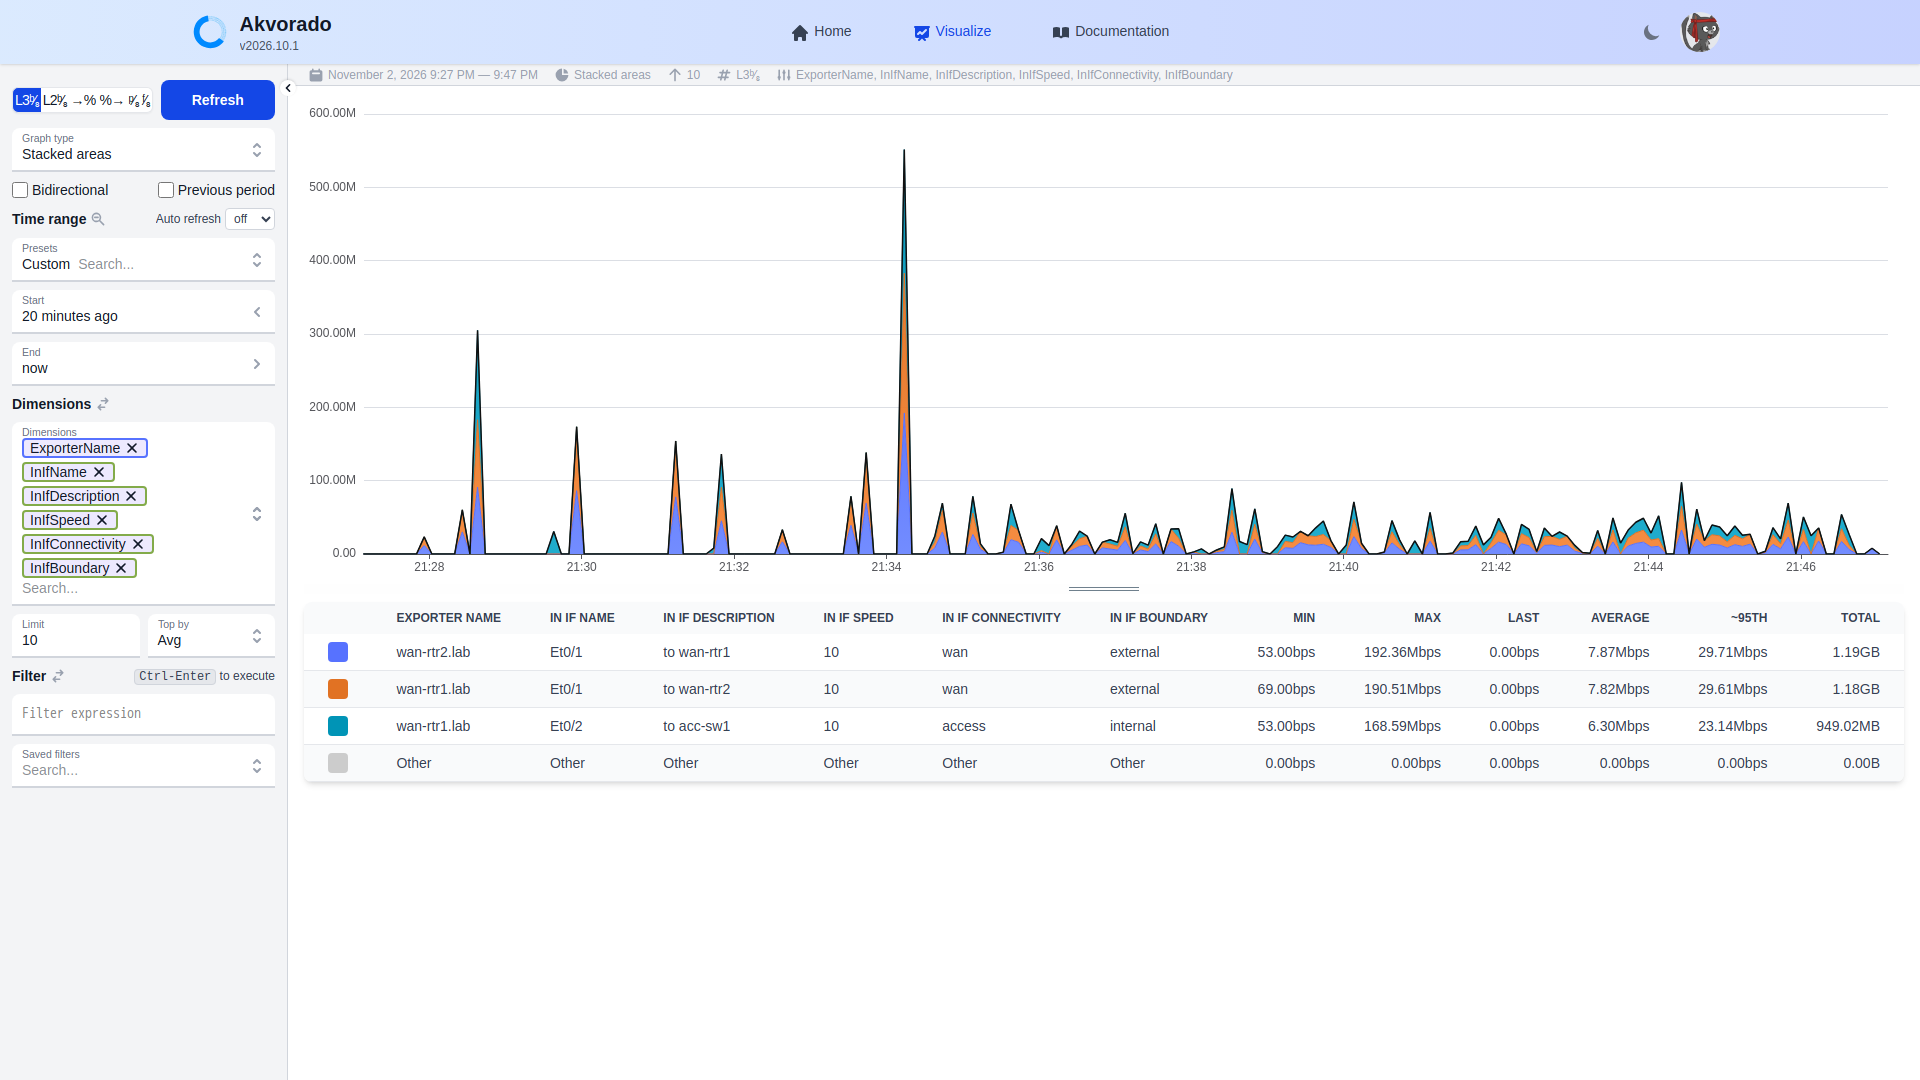
The router only sends an interface index in each flow. Et0/1, to wan-rtr2 and the speed came from SNMPv3 polling. wan/access and external/internal came from my two classifier lines. The speed column reads 10 (Mbps) because that's what these interfaces report over SNMP. It's also why the peaks look higher than the link speed: a whole burst gets counted in a single interval.
Sankey: where traffic comes from and goes
Switch the graph type to Sankey and pick SrcNetName, InIfConnectivity and DstNetName. Those network names are the ones from the networks block.
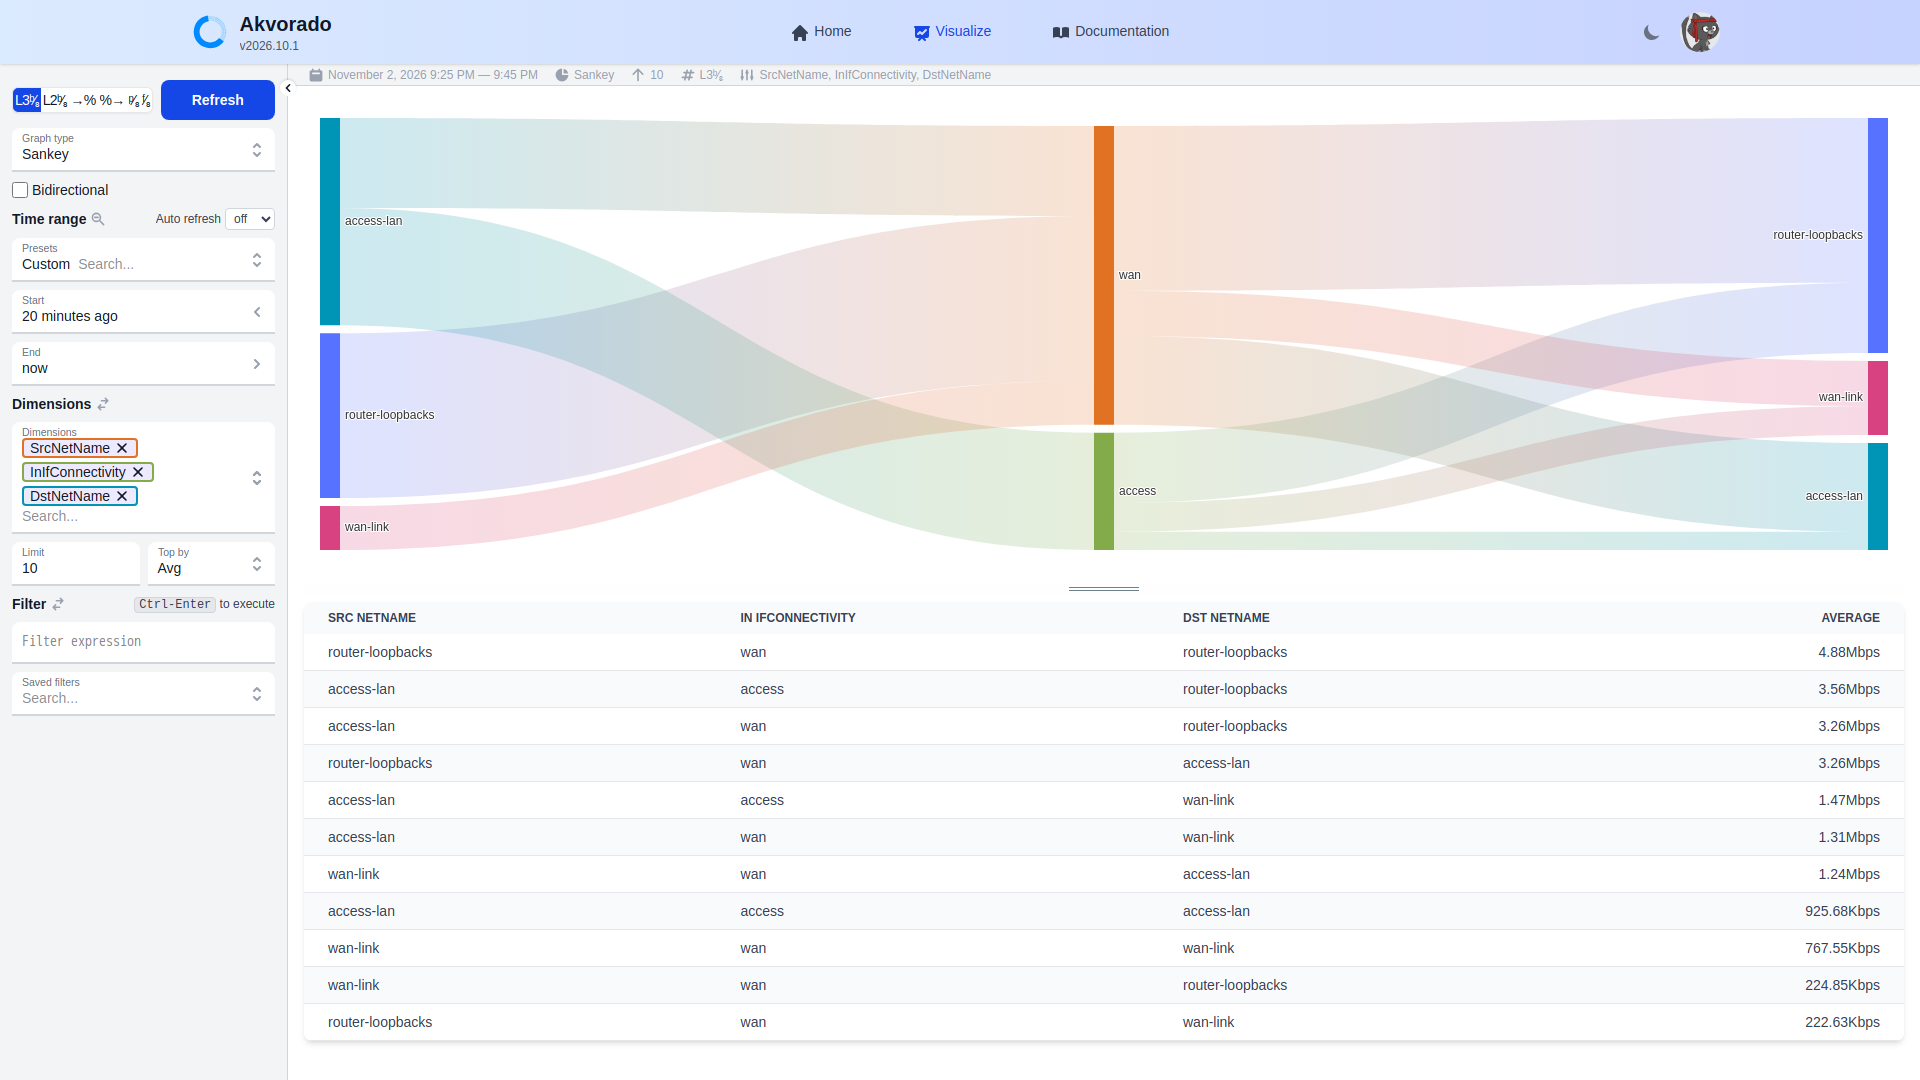
This is the view I'd put in front of someone who doesn't read flow tables. Traffic from access-lan enters on the access side and heads mostly to router-loopbacks. The return traffic comes in from the WAN side. On a real edge you'd use InIfProvider or DstAS here and see which upstream carries which customers.
Top talkers
Set the dimensions to SrcAddr and DstAddr. The table under the graph is your top-talkers list, ranked by average rate, with 95th percentile and total bytes.
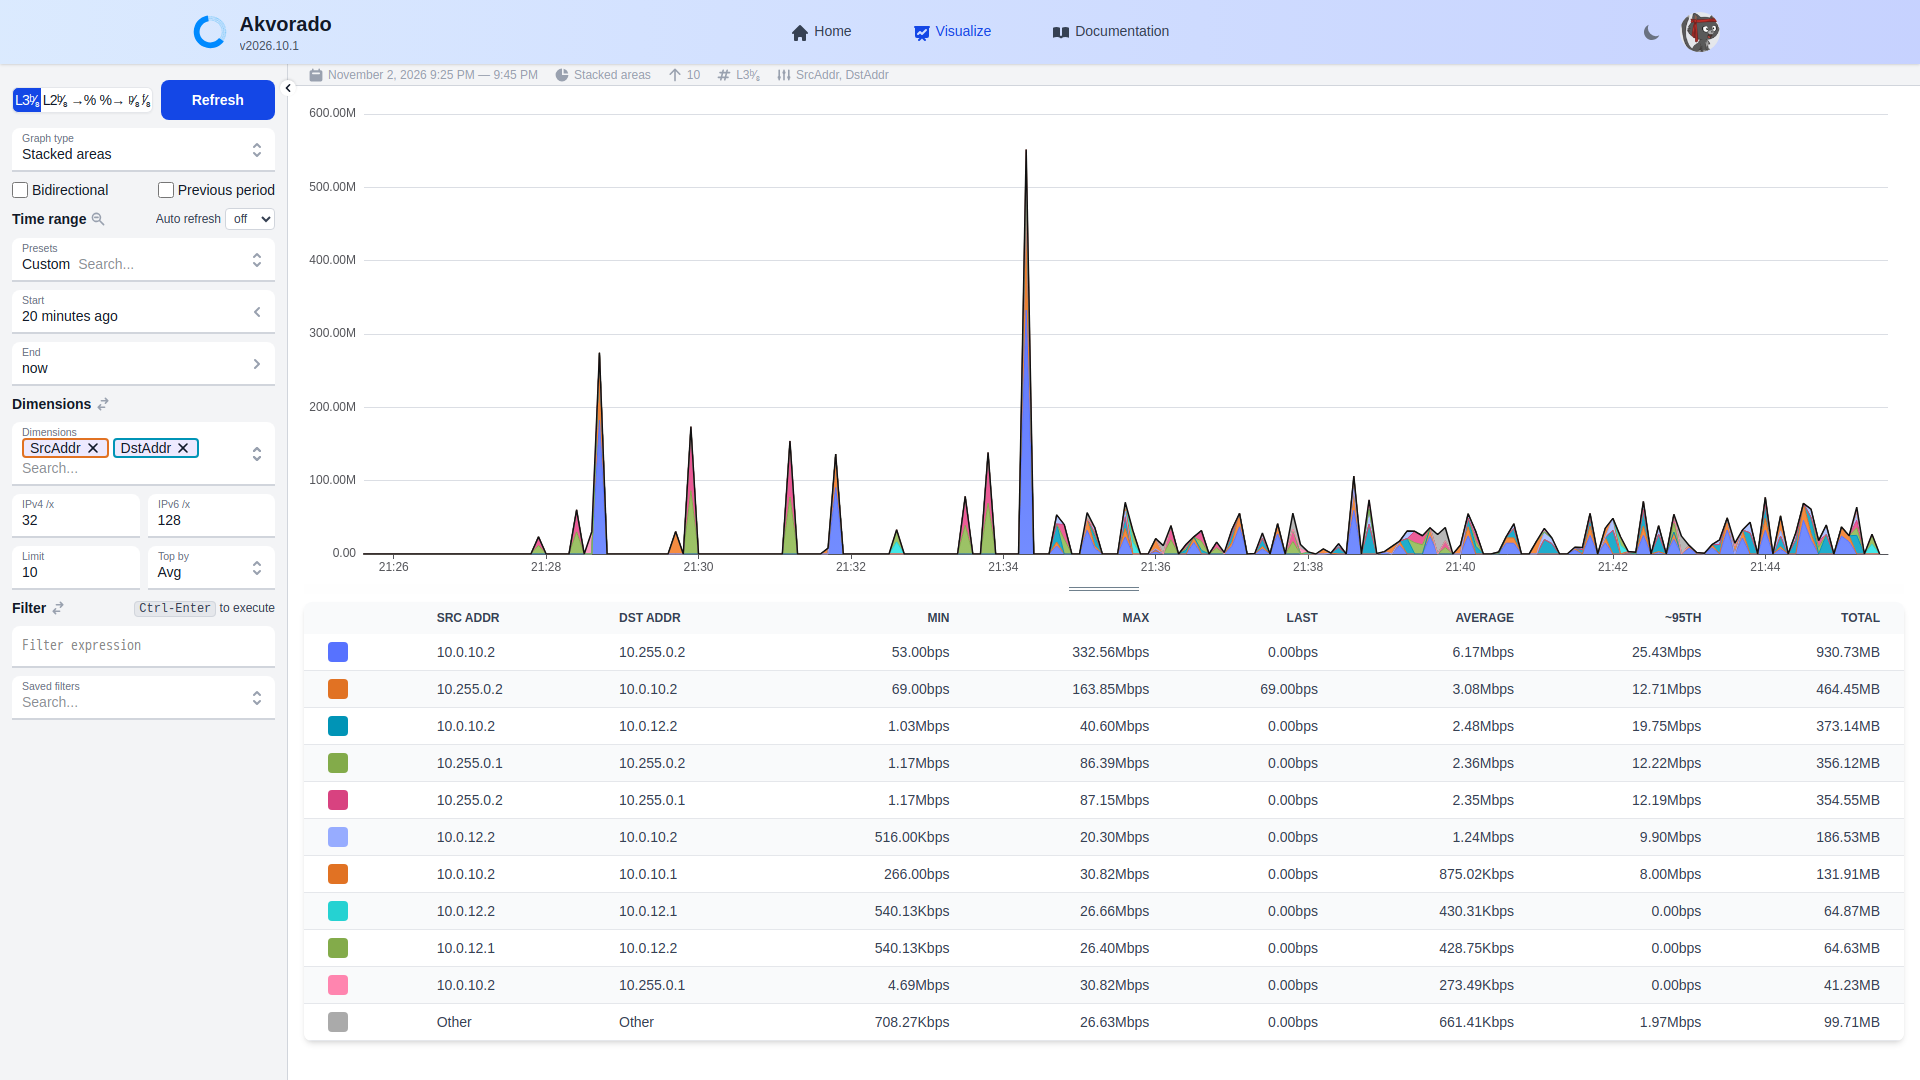
The top pair, 10.0.10.2 to 10.255.0.2, is the switch pinging the far router's loopback: 930 MB in 20 minutes. To drill down, put SrcAddr = 10.0.10.2 in the filter box and change the dimensions to InIfName and OutIfName.
Protocols and ports
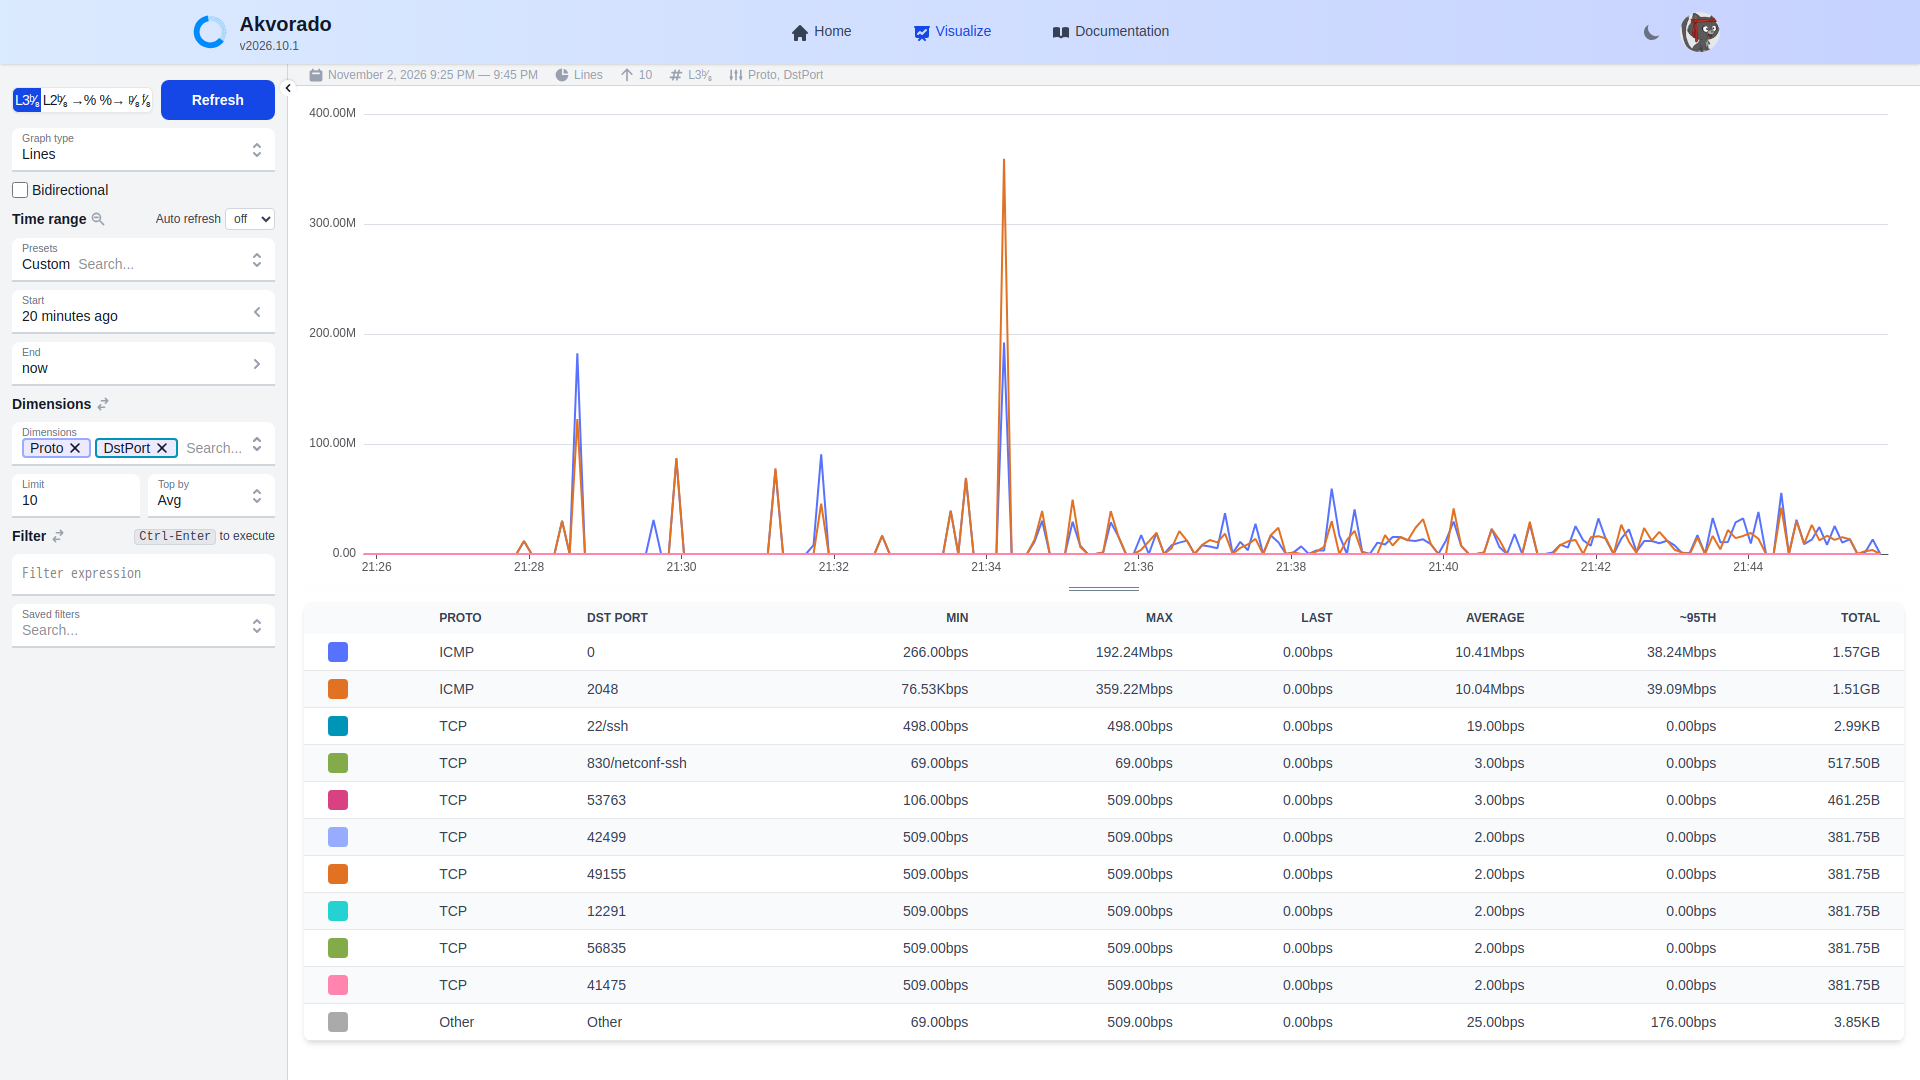
ICMP shows destination ports 2048 and 0. NetFlow puts ICMP type and code in the destination port field as type × 256 + code, so 2048 is echo request (type 8) and 0 is echo reply. The small TCP flows come from a separate script that opens connections to ports 22, 23, 80, 443 and 830 on a router. The high destination ports are the replies going back. That script comes in handy later in this series.
What it doesn't do (in this lab)
- No AS paths or countries. That needs public addresses, a GeoIP database and BMP or BGP feeding the outlet. Akvorado supports all of that, but there's nothing in a lab to show.
- Coarse timing on this image. Without
cache timeout, long flows only report every 30 minutes. Hardware platforms don't have this problem. - No alerting. Akvorado is for looking at traffic. For alerts, query ClickHouse from Grafana or send its metrics to Prometheus.
- Retention. By default, raw flows are kept for 15 days, then 1-minute rollups for a week, 5-minute for three months and 1-hour for a year. A query over last month is answered from the 5-minute table, not individual flows. You can change this with
resolutionsinakvorado.yaml.
Troubleshooting checklist
- ClickHouse restarting with 132: CPU lacks AVX2. Pin
clickhouse-server:26.3. - No flows in the console: run
show flow exporter ... statisticson the router. If "sent" is climbing, check the destination IP, thevrfkeyword and that UDP 2055 reaches the inlet. - Flows but blank interface names: SNMP. Check the credentials in
outlet.yamland that the outlet's IP is on the router's SNMP ACL. - Flows dropped with no error: no sampling rate. Set
default-sampling-rate. - Graph spikes instead of smooth lines: active timeout too long. Set it to 60 seconds or less where your platform allows.
Next in this series: using these same flows to answer "who is eating the WAN" during an actual incident, step by step.
Now live: Troubleshooting with NetFlow: who is eating the WAN? uses these flows to track down a bandwidth hog.